Abstract
Purpose: Lung function depends on lung expansion and contraction during the respiratory cycle. Respiratory-gated CT imaging and 3D image registration can be used to locally estimate lung tissue expansion and contraction (regional lung volume change) by computing the determinant of the Jacobian matrix of the image registration deformation field. In this study, the authors examine the reproducibility of Jacobian-based measures of lung tissue expansion in two repeat 4DCT acquisitions of mechanically ventilated sheep and free-breathing humans.
Methods: 4DCT image data from three white sheep and nine human subjects were used for this analysis. In each case, two 4DCT studies were acquired for each subject within a short time interval. The animal subjects were anesthetized and mechanically ventilated, while the humans were awake and spontaneously breathing based on respiratory pacing audio cues. From each 4DCT data set, an image pair consisting of a volume reconstructed near end inspiration and a volume reconstructed near end exhalation was selected. The end inspiration and end exhalation images were registered using a tissue volume preserving deformable registration algorithm and the Jacobian of the registration deformation field was used to measure regional lung expansion. The Jacobian map from the baseline data set was compared to the Jacobian map from the followup data by measuring the voxel-by-voxel Jacobian ratio.
Results: In the animal subjects, the mean Jacobian ratio (baseline scan Jacobian divided by followup scan Jacobian, voxel-by-voxel) was (mean ± standard deviation, averaged over the entire lung region). The mean Jacobian ratio was 1.0224 in the human subjects. The reproducibility of the Jacobian values was found to be strongly dependent on the reproducibility of the subject’s respiratory effort and breathing pattern.
Conclusions: Lung expansion, a surrogate for lung function, can be assessed using two or more respiratory-gated CT image acquisitions. The results show that good reproducibility can be obtained in anesthetized, mechanically ventilated animals, but variations in respiratory effort and breathing patterns reduce reproducibility in spontaneously-breathing humans. The global linear normalization can globally compensate for breathing effort differences, but a homogeneous scaling does not account for differences in regional lung expansion rates. Additional work is needed to develop compensation procedures or normalization schemes that can account for local variations in lung expansion during respiration.
Keywords: variability, image registration, lung expansion, regional pulmonary function
INTRODUCTION
The primary function of the respiratory system is gas exchange. Gas exchange depends on the complex mechanical inter-relationships between the lung tissue, diaphragm, chest wall, and ribs, the fluid dynamics behavior of the nose, mouth, and airways, and the gas diffusion properties of the alveoli. Since many diseases and injury conditions can affect these physical parameters, and thus, lung functions, it is useful to be able to reliably measure indices of lung function at the global and regional levels.
Global lung function can be assessed using spirometry. Spirometric indices such as forced expiratory volume in one second (FEV1) and forced vital capacity (FVC) are common indices of global respiratory system function. Regional pulmonary function is more difficult to measure. Invasive methods, such as percutaneously or surgically implanted parenchyma markers or inhaled fluorescent microspheres, are effective but not suited for translation to humans.1, 2, 3 Noninvasive methods include medical imaging approaches. Positron emission tomography (PET) and single photon emission computed tomography (SPECT) can provide a direct assessment of lung function,4, 5, 6, 7 but their application is limited by low spatial resolution. Hyperpolarized noble gas MR imaging (such as 129Xe and 3He) has been developed for functional imaging of pulmonary ventilation.8, 9, 10, 11, 12 Hyperpolarized MRI can provide enough temporal resolution to observe the dynamics of gas flow through the lung. However, the method is only partially quantitative and depicts very little anatomic detail. Xenon-enhanced CT is another imaging modality that can directly assess pulmonary ventilation by observing wash-in and wash-out rate of serial CT images.13, 14, 15 The need for very high temporal resolution to measure the wash-in/wash-out time constants limits the overall axial coverage to about 12 to 15 cm for this modality.
Respiratory-gated CT imaging and 3D image registration can be used to locally estimate lung tissue expansion and contraction (regional lung volume change) to obtain a ventilation map for the lung.16, 17 Reinhardt et al.16 compared registration-based estimation of regional lung function using the Jacobian to xenon-CT estimates of specific ventilation and reported average . Castillo et al.17 used image registration to compute both Jacobian-based and intensity-based of local lung function and compared these measures to SPECT functional measures. Their results demonstrate the equivalence of the analytic and geometric Jacobian for quantifying volume change and show both methods correlate well with global measurements and clinical SPECT. Recently, Yaremko et al.18 proposed a method incorporating image registration with 4DCT images to identify regions of highly functional lung for avoidance in intensity modulated radiation therapy (IMRT) planning in nonsmall-cell lung cancer. Ding et al.19 quantitatively measured the regional changes in lung tissue function following a course of radiation therapy by using 4DCT and image registration techniques. Yamamoto et al.20 also quantified the dosimetric impact of 4DCT and registration-derived ventilation maps on functional treatment planning to avoid highly functioning lung regions during radiation therapy. Vinogradskiy et al.21 used ventilation maps calculated from weekly 4DCT data to study ventilation change throughout the radiation therapy.
Along with the increased interest in registration-based estimates of lung function come questions about reproducibility and robustness of the overall approach. Nyeng et al.22 imaged five patients repeatedly with thoracic 4DCT scans, one scan with respiration restricted by an abdominal compression plate and the other under free breathing, but the reproducibility of the ventilation measurement was not investigated. Before registration-based techniques can be trusted to provide clinically meaningful measures of lung function or to track RT-induced changes in lung function over time, it is necessary to establish the uncertainty associated with such measurements.
A number of factors influence registration-based estimates of lung function. Assuming that two volumes are registered to obtain a Jacobian map of lung volume change, these individual volumes may be acquired with the subject apneic or may be selected from a 4DCT series. In the former case, the specific lung volumes at which the inspiratory and expiratory scans are acquired will directly affect the magnitude of the Jacobian values calculated from the image registration. In the latter case, the tidal volume and reproducibility of the tidal breathing during acquisition may influence the Jacobian calculation and overall consistency as data from several breaths are assembled into a single 4DCT volume. Choice of registration algorithm, associated image preprocessing, and regularization strategy will impact the registration accuracy and smoothness of the deformation field.23, 24 These factors will affect both the fidelity and noisiness of the resulting Jacobian maps.
If we consider the reproducibility of registration-based measures of lung function, subject-related factors become important. Even with prescan training and sophisticated pacing strategies, consistent and reproducible respiratory patterns may be difficult to maintain, as the subject must control breathing rate, tidal volume, and the interplay between thoracic vs abdominal breathing. In the case of static image acquisitions [e.g., near TLC (total lung capacity) and FRC (functional residual capacity)], the ability of the subject to reach the same volumes each time will directly influence the registration-based Jacobians, and thus, the estimates of local lung function.19 While the image processing and image registration factors also exist when considering reproducibility across two or more studies, it seems likely that subject variability is the major factor that determines overall measurement reproducibility. However, because it is difficult to separate the effects of subject variability, image acquisition differences, algorithm factors, and other uncertainties, in this paper, we look at the combined effect of all of these factors as a starting point to establish the reproducibility of lung tissue expansion measurements in repeated 4DCT acquisitions of the same subject.
Two different groups are studied in this paper: (1) spontaneously breathing human subjects; and (2) anesthetized and mechanically ventilated sheep. In both cases, two sets of image data are gathered for each group by scanning twice using 4DCT with a short time interval in-between acquisitions. From each 4DCT data set, one volume near end expiration and one volume near end inspiration are reconstructed. These volumes are registered using a B-spline deformable registration technique (described in Sec. 2C2) and the Jacobian of the registration deformation field is calculated. The Jacobians computed using the two separate 4DCT acquisition are compared to assess reproducibility.
MATERIAL AND METHODS
Method overview
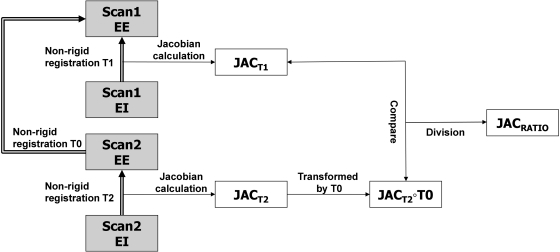
Figure 1 shows a block diagram of the entire process. Two 4DCT scans (denoted as scan one and scan two) are acquired for each subject with a short time interval between acquisitions. This so-called “coffee break” acquisition is intended to capture two separate images of the lung depicting the same anatomy and physiological condition. For each 4DCT scan, two volumes are selected and reconstructed: an image near full inspiration (denoted as end inspiration (EI)) and an image near end exhalation (denoted as EE). Three-dimensional B-spline deformable image registration is used to deform the EI image to the EE image, producing a registration deformation field. The Jacobian of this deformation field is computed and used to characterize the local lung tissue volume change. This process is performed for both the scans one and two data, producing registration transformations T1 and T2 and Jacobian images and .
Figure 1.
Block diagram shows the processing dataflow for the entire process. Scan one EE and scan two EE are volumes at end expiration and scan one EI and scan two EI are volumes at end inspiration. The Jacobians and are calculated from the registration displacement fields. The ratio image , computed in the scan one EE coordinate system, is used to assess Jacobian reproducibility.
Figure 1 and Table TABLE I. describe the three registration transformations used in this study. The coordinate system of scan one EE is used as the reference coordinate system for all comparisons. Transformation T0 is used to convert the Jacobian maps into a common coordinate system for comparison. The ratio map is the voxel-by-voxel ratio of the scan one Jacobian and scan two Jacobian. is computed in the scan one EE coordinate system. The ratio map is analyzed to assess reproducibility.
TABLE I.
Summary of the image registrations performed to calculate lung function. Names of images and transformations refer to those given in Fig. 1.
| Transformation name | Image transformed | Transformation is used to | |
|---|---|---|---|
| T0 | scan two EE → scan one EE | Transform the scan two Jacobian into the scan one EE coordinate system for comparison, producing | |
| T1 | scan one EI → scan one EE | Calculate scan one lung expansion map | |
| T2 | scan two EI → scan two EE | Calculate scan two lung expansion map |
Image data sets
Animal subjects
Appropriate animal ethics approval was obtained for these protocols from the University of Iowa Animal Care and Use Committee and the study adhered to NIH guidelines for animal experimentation. Data from three adult male sheep (denoted as S-1, S-2, and S-3), with weights 44.0, 37.8, and 40.4 kg, were collected. The sheep were anesthetized using intravenous pentobarbital and pancuronium to ensure adequate sedation and to prevent spontaneous breathing. Animals were positive pressure ventilated during experiments using a custom built dual Harvard apparatus piston ventilator designed for computer control. Respiratory rate for animals ranged from 15 to 18 breaths per minute. Two 4DCT images were acquired for each animal with a short (less than 10 min) time interval in between scans. The animals were not moved between scans. Images were acquired in the prone position using the dynamic imaging protocol with a pitch of 0.1, slice collimation of 0.6 mm, rotation time of 0.5 s, slice thickness of 0.75 mm, slice increment of 0.5 mm, 120 kV, and 400 mAs. The airway pressure signal was simultaneously recorded with the x-ray projections, and the images were reconstructed retrospectively using the B30f kernel to produce a full inspiration image (EI) and EE image.
Human subjects
All data from human subjects was gathered under a protocol approved by the University of Iowa Institutional Review Board. The human data consist of 4DCT data from nine human subjects about to undergo radiation therapy for lung cancer. While 12 human subjects (denoted H-1 to H-12) enrolled in the study, two subjects withdrew prior to data acquisition and one subject experienced heavy coughing during the 4DCT scan making his images unusable. The remaining nine subjects included five males and four females, with ages ranging from 31 to 78 years, with an average age of 57 ± 17 (mean ± standard deviation).
Prior to imaging, each subject was trained using a biofeedback system (RESP@RATE, Intercure Ltd., Lod Israel) to provide guidance for maintaining a constant breathing rate. Musical cues were used to pace respiration during imaging, using a technique developed at our institution which was previously shown to have high success.25
Two 4DCT scans are acquired for each subject, with a short time between scans. The subject left the scanner table between scans. Patients were scanned in supine position using a 40-slice CT scanner (Siemens Biograph, Hoffman Estate, IL) operating in helical mode. Imaging parameters were 120 kV, 2.0 mm slice thickness, 0.5 mm slice increment, 1.2 mm collimator, B30F medium smooth kernel reconstruction filter. Acquisition occurred with a pitch of 0.1 and either a tube rotation speed of 500 ms per rotation (requiring each respiratory cycle do not exceed 5 s) or 1000 ms per rotation (for respiratory cycles do not exceed 10 s). The amplitude of the respiratory motion was monitored using a strain gauge belt with a pressure sensor (Anzai, Tokyo, Japan).
Data processing
Preprocessing
After image acquisition and reconstruction, all images were examined for evidence of severe breathing artifacts or other acquisition problems. Such artifacts may disrupt the image registration process and lead to poor registration results and erroneous lung expansion measurements. Although reconstruction artifacts are common in 4DCT (Ref. 26) and are a source of variability in our analysis, with the exception of subject H-12, the images in this study were examined and found to contain minimal spatial reconstruction artifacts.27 The reconstruction artifacts may have been reduced by the audio-coaching for patient respiration and by the ability of helical mode image acquisition to allow manual selection of projection data to be used for image reconstruction at each phase. Subject H-12 had moderate motion artifacts, but it was decided to not eliminate this case from analysis.
Prior to image registration, the images of the animal subjects were resampled to size 288 × 288 × 352 with voxel size 1 mm × 1 mm × 1 mm. Images of the human subjects were resampled to the same voxel size but with image size 304 × 304 × 320voxels. The Pulmonary Workstation 2.0 software (VIDA Diagnostics, Inc., Iowa City, IA) was used to identify the lung regions in the CT images. The lung segmentations were manually inspected and modified if necessary. The binary mask obtained from the segmented lung was used to limit the spatial domain of image registration and subsequent lung function analysis. For each case, the lung volume was calculated by counting the number of voxels in the lung region and multiplying by the voxel volume. Tables 2, TABLE III. list the lung volumes measured for the subjects in this study.
TABLE II.
Summary of lung volumes for scans 1 and 2 in EE and EI images for three animal subjects. The “Tidal Vol.” column shows the volume difference from EE to EI. All volumes are in liters.
| Subject | Scan | EE(L) | EI(L) | Tidal Vol.(L) |
|---|---|---|---|---|
| S-1 | 1 | 2.79 | 3.14 | 0.38 |
| 2 | 2.87 | 3.24 | 0.37 | |
| S-2 | 1 | 2.50 | 2.88 | 0.38 |
| 2 | 2.62 | 3.01 | 0.39 | |
| S-3 | 1 | 2.80 | 3.34 | 0.54 |
| 2 | 2.93 | 3.49 | 0.56 |
TABLE III.
Summary of lung volumes for scans 1 and 2 in EE and EI images for nine human subjects. The “Tidal Vol.” column shows the volume difference from EE to EI. All volumes are in liters. The “Interscan Interval” column gives the approximate time between the scan one and scan two acquisition. The “Before Reg. Median Lmk. Dist.” column gives the median distance of landmark points in EE and EI before registration, which gives an indication of the amount of motion within the lung during inhalation. The “TRE” column gives the mean ± standard deviation of the target registration error.
| Subject | Scan | EE (L) | EI (L) | Tidal Vol. (L) | Before Reg. Median Lmk. Dist. (mm) | TRE (mm) | Interscan interval |
|---|---|---|---|---|---|---|---|
| H-1 | 1 | 1.24 | 1.72 | 0.48 | 9.30 | 0.85 | 54 min |
| 2 | 1.26 | 1.94 | 0.68 | 13.0 | 1.21 | ||
| H-2 | 1 | 5.24 | 5.86 | 0.62 | 7.10 | 0.80 | 61 min |
| 2 | 5.34 | 5.91 | 0.57 | 5.80 | 1.20 | ||
| H-4 | 1 | 2.90 | 3.39 | 0.49 | 10.9 | 1.32 | 20 h |
| 2 | 2.83 | 3.41 | 0.58 | 12.9 | 1.68 | ||
| H-7 | 1 | 5.26 | 5.72 | 0.46 | 3.70 | 0.72 | 33 min |
| 2 | 5.69 | 6.37 | 0.68 | 4.10 | 0.97 | ||
| H-8 | 1 | 3.02 | 3.79 | 0.77 | 8.30 | 1.05 | 7 days |
| 2 | 3.12 | 4.35 | 1.23 | 8.70 | 1.41 | ||
| H-9 | 1 | 3.65 | 4.50 | 0.85 | 7.20 | 1.74 | 35 min |
| 2 | 3.81 | 4.33 | 0.52 | 4.70 | 2.07 | ||
| H-10 | 1 | 2.09 | 2.63 | 0.54 | 6.60 | 1.22 | 64 min |
| 2 | 2.14 | 2.61 | 0.47 | 6.60 | 1.73 | ||
| H-11 | 1 | 3.51 | 4.09 | 0.58 | 4.60 | 2.08 | 33 min |
| 2 | 3.54 | 4.22 | 0.67 | 4.60 | 2.00 | ||
| H-12 | 1 | 3.95 | 5.11 | 1.16 | 13.2 | 3.38 | 29 min |
| 2 | 3.91 | 5.14 | 1.23 | 13.1 | 3.65 |
Image registration
For each subject, the EI image was registered to the EE image using tissue volume preserving nonrigid registration algorithm previously developed by our group.28 The algorithm uses a cubic B-spline transformation model and multiresolution optimization procedure to minimize the sum of squared tissue volume difference (SSTVD) (Ref. 29) subject to a Laplacian regularization constraint, as described in the following equation:
| (1) |
where is the SSTVD cost, is the Laplacian regularization constraint, and ρ is a weighting parameter. The registration algorithm produces a dense voxel-by-voxel displacement field transforming the EI image to the EE image.
The SSTVD term in the cost function, first introduced by Yin et al.,29 provides a lung-specific intensity similarity criterion that can compensate for the expected change in CT intensity as air is inspired or expired during the respiratory process. For a given lung voxel at location x, assumed to be composed of only air and tissue, the tissue volume V(x) at voxel coordinate x can be estimated as
| (2) |
where is the total volume of voxel x and and are the CT values of air and tissue. Following,29 we use HU and HU. In this case, the SSTVD metric can be written as
| (3) |
where and represent the CT image data from the EI and EE images being registered, Ω denotes the union of the left and right lung regions, and represents the transformation being estimated.
The Laplacian regularization term enforces a smoothness constraint on the registration displacement fields , where . The regularization term is defined as in Ref. 30
| (4) |
where and . By adjusting the ρ parameter in Eq. 1, one can balance registration intensity matching performance against deformation field smoothness. In this study, was found to provide the best tradeoff between registration field smoothness and registration accuracy.
Assessment of image registration accuracy
Anatomic landmarks were used to assess registration accuracy in the T1 and T2 transformations (matching the EI image to the EE image in scans 1 and 2) and the T0 transformation (matching EE scan two to EE in scan one). A semiautomatic landmarking system was employed for landmark selection and establishing correspondence between images.31 Approximately 100–140 vascular bifurcation points were manually identified within the lungs for each human data set. The landmarks were approximately uniformly distributed within the left and right lungs. Landmark correspondence was established by visualizing both the EE and EI images simultaneously. Each landmark pair that was manually annotated by the observer was added to a thin-plate-spline to warp the image and predict the location for the next unmatched landmark pair. The thin-plate spline processing greatly increased the efficiency of the landmark annotation. To assess registration accuracy, the landmark positions predicted by the registration algorithm are compared to the actual landmark positions defined by the human expert.
Jacobian calculation and reproducibility measurement
Regional tissue expansion can be estimated from the determinant of the Jacobian matrix (or simply, Jacobian) of the registration deformation field.16 If we assume that lung expansion (contraction) is due solely to the flow in (out) of air during respiration, the Jacobian can serve as a surrogate for regional lung function.32 For a vector-valued registration deformation field at voxel location x, the Jacobian is given by
| (5) |
In a Lagrangian reference frame, if the Jacobian is greater than one, there is local tissue expansion; if the Jacobian is less than one, there is local tissue contraction. A Jacobian value equal to one indicates there is no expansion or contraction at that location. Finite differences were used to numerically compute Jacobian. For visualization, the Jacobian map is color-coded and overlaid onto the original CT data.
The Jacobian maps from scan one and scan two are compared to establish the level of reproducibility. The ratio of the Jacobian maps from scan one, , and scan two, , was computed voxel-by-voxel to produce a new map . If the two acquisitions and subsequent image processing produced exactly the same lung expansion estimates, would be equal to one everywhere. The mean and standard deviation of were calculated for all subjects.
Compensating for variations in respiratory effort
Respiratory effort differences, which may occur even with training and respiratory time cues during imaging, can cause scan-to-scan variation in tidal volume and the associated pulmonary function measurements. One possible approach to account for these variations is to apply a correction to the calculated Jacobian map. Since the average Jacobian should reflect the global volume change in the lung, the Jacobian ratio for scans one and two should be approximately equal to the ratio of the EE and EI volume ratios for the two scans. Thus, these volume ratios can be used as a global linear normalization factor to adjust for lung volume differences between scans one and two. We apply this normalization strategy for all human scans in this study.
RESULTS
Registration accuracy
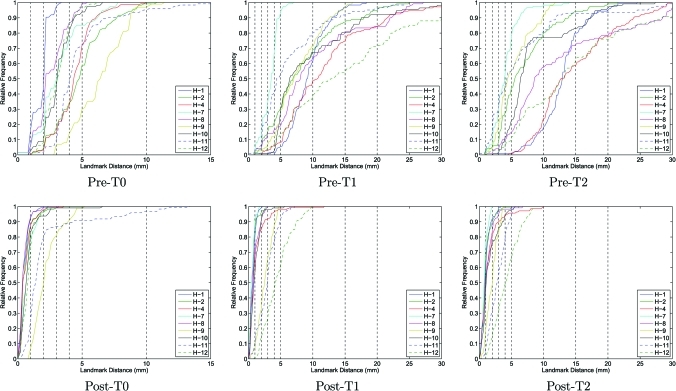
Figure 2 shows the cumulative histograms of the landmark distances preregistration and postregistration for the T0, T1, and T2 transformations. The preregistration histograms show the landmark distances after rigid registration was applied to align the data sets prior to the nonlinear B-spline registration. The postregistration histograms show the landmark distributions after the B-spline registration is applied. Target registration error (TRE) values after registrations T1 and T2 are summarized in Table TABLE III..
Figure 2.
Cumulative histograms of the landmark distances pre- and post-B-spline registration for the T0, T1, and T2 transformations.
Pulmonary function measurements in animal model
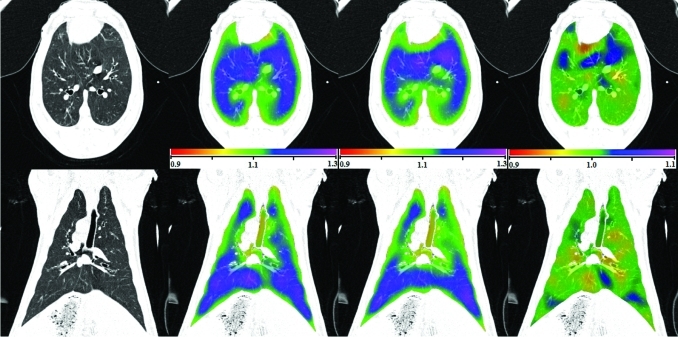
Figure 3 shows transverse and coronal views of the original CT image, the Jacobian map calculated from scan one and from scan two, and the Jacobian ratio image for animal S-1. As illustrated in Fig. 1, the Jacobian image from scan two () is transformed through the T0 transformation to convert it into the coordinate system of scan one, producing . The T0 transformation allows the two Jacobian images to be directly compared and allows us to compute the voxel-by-voxel ratio image . The results for animals S-2 and S-3 are similar.
Figure 3.
Transverse (top) and coronal (bottom) views of (left to right) the original CT, , , and for animal subject S-1. Note the color scales for and are 0.9 to 1.3, and for the scale is 0.9 to 1.1.
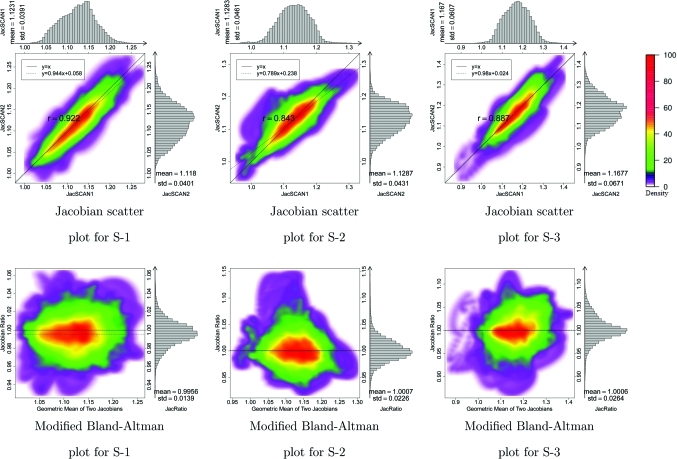
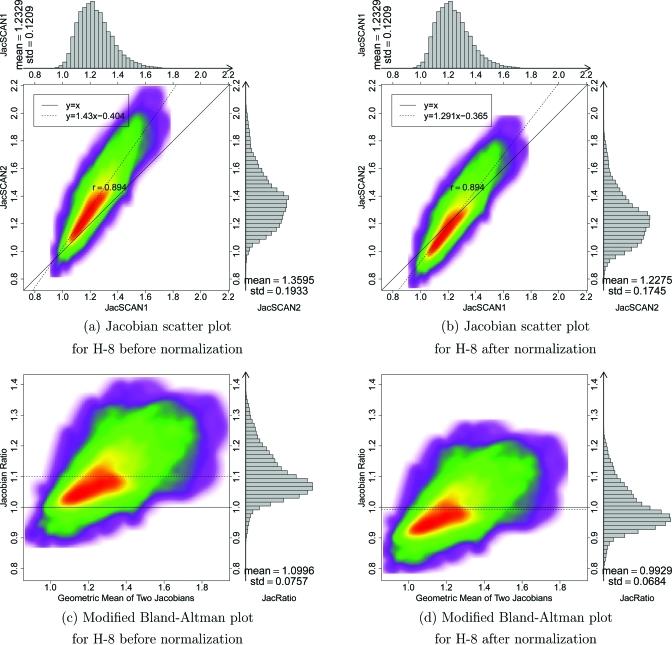
Figure 4 shows in the top row 2D kernel density estimates33 for the voxel-by-voxel comparison of the scans one and two Jacobian data for the three animal subjects. These plots are displayed with a color overlay that shows the joint cumulative distribution of the and data. Marginal histograms of the and data are plotted along the top and right sides of the figures. A linear regression analysis was performed to find the best fit linear model to represent the relationship between the scan one and scan two Jacobian data. Pearson’s correlation coefficient was computed for the linear model, with an average correlation value of 0.88 in the three subjects. The bottom row of Fig. 4 are modified Bland–Altman plots for the three animals. A Bland–Altman plot is a difference plot for analyzing the agreement between two different assays. The conventional Bland–Altman plot shows the difference of two measurements versus the mean of two measurements. Since the Jacobian represents the ratio of expansion or contraction in local lung volume, we modified the Bland–Altman plot to show the ratio of and versus the geometric mean of and . The modified Bland–Altman plot is overlaid with colors to show a 2D kernel density estimate. Histograms of the data are plotted along the right side of the figures. The solid line is the reference line where equals to one, representing perfect agreement in the two measurements. The dashed line is the average of . The closeness of the dashed line and solid line is one measure of the consistency of our measurement in lung expansion in two scans.
Figure 4.
The top row shows density scatter plots and marginal histograms of and for animals S-1, S-2, and S-3, ordered left to right. Histograms and summary statistics for the and data are given along the top and right sides of each plot. Colorbar showing scatter points density is shown at right. The bottom row is modified Bland–Altman plots for three animal subjects. The horizontal axis shows and the vertical axis shows .
Pulmonary function measurements in human subjects
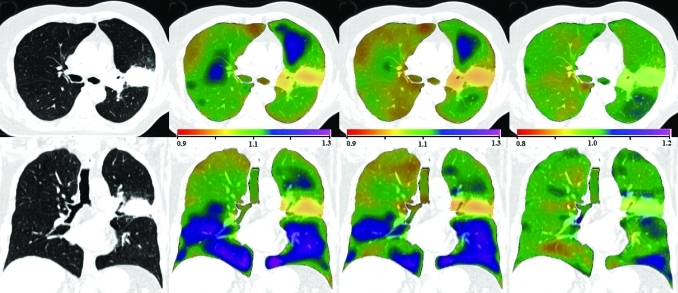
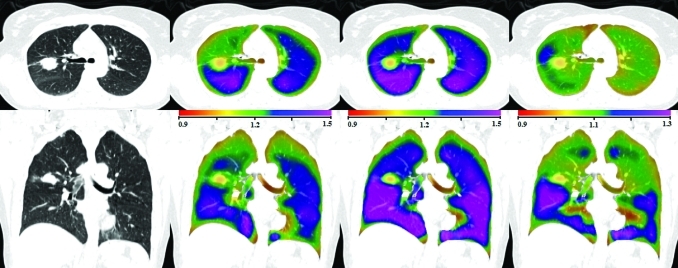
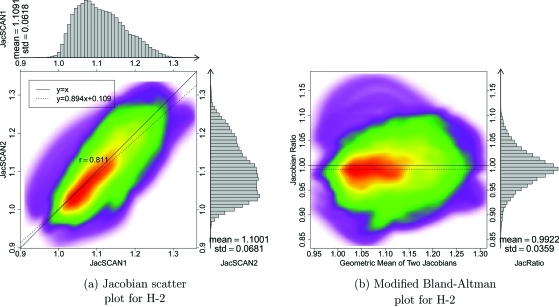
Figures 56 show the transverse and coronal views of the original CT image, the Jacobian map calculated from scan one and from scan two, and the Jacobian ratio image for human subjects H-2 and H-8. As with the animal subjects, the scan two Jacobian image has been transformed into the coordinate system of scan one using the T0 transformation. Subjects H-2 and H-8 were selected to illustrate cases with good and poor reproducibilities when comparing the scan one to scan two results. Figure 7 shows the 2D kernel density estimate for the voxel-by-voxel comparison of the scan one and scan two and the modified Bland–Altman plot for subject H-2. Figure 7b shows the mean voxel-by-voxel Jacobian ratio is approximately 0.9922, which is very close to the ideal value of unity.
Figure 5.
Transverse (top) and coronal (bottom) views of (left to right) the original CT, , , and for human subject H-2. Note the color scales for and are 0.9 to 1.3, and for the scale is 0.8 to 1.2.
Figure 6.
Transverse (top) and coronal (bottom) views of (left to right) the original CT, , , and for human subject H-8. Note the color scales for and are 0.9 to 1.5, and for the scale is 0.9 to 1.3.
Figure 7.
(a). Smoothed color density scatter plot and marginal histograms of and for H-2. Histograms and summary statistics for the and data are given along the top and right sides of each plot. Colorscale is same as in Fig. 4. (b) Modified Bland–Altman plot for H-2. The horizontal axis shows and the vertical axis shows .
Compensation for scan-to-scan variation in respiratory effort
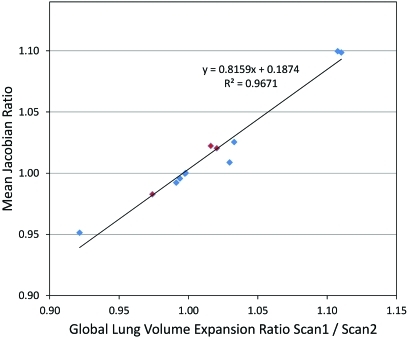
Figure 8 shows the relationship between the mean Jacobian ratio and the ratio of EI to EE volumes for scan two to the ratio of those volumes in scan one (the lung volumes are given in Tables 2, TABLE III.). If the EI to EE ratio changes in scan two from that in scan one, the change indicates an increased or decreased level of effort. Consequently, the Jacobian ratio between scan two and scan one should depict this effort difference as a corresponding increase or decrease in lung expansion. The figure shows that the mean Jacobian ratio is strongly correlated with the EE and EI volume ratios in scans one and two.
Figure 8.
The mean Jacobian ratio vs the ratio of global lung volume expansion ratio for scan one to scan two for three animal subjects and nine human subjects. The animal subjects are marked with red diamonds and the human subjects are marked with blue diamonds.
From Table TABLE III., a global lung expansion factor can be computed by taking the ratio of the end inspiration to end expiration volumes for each of scans one and two. Then, a normalization scale factor for the Jacobian of the second scan can be determined by taking the ratio of the lung expansion factor for scan one to the lung expansion factor for scan two. Taking subject H-8 as an example, the global expansion factors are 1.25 and 1.39 for scans one and two, producing a multiplicative normalization factor of 0.9. This approach for global linear normalization is applied to all human subjects and results are summarized in Table TABLE IV..
TABLE IV.
Means, standard deviations, and CV of the Jacobian ratio images, correlation coefficients and regression line slopes of Jacobian images and for three animal subjects and nine human subjects. Columns four, five, and nine show the normalized results for the human subjects. After normalization, the mean and standard deviation of the Jacobian ratio images are scaled accordingly, while the CV stays the same.
| JacRatio | Norm. JacRatio | Regression line slope | ||||||
|---|---|---|---|---|---|---|---|---|
| Subject | Mean | Std | Mean | Std. | CV | Corr. Coef. | Bef. Norm. | Aft. Norm. |
| S-1 | 0.996 | 0.0139 | — | — | 0.0140 | 0.922 | 0.944 | — |
| S-2 | 1.000 | 0.0226 | — | — | 0.0226 | 0.843 | 0.789 | — |
| S-3 | 1.000 | 0.0264 | — | — | 0.0264 | 0.887 | 0.980 | — |
| H-1 | 1.099 | 0.0565 | 0.990 | 0.0509 | 0.0514 | 0.937 | 1.289 | 1.161 |
| H-2 | 0.992 | 0.0359 | 1.001 | 0.0362 | 0.0362 | 0.811 | 0.894 | 0.902 |
| H-4 | 1.025 | 0.0681 | 0.993 | 0.0659 | 0.0664 | 0.860 | 1.143 | 1.106 |
| H-7 | 1.009 | 0.0515 | 0.980 | 0.0500 | 0.0511 | 0.570 | 0.528 | 0.513 |
| H-8 | 1.100 | 0.0757 | 0.993 | 0.0683 | 0.0688 | 0.894 | 1.430 | 1.291 |
| H-9 | 0.951 | 0.0527 | 1.032 | 0.0572 | 0.0554 | 0.772 | 0.522 | 0.566 |
| H-10 | 0.983 | 0.0635 | 1.009 | 0.0652 | 0.0646 | 0.820 | 0.774 | 0.795 |
| H-11 | 1.020 | 0.0666 | 1.000 | 0.0653 | 0.0653 | 0.755 | 0.824 | 0.808 |
| H-12 | 1.022 | 0.0747 | 1.006 | 0.0735 | 0.0731 | 0.850 | 0.769 | 0.757 |
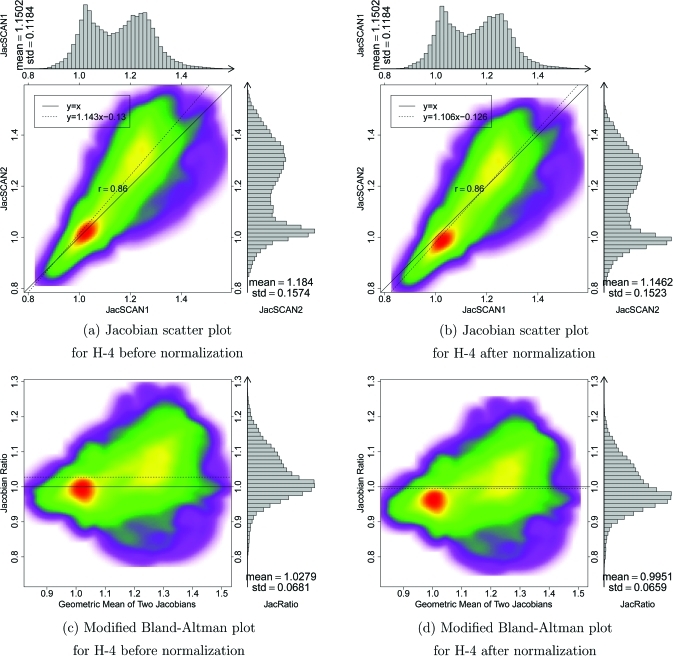
H-8 is an example of a subject that has significant breathing effort differences between the two 4DCT scans. Figure 9 shows the Jacobian scatter plot and modified Bland–Altman plot of patient H-8 before and after the Jacobian in scan two is scaled by a constant global normalization factor. This global linear normalization brings the center of mass of the scatter plot closer to unity, indicating more reproducible measurements. Figure 10 shows the results before and after normalization for subject H-4. In this case, the global linear normalization produces a mean that is closer to one and a regression line slope that is closer to one; however, the normalization shifts the mode of the Jacobian ratio distribution (red region in density plot) away from unity.
Figure 9.
Smoothed color density scatter plot and marginal histograms of and for H-8 before (a) and after (b) global linear normalization. Modified Bland–Altman plots for H-8 before (c) and after (d) global linear normalization.
Figure 10.
Smoothed color density scatter plot and marginal histograms of and for H-4 before (a) and after (b) global linear normalization. Modified Bland–Altman plots for H-4 before (c) and after (d) global linear normalization.
Assessing reproducibility via the Jacobian ratio images
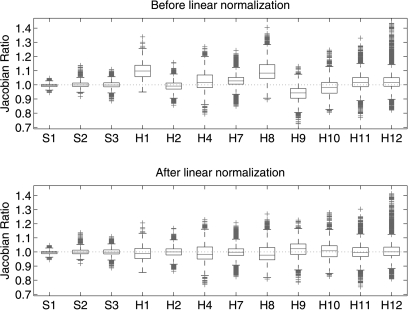
If the subject, image acquisition, and image analysis were perfectly reproducible, the Jacobian values computed from scan one and scan two would match exactly and the Jacobian ratio images would be equal to one everywhere. Figure 11 shows box plots of the Jacobian ratio values for the three animal subjects and nine human subjects before and after the global linear normalization. Table TABLE IV. summarizes and compares the statistical parameters before and after normalization, including the mean, standard deviation (Std), coefficient of variation (CV) of , the correlation coefficient between and , and the slope of regression line.
Figure 11.
Box plots for Jacobian ratio images for three animal subjects and nine human subjects, before and after global linear normalization on human subjects. Box plot lower extreme is first quartile, box plot upper extreme is third quartile. Median is shown with solid horizontal line. Whiskers show the minimum (maximum) values or extend 1.5 times the first to third quartile range beyond the lower (upper) extreme of the box, whichever is smaller (larger). Outliers are marked with red plus signs. Number of data points has been downsampled by a factor of 1000 for visualization.
DISCUSSION
The results in Fig. 2 show that the B-spline registration is effective at aligning the user-defined landmarks, with 90% of the landmark distances below 5 mm after registration for eight of the nine human cases. The remaining case, case H-12, was especially difficult for the manual analyst in that it was difficult to precisely locate landmarks and to determine the exact correspondences. Thus, it is likely that some of the residual landmark positioning error after registration for case H-12 (and perhaps others) is due in part to motion artifacts and in part by human error during landmarking. Based on the data in Fig. 2 and Table TABLE III., the mean landmark positioning error is on the order of a few millimeters, which is similar in performance to earlier work.16, 23, 28, 30 It is interesting to note that the given landmark results for case H-12 and the comparisons in Fig. 2, H-12 is not the subject with the worst reproducibility, i.e., for case H-12, the large residual landmark positioning error does not lead to poor reproducibility in the Jacobian maps. This apparent contradiction lends further support to the hypothesis that case H-12 has unreliable manually defined landmarks.
The pre-T1 graphs in Fig. 2, the lung volumes in Tables 2, TABLE III., and the median landmark distances before registration in Table TABLE III. give some insight into the reproducibility of the subjects in terms of respiratory patterns and level of inspiration. The pre-T1 graphs in Fig. 2 show the amount of landmark motion within the lung during inhalation, which varied greatly between human subjects. Table TABLE III. shows considerable variation in the differences of tidal volumes and median landmark displacements for scans one and two, with no clear relationship between these two measurements.
Figures 34 show a good reproducibility of the calculated Jacobian maps in the animal model. The Jacobian histograms are very similar in scans one and two and the linear regression of the voxel-by-voxel comparison between and has a slope close to unity. The modified Bland–Altman plot shows that the average Jacobian ratio is approximately equal to one for all three cases. This is not surprising given that the animals were anesthetized and mechanically ventilated during these studies and were not moved between image acquisitions. As shown in Table TABLE II., the EE and EI lung volumes, and thus the tidal volumes, were very reproducible in the animal experiments. From several different perspectives, the reproducibility results in these animal studies probably represent the very best reproducibility measurement that we can expect across repeat studies of this type in humans.
Figures 56 show examples of data from human subjects with good and poor reproducibilities. Table TABLE III. shows that subject H-2 is a case where the lung volumes and tidal volumes were very consistent between scans one and two, while the data for case H-8 shows a considerable change in the EI volume, and thus a change in the overall tidal volume. Interestingly, case H-8 was one in which scan two was acquired 1 week after scan one, but prior to radiation therapy. It is possible that there were physiological changes during the time between scans, or perhaps the subject simply forgot some of the respiratory training and breathed differently during the second acquisition. If the latter explanation is true, this may have important implications for respiratory monitoring equipment and patient training procedures. Also, note that the increase of Jacobian is not uniformly distributed within the lung but reveals highly organized regions of increased ventilation.
Figures 7109 shows the scan one vs scan two comparison of the Jacobian data for subjects H-2, H-4, and H-8. Comparing the and histograms and the linear regression line slopes, case H-2 has the best reproducibility. From the Jacobian histograms of H-4, it is interesting to note that subject H-4 has a bimodal Jacobian distribution. The statistical parameters in Table TABLE IV. might be interpreted with the help of Table TABLE III., which shows the EE, EI, and tidal volumes for the scans one and two acquisitions. Some of the cases with linear regressions slopes very different from unity, such as cases H-1, H-7, H-8, and H-9, are all cases where there was a big (200 cc or more) change in tidal volume between scan one and scan two. This increase (or decrease) in tidal volume would lead to an increased (or decreased) amount of lung expansion, thus directly affecting the Jacobian values. Therefore, in these cases the subjects’ breathing patterns were not reproducible, which in turn caused the lung expansion maps to be not reproducible.
Static breath-hold imaging in place of 4DCT would reduce imaging artifacts induced by variability in breathing patterns but has some important disadvantages. The most significant disadvantage is the inability of a free-breathing subject to reproducibly reach and hold full inspiration (TLC) in repeat studies, which will undermine the reproducibility of any lung expansion measures derived from breath-hold acquisition.34 In addition, imaging data acquired with the subject apneic does not elucidate the relationship between tumor position and respiratory phase during tidal breathing, which is needed for gated treatment delivery.
The difficulty of precise breath control in clinical 4DCT creates a need for a compensation or normalization scheme that can be used to account for breathing effort variation in different studies. Since the mean Jacobian is strongly correlated with the lung volume ratios (see Fig. 8), an obvious and straightforward normalization method is to apply a multiplicative factor to one of the two lung expansion maps. The multiplicative factor can be computed from the EI and EE lung volumes ratios in scans one and two. Since this approach scales the entire expansion map by single constant, this normalization is a global linear normalization. Figure 11 shows that the mean is closer to unity after such a normalization. Comparing the scatter plot and modified Bland–Altman plot for H-8 before and after normalization (Fig. 9), the slope of the regression line is closer to one and the average is closer to one, showing the effectiveness of the effort normalization. However, the effectiveness of global linear normalization for subject H-4 is less clear. Though the regression line and the average of are closer to one after normalization (see Fig. 10), the mode of the distribution is biased away from the desired value of one. From the data given in Table TABLE IV., six of nine subjects have regression line slopes closer to one after global linear normalization. Note that after normalization the mean and standard deviation of are also scaled by the normalization factor, while the CV and correlation coefficient are unchanged.
Ideally, a lung volume normalization scheme should account for the fact that the rates of lung expansion and contraction are not uniform apex to base and ventral to dorsal. Because of this, it seems unlikely that a single global normalization constant is the optimal approach to locally compensate for differences in inspiration level between scans.
The box plot data in Fig. 11 summarize the distribution of the data for three animal subjects and nine human subjects. It is clear from the figure that there is less variation in the mechanically ventilated animal subjects than in the spontaneously breathing human subjects. There are outliers in the distribution in both the animal and human subjects; some of this might be attributable to the fact that small registration errors in the T0 transformation used to match the and data may incorrectly align a voxel experiencing high expansion (say, normal tissue) with a voxel of low or near zero expansion (such as a blood vessel or airway wall). The resulting Jacobian ratio could be very high, producing an outlier. By reversing the high expansion and low expansion voxels and following a similar reasoning, very low ratio values could also be produced. One solution to this might be to use different methods to compare the Jacobian maps, such as an approximate method that matches Jacobian values within a neighborhood of voxels.
Several statistical parameters of the distributions are given in Table TABLE IV. for all subjects. These parameters may be useful for estimating confidence intervals and performing statistical tests to detect changes in lung expansion between two scans, as might be expected during a longitudinal study tracking a disease process or an intervention such as radiation therapy. By combining the information in Table TABLE IV. with image analysis techniques that can identify clusters of voxels that exhibit similar changes in Jacobian value, it may be possible to use the Jacobian map to quantitatively monitor lung function on a very regional level.
SUMMARY
Local measures of lung function are difficult to obtain with sufficient spatial and temporal resolution. Lung expansion, a surrogate for lung function, can be assessed using two or more respiratory-gated CT image acquisitions. In this study, we have examined the reproducibility of such measures using two 4D image acquisitions taken with a short time interval between acquisitions. The results show that a good reproducibility can be obtained in anesthetized, mechanically ventilated animals, but variations in respiratory effort and breathing patterns reduce reproducibility in spontaneously breathing humans. Global linear normalization can globally compensate breathing effort differences, but homogeneous scaling does not account for differences in regional lung expansion rates. Additional work is needed to develop effective compensation procedures or regional normalization schemes that can account for human variation during respiration.
ACKNOWLEDGMENTS
The authors would like to thank Dr. K. Murphy and Dr. B. van Ginneken for providing the software ix for annotating landmarks. This work was supported in part by Grant Nos. HL079406, HL064368, and EB004126 from the National Institutes of Health and by a University of Iowa Carver College of Medicine Pilot Grant.
References
- Hoffman E., Behrenbeck T., Chevalier P., and Wood E., “Estimation of pleural surface expansile forces in intact dogs,” J. Appl. Physiol. 55(3), 935–948 (1983)http://jap.physiology.org/content/55/3/935.short. [DOI] [PubMed] [Google Scholar]
- Robertson H., Glenny R., Stanford D., Mclnnes L., Luchtel D., and Covert D., “High-resolution maps of regional ventilation utilizing inhaled fluorescent microspheres,” J. Appl. Physiol. 82(3), 943–953 (1997).http://jap.physiology.org/content/82/3/943.short [DOI] [PubMed] [Google Scholar]
- Hubmayr R. D., Bosch W., Chevalier P., Rodarte J. R., and Olson L., “Topographical distribution of regional lung volume in anesthetized dogs,” J. Appl. Physiol. 54(4), 1048–1056 (1983). 10.1063/1.332108 [DOI] [PubMed] [Google Scholar]
- Schuster D. P., “Positron emission tomography: Theory and its application to the study of lung disease,” Am. Rev. Respir. Dis. 139, 818–840 (1989).http://ajrccm.atsjournals.org/content/139/3/818.full.pdf [DOI] [PubMed] [Google Scholar]
- Wellman T., Winkler T., Costa E., Musch G., Harris R. S., Venegas J. G., and Melo M. F. V., “Measurement of regional specific lung volume change using respiratory-gated PET of inhaled 13N-nitrogen,” J. Nucl. Med. 51, 646–53 (2010). 10.2967/jnumed.109.067926 [DOI] [PMC free article] [PubMed] [Google Scholar]
- Harris R. S. and Schuster D. P., “Visualizing lung function with positron emission tomography,” J. Appl. Physiol. 102(1), 448–458 (2007). 10.1152/japplphysiol.00763.2006 [DOI] [PubMed] [Google Scholar]
- Venegas J. G., Winkler T., Musch G., Melo M. F. V., Layfield D., Tgavalekos N., Fischman A. J., Callahan R. J., Bellani G., and Harris R. S., “Self-organized patchiness in asthma as a prelude to catastrophic shifts,” Nature (London) 7034(2–3), 777–782 (2005). 10.1038/nature03490 [DOI] [PubMed] [Google Scholar]
- Moller H. E., Chen X. J., Saam B., Hagspiel K. D., Johnson G. A., Altes T. A., de Lange E. E., and Kauczor H.-U., “MRI of the lungs using hyperpolarized noble gases,” Magn. Reson. Med. 47(6), 1029–1051 (2002). 10.1002/(ISSN)1522-2594 [DOI] [PubMed] [Google Scholar]
- Wild J., Paley M. N. J., Kasuboski L., Swift A., Fichele S., Woodhouse N., Griffiths P., and van Beek E. J. R., “Dynamic radial projection MRI of inhaled hyperpolarized 3He gas,” Magn. Reson. Med. 49(6), 991–997 (2003).http://onlinelibrary.wiley.com/doi/10.1002/mrm.10477/full [DOI] [PubMed] [Google Scholar]
- van Beek E. J., Wild J. M., Kauczor H.-U., Schreiber W., J. P.MuglerIII, and de Lange E. E., “Functional MRI of the lung using hyperpolarized 3-helium gas,” J. Magn. Reson. Imaging 20(4), 550–554 (2004). 10.1002/(ISSN)1522-2586 [DOI] [PubMed] [Google Scholar]
- Woodhouse N., Wild J., Paley M. N., Fichele S., Said Z., Swift A., and van Beek E. J. R., “Combined helium-3/proton magnetic resonance imaging measurement of ventilated lung volumes in smokers compared to never-smokers,” J. Magn. Reson. Imaging 21(4), 365–369 (2005). 10.1002/(ISSN)1522-2586 [DOI] [PubMed] [Google Scholar]
- Hoffman E. A. and van Beek E., “Hyperpolarized media MR imaging—Expanding the boundaries?,” Acad. Radiol. 13(8), 929–931 (2006). 10.1016/j.acra.2006.06.002 [DOI] [PubMed] [Google Scholar]
- Marcucci C., Nyhan D., and Simon B. A., “Distribution of pulmonary ventilation using Xe-enhanced computed tomography in prone and supine dogs,” J. Appl. Physiol. 90(2), 421–430 (2001). 10.1063/1.1376412 [DOI] [PubMed] [Google Scholar]
- Tajik J. K., Chon D., Won C.-H., Tran B. Q., and Hoffman E. A., “Subsecond multisection CT of regional pulmonary ventilation,” Acad. Radiol. 9, 130–146 (2002). 10.1016/S1076-6332(03)80163-0 [DOI] [PubMed] [Google Scholar]
- Chon D., Simon B. A., Beck K. C., Shikata H., Saba O. I., Won C., and Hoffman E. A., “Differences in regional wash-in and wash-out time constants for xenon-CT ventilation studies,” Respir. Physiol. Neurobiol. 148(1–2), 65–83 (2005). 10.1016/j.resp.2005.06.003 [DOI] [PubMed] [Google Scholar]
- Reinhardt J. M., Ding K., Cao K., Christensen G. E., Hoffman E. A., and Bodas S. V., “Registration-based estimates of local lung tissue expansion compared to xenon CT measures of specific ventilation,” Med. Image Anal. 12(6), 752–763 (2008). 10.1016/j.media.2008.03.007 [DOI] [PMC free article] [PubMed] [Google Scholar]
- Castillo R., Castillo E., Martinez J., and Guerrero T., “Ventilation from four-dimensional computed tomography: Density versus Jacobian methods,” Phys. Med. Biol. 55(16), 4661–4685 (2010). 10.1088/0031-9155/55/16/004 [DOI] [PubMed] [Google Scholar]
- Yaremko B. P., Guerrero T. M., Noyola-Martinez J., Guerra R., Lege D. G., Nguyen L. T., Balter P. A., Cox J. D., and Komaki R., “Reduction of normal lung irradiation in locally advanced non-small-cell lung cancer patients, using ventilation images for functional avoidance,” Int. J. Radiat. Oncol., Biol., Phys. 68(2), 562–571 (2007). 10.1016/j.ijrobp.2007.01.044 [DOI] [PMC free article] [PubMed] [Google Scholar]
- Ding K., Bayouth J. E., Buatti J. M., Christensen G. E., and Reinhardt J. M., “4D CT-based measurement of changes in pulmonary function following a course of radiation therapy,” Med. Phys. 37(3), 1261–1273 (2010). 10.1118/1.3312210 [DOI] [PMC free article] [PubMed] [Google Scholar]
- Yamamoto T., Kabus S., von Berg J., Lorenz C., and Keall P. J., “Impact of four-dimensional computed tomography pulmonary ventilation imaging-based functional avoidance for lung cancer radiotherapy,” Int. J. Radiat. Oncol., Biol., Phys. 2, 1–10 (2010). 10.1016/j.ijrobp.2010.02.008 [DOI] [PubMed] [Google Scholar]
- Vinogradskiy Y. Y., Castillo R., Castillo E., Chandler A., Martel M. K., and Guerrero T., “Use of weekly 4DCT-based ventilation maps to quantify changes in lung function for patients undergoing radiation therapy,” Med. Phys. 39(1), 289–298 (2012). 10.1118/1.3668056 [DOI] [PubMed] [Google Scholar]
- Nyeng T. B., Kallehauge J. F., Høyer M., Petersen J. B., Poulsen P. R., and Muren L. P., “Clinical validation of a 4D-CT based method for lung ventilation measurement in phantoms and patients,” Acta Oncol. 50, 897–907 (2011). 10.3109/0284186X.2011.577096 [DOI] [PubMed] [Google Scholar]
- Murphy K., van Ginneken B., Reinhardt J., Kabus S., Ding K., Deng X., Cao K., Du K., Christensen G., Garcia V., Vercauteren T., Ayache N., Commowick O., Malandain G., Glocker B., Paragios N., Navab N., Gorbunova V., Sporring J., de Bruijne M., Han X., Heinrich M., Schnabel J., Jenkinson M., Lorenz C., Modat M., McClelland J., Ourselin S., Muenzing S., Viergever M., De Nigris D., Collins D., Arbel T., Peroni M., Li R., Sharp G., Schmidt-Richberg A., Ehrhardt J., Werner R., Smeets D., Loeckx D., Song G., Tustison N., Avants B., Gee J., Staring M., Klein S., Stoel B., Urschler M., Werlberger M., Vandemeulebroucke J., Rit S., Sarrut D., and Pluim J., “Evaluation of registration methods on thoracic CT: The EMPIRE10 challenge,” IEEE Trans. Med. Imaging 30(11), 1901–1920 (2011). [DOI] [PubMed] [Google Scholar]
- Yamamoto T., Kabus S., Klinder T., Lorenz C., von Berg J., Blaffert T., Loo B. W., and Keall P. J., “Investigation of four-dimensional computed tomography-based pulmonary ventilation imaging in patients with emphysematous lung regions,” Phys. Med. Biol. 56, 2279–2298 (2011). 10.1088/0031-9155/56/7/023 [DOI] [PubMed] [Google Scholar]
- Waldron T., Bayouth J., Bhatia S., and Buatti J., “Use of music-based breathing training to stabilize breathing motion in respiration correlated imaging and radiation delivery,” Int. J. Radiat. Oncol., Biol., Phys. 72(Suppl 1), S659–S659 (2008). 10.1016/j.ijrobp.2008.06.347 [DOI] [Google Scholar]
- Yamamoto T., Langner U., B. W.Loo., Jr., J. S. B. S., and Keall P. J., “Retrospective analysis of artifacts in four-dimensional CT images of 50 abdominal and thoracic radiotherapy patients,” Int. J. Radiat. Oncol., Biol., Phys. 72, 1250–1258 (2008). 10.1016/j.ijrobp.2008.06.1937 [DOI] [PMC free article] [PubMed] [Google Scholar]
- Han D., Bayouth J., Bhatia S., Sonka M., and Wu X., “Characterization and identification of spatial artifacts during 4D-CT imaging,” Med. Phys. 38, 2074–2087 (2011). 10.1118/1.3553556 [DOI] [PMC free article] [PubMed] [Google Scholar]
- Cao K., Ding K., Christensen G. E., and Reinhardt J. M., “Tissue volume and vesselness measure preserving nonrigid registration of lung CT images,” Proc. SPIE 7623, 762309 (2010). 10.1117/12.844541 [DOI] [Google Scholar]
- Yin Y., Hoffman E. A., and Lin C.-L., “Mass preserving nonrigid registration of CT lung images using cubic B-spline,” Med. Phys. 36(9), 4213–4222 (2009). 10.1118/1.3193526 [DOI] [PMC free article] [PubMed] [Google Scholar]
- Cao K., Du K., Ding K., Reinhardt J. M., and Christensen G. E., “Regularized nonrigid registration of lung CT images by preserving tissue volume and vesselness measure,” Medical Image Analysis for the Clinic: A Grand Challenge (2010 MICCAI workshop, Beijing, 2010). [Google Scholar]
- Murphy K., van Ginneken B., Klein S., Staring M., de Hoop B., Viergever M., and Pluim J., “Semi-automatic construction of reference standards for evaluation of image registration,” Med. Image Anal. 15(1), 71–84 (2011). 10.1016/j.media.2010.07.005 [DOI] [PubMed] [Google Scholar]
- Ding K., Cao K., Amelon R. E., Christensen G. E., Raghavan M. L., and Reinhardt J. M., “Comparison of intensity- and Jacobian-based estimates of lung regional ventilation,” 49–60 Third International Workshop on Pulmonary Image Analysis (2010).
- Adler J., R in a Nutshell (O’Reilly Media, Sebastopol, California, 2010). [Google Scholar]
- Shaker S. B., Dirksen A., Laursen L. C., Skovgaard L. T., and Holstein-Rathlou N.-H., “Volume adjustment of lung density by computed tomography scans in patients with emphysema,” Acta Radiol. 45(4), 417–423 (2004). 10.1080/02841850410005525 [DOI] [PubMed] [Google Scholar]


