

OA Diagnosis: Imaging
Characterized by degenerative changes in the bones, cartilage, menisci, ligaments, and synovial tissue, osteoarthritis (OA) has evolved to be considered a disease of the whole joint. Using imaging, OA has traditionally been diagnosed with radiographs that demonstrate joint space width (JSW) and osteophytes. Recently, additional modalities such as magnetic resonance imaging (MRI), ultrasound (US), and optical coherence tomography (OCT), have enhanced OA diagnosis and management through improvements in soft tissue depiction.
Early identification of OA is crucial to improving clinical decision-making and advancing the understanding of disease progression and treatment options. This article will review the various modalities available for OA imaging and assessment, focusing on their utility as tissue-specific diagnostic tools for OA of the knee.
Modality Overview
Radiography
Despite the development of newer imaging techniques, the radiograph remains the most accessible tool in the evaluation of the OA joint. The knee joint is typically evaluated using the extended-knee radiograph, which is a bilateral anteroposterior image acquired while the patient is weight-bearing, with both knees in full extension. More recently, flexed-knee radiographs with varying degrees of flexion and x-ray beam angles have been employed to improve intra-articular visualization. Radiographs are used to evaluate osteophyte formation and joint space narrowing (JSN); grading schemes such as the Kellgren-Lawrence grading scheme [1] and the Osteoarthritis Research Society International classification score establish guidelines for the diagnosis of OA progression [2].
MRI
MRI manipulates image contrast to highlight different tissue types. Common contrast methods include 2D or multi-slice T1-weighted, proton density (PD), and T2-weighted imaging [3]. Spin echo (SE) and Fast-spin echo (FSE) imaging techniques are useful in evaluating focal cartilage defects. Recent improvements in hardware, software, gradients, and radiofrequency (RF) coils have led to the use of fast or turbo-spin echo imaging, fat saturation and water excitation [3] to improve tissue contrast. Several semiquantitative, morphologic MRI scoring systems have been developed for evaluation of the knee joint in OA. Modified forms of the Outerbridge scale are routinely used for assessment of cartilage lesions, specifically with regard to defect depth. Whole-organ assessment, however, has proven increasingly useful, as it allows thorough evaluation of articular features. Furthermore, whole organ assessment has shown reliability, specificity, and sensitivity and an ability to identify lesion progression [4–7]. The Whole-Organ Magnetic Resonance Imaging Score [7], the Knee Osteoarthritis Scoring System [6], and the Boston Leeds Osteoarthritis Knee Score [5] are the three published systems available for evaluation of the whole knee joint.
OCT
Optical coherence tomography (OCT) captures cross-sectional echographs of infrared light and acquires near-real time images of articular cartilage [8]. This method requires placement of the endoscope immediately on the cartilage, so is done at the time of arthroscopy. OCT is incorporated into arthroscopes and generates cross-sectional images of articular cartilage at resolutions comparable to low-power histology [9–11]. Consequently, OCT can provide quantitative information about the disease state of articular cartilage [12]. OCT has been shown to be sensitive to collagen structural changes resulting from acute trauma and degeneration [9, 13, 14] and OA-associated changes in cartilage birefringence [13].
US
Current US technology offers many advantages, including multiplanar image acquisition, the ability to image dynamic structures in real-time, lack of ionizing radiation [15], and utility in interventional procedures [16, 17]. Furthermore, US is cost-effective and can be used without contrast enhancement (CE) to visualize various tissues involved in OA [18].
Tissue-Specific Imaging
Subchondral bone
Radiography
Bony changes in OA have traditionally been assessed using radiographs. In the early stages of disease onset, developments such as osteophytes, subchondral sclerosis, or subchondral cysts are well visualized with this modality. As OA progresses, radiography is used to assess JSW, which provides an indirect measure of the integrity of both hyaline and fibrocartilage. OA severity is often classified by subsequent JSN and the simultaneous appearance of subchondral bone abnormalities such as cysts or sclerosis [1, 19, 20].
Since the 1970s, the standard view for radiographic assessment of the tibiofemoral joint has been the extended-knee radiograph, which is a bilateral anteroposterior image acquired while the patient is weight-bearing, with both knees in full extension [21] (Figure 1). More recently, alternative imaging protocols have proposed imaging of the flexed knee to address the shortcomings of the extended-knee radiograph, which is suboptimal for longitudinal joint assessment [22]. These protocols utilize different degrees of knee flexion, x-ray beam angles, and positioning strategies, but all create a contact point between the tibia and posterior aspect of the femoral condyle for improved visualization of the joint space [23–26].
Figure 1.

A) Antero-posterior weight bearing radiographs of a patient with joint space narrowing and osteophyte formation consistent with bilateral medial osteoarthritis of the knee. Joint pace narrowing is greater in the right knee (arrow) compare with the left knee. B) A magnified view of the right knee joint. The arrow denotes medial JSN. Osteophyte formation can be seen on the femur and tibia.
The primary utility of radiography in the diagnosis of OA is for evaluation of JSW. JSW and subsequent JSN were originally assessed using manual techniques that required minimal additional equipment or processing software [27, 28]. However, these methods were time consuming and subjective and have since been largely abandoned in favor of automated assessment, which provides quick and precise measurements of JSW. In addition to improving reproducibility of semi-quantitative scoring or manual measurements, automated assessment has also sparked additional characterizations of joint space, including minimum JSW, mean JSW, joint space area, and location-specific JSW [29]. Several studies have shown minimum JSW to be most reproducible and most sensitive to OA-related changes [30, 31].
Currently, the Kellgren-Lawrence (KL) grading scheme is the most-widely used and accepted standard for diagnosis of radiographic OA [1, 32]. A KL grade of 0 indicates no radiographic features of OA are present while a KL grade of 1 is defined as doubtful JSN and possible osteophytic lipping [1]. Radiographic OA receives a KL grade of 2, denoting the presence of definite osteophytes and possible JSN on anteroposterior weight-bearing radiograph [1] (Figure 1). Further disease progression is graded as KL 3, characterized by multiple osteophytes, definite JSN, sclerosis, possible bony deformity and KL grade 4, which is defined by large osteophytes, marked JSN, severe sclerosis and definitely bony deformity [1]. The KL grading scheme has been criticized for characterizing the progression of OA as a linear process and combining osteophyte and JSN measurements [29]. More recently, the Osteoarthritis Research Society International atlas has developed OA classification scores that evaluate tibiofemoral JSN and osteophytes separately in each compartment [2, 33].
While radiography is useful for evaluation of JSW, a 2005 study by Amin et al. revealed that a significant number of symptomatic patients show cartilage loss on MRI even when JSN or disease progression is not visualized using radiography [34]. In this study, radiographic progression was 91% specific but only 23% sensitive for cartilage loss [34]. Consequently, MRI is regarded as an important modality for bone imaging because it can provide contrast that improves the assessment of subchondral bone integrity and lesions.
MRI
Changes in subchondral bone composition are important to note in the progression of OA and well-visualized using MRI. In particular, bone marrow edema-like lesions (BMLs), subchondral cyst-like lesions, and subchondral bone attrition are notable features indicating disease progression.
BMLs are degenerative lesions consisting of edema, bone marrow necrosis, fibrosis, and trabecular abnormalities [35, 36]. They are often detected in conjunction with neighboring cartilage damage [37, 38] and several recent studies have demonstrated a correlation between BMLs and progressive cartilage damage [39–41] (Figure 2). They are best visualized on MRI using PD-weighted, intermediate-weighted, T2-weighted, or short tau inversion recovery and appear as hypointense regions on T1-weight SE images [36, 42–44].
Figure 2.

Bone marrow edema and bone marrow lesions depicted on the medial femur on a T2-weighted fat suppressed MRI(A) and medial tibial plateau on an intermediate-weighted fat suppressed MRI (B).
The exact origin of subchondral cyst-like lesions remains to be elucidated, but it is currently thought that they result either from synovial fluid intrusion as a consequence of elevated intra-articular pressure [45, 46] or from traumatic bone necrosis following impact of articular surfaces [47, 48]. Recent studies have shown that subchondral cyst-like lesions appear in regions without full-thickness cartilage defects approximately 50% of the time [49] and are strongly associated with BMLs in the same subregion [49, 50]; together these findings support the bony contusion theory. Subchondral cyst-like lesions appear as areas of well-defined fluid-like signal intensity on non-enhanced imaging sequences.
Subchondral bone attrition is frequently observed in patients with advanced OA but has also been viewed in patients with mild OA who do not exhibit JSN on standard radiographs [51]. It may be caused by altered mechanical loading resulting in subchondral remodeling and is associated with concomitant BMLs [52]. On MRI, subchondral bone attrition appears as depression or flattening of the subchondral surface. Changes in subchondral bone are seen on MRI long before changes are seen on radiographs.
Articular Cartilage
Multiple imaging modalities are used to study articular cartilage, as its degeneration is often regarded as the structural hallmark of OA progression. Conventional radiography provides an indirect measure of articular cartilage through evaluation of JSW but is unable to detect early chondral damage. Arthrography combined with either x-ray or computed tomography (CT) is used to assess cartilage surface contour [53], but does not provide soft tissue information. Many recent studies including the Osteoarthritis Initiative (OAI) utilize MRI for cartilage examination, as it provides exquisite contrast and enables both morphologic and physiologic imaging techniques. Major techniques in morphological imaging of cartilage include spin-echo (SE) and gradient-recalled echo (GRE) sequences, fast SE, and 3D SE and GRE. Physiological imaging techniques such as T2 mapping, delayed gadolinium enhanced MR imaging of cartilage (dGEMRIC), T1rho mapping, sodium MRI, and diffusion-weighted imaging (DWI) provide insight into the molecular composition of cartilage.
MRI- Morphology
Morphological assessment of cartilage provides information about tissue size and structural integrity. Many techniques enable imaging of fissuring and focal or diffuse cartilage loss.
Three-dimension spoiled gradient recalled echo imaging with fat suppression (3D-SPGR) is the current standard for morphological imaging of cartilage [54, 55]. In 3D-SPGR, contrast similar to T1-weighted sequences is obtained by spoiling the transverse steady state with semi-random RF phase alterations. SPGR acquires nearly isotropic voxels, producing excellent resolution images with high cartilage signal and low signal from adjacent joint fluid. Instead of using T1-weighted contrast, driven equilibrium Fourier transform (DEFT) imaging generates contrast by exploiting the T2/T1 ratio of tissues. DEFT returns magnetization to the z-axis with a 90-degree pulse that results in enhanced signal in tissues with long T1 relaxation times. In cartilage imaging, DEFT heightens synovial fluid signal and preserves cartilage signal, resulting in bright synovial fluid at a short TR, high cartilage SNR, and improved imaging of full cartilage thickness [56]. Similarly, three dimensional dual-echo steady-state (DESS) imaging results in high signal intensity in both cartilage and synovial fluid, which enables morphological assessment of cartilage. 3D-DESS acquires two or more gradient echoes, separates each pair of echoes with a refocusing pulse, and combines image data to obtain higher T2* weighting. 3D-DESS has been validated for clinical use [57, 58] and affords advantages such as high SNR, high cartilage-to-fluid contrast, near-isotropic sections, and reduced scan time when compared to 3D-SPGR (Figure 3). This is the sequence of choice for the Osteoarthritis Initiative [59].
Figure 3.

Diffusion-weighted imaging in patellar cartilage in vivo using a DESS technique. Figure 3A uses low diffusion-weighting. Figure 3B uses high diffusion-weighting. Both imaging techniques afford high resolution, high signal-to-noise ratios, and the ability to calculate apparent diffusion coefficients. Cartilage (solid arrow) and joint fluid (dashed arrow) are well seen on both images. Images courtesy of Ernesto Staroswiecki.
Another group of methods hallmarked by excellent synovial fluid-cartilage contrast is steady-state free precession (SSFP) MRI techniques. Balanced steady-state free precession (bSSFP) is otherwise known as true fast imaging with steady-state precession (true FISP), fast imaging employing steady-state acquisition (FIESTA), and balanced fast field echo imaging. In all of these techniques, fluid is depicted with increased signal, while cartilage signal intensity is preserved, resulting in excellent contrast and diagnostic utility. Several derivatives of SSFP exist. Fluctuating equilibrium MR (FEMR) is particularly useful for morphological assessment of cartilage of the knee [60]. FEMR generates contrast based on the ratio of T1/T2 in tissues. In the case of the knee, FEMR produces bright synovial fluid signal while maintaining high signal in cartilage and high SNR. Another SSFP derivative, Vastly undersampled Isotropic Projection (VIPR) imaging, combines bSSFP imaging with 3D radial k-space acquisition using isotropic spatial resolution and T2/T1 weighted contrast [61]. The advantages of VIPR are substantial; banding artifacts are reduced, high SNR is obtained, high contrast between tissues is achieved, and short acquisition times are possible [61]. Finally, 3D-FSE techniques obtain isotropic images with PD or T2-weighted contrast. 3D FSE (Cube by GE Healthcare, VISTA by Philips, and SPACE by Siemens) utilizes a restore pulse and variable-flip-angle RF pulses applied along an echo train to produce a pseudo steady state. 3D-FSE has been shown to demonstrate improved SNR and better SNR efficiency [62–64].
MRI- Physiology
More recently, MR technology has evolved to provide quantitative information about the physiological content of articular cartilage. These developments have been useful in identifying early damage and breakdown. In OA, proteoglycan and collagen content are reduced [65]. This disrupts the collagen network and results in increased water content and matrix degradation. Newer methods of MRI exploit these macromolecule changes to provide a quantitative understanding of the breakdown process.
In cartilage, changes in transverse relaxation times (T2) are dependent upon the quantity of water and the integrity of the proteoglycan-collagen matrix. By measuring the spatial distribution of T2 relaxation times throughout articular cartilage, areas of increased or decreased water content (which generally correlate with cartilage damage) can be identified. Generally, a multi-echo spin-echo is used to shorten scan time and signal levels are fitted to one or more decaying exponentials, depending upon whether more than one T2 distribution is anticipated in the tissue [66]. T2 mapping software is currently commercially available, allowing for simple implementation on most imaging systems (Figure 4).
Figure 4.

T2 mapping of articular cartilage in the medial femur of a patient with osteoarthritis at two time points. Mapping software allows visualization of the spatial distribution; notice the increased T2 relaxation times in Figure 4B. The T2 relaxation time is overlaid on the images using a color map, with the scale in milliseconds.
T1rho mapping is sensitive to the macromolecule content of tissue and therefore very effective in visualizing early changes in OA [67, 68]. In T1rho, magnetization is tipped into the transverse plane and “spin-locked” by a constant RF field. When proteoglycan depletion occurs in the earliest phases of OA, the physio-chemical interactions in the macromolecule environment are disrupted and T1rho allows measurement of the interaction between motion-restricted water molecules and their extracellular environment [69]. Elevated T1rho relaxation times have been measured in osteoarthritic knee cartilage when compared with normal cartilage [70–72] (Figure 5).
Figure 5.

T1rho mapping is a physiologic MRI method that has been shown to be sensitive to proteoglycan (PG) changes in articular cartilage. In osteoarthritis, decreases in PG content correspond with increases in T1rho relaxation times. This figure illustrates T1ρ maps of (A) healthy control knee and (B) lateral side of ACL-injured knee at one year follow-up. Early degeneration of articular cartilage is seen by the increased relaxation time in B. Images courtesy of Li X et al. Radiology 2011;258:505–514.
Sodium MRI exploits the concept of negative fixed charged density within the extracellular matrix of cartilage. In healthy cartilage, high concentrations of positively charged 23Na are associated with the negatively charged glycosaminoglycan (GAG) side chains, which contain a plethora of negatively charged carboxyl and sulfate groups. When proteoglycan depletion occurs in cartilage damage, GAGs are damaged and sodium signals decline [73–75]. As such, 23Na imaging represents a potentially useful means of differentiating early stage degenerated cartilage and normal tissue [73] (Figure 6).
Figure 6.

Sodium maps of articular cartilage in a healthy volunteer (A) and a patient with OA (B) overlaid onto proton images. The increased sodium signal in figure 5A correlates with higher glycosaminoglycan (GAG) concentration. As cartilage degenerates and GAG concentration decreases, sodium signal declines (5B).
Delayed Gadolinium-Enhanced MRI (dGEMRIC), like sodium imaging, also relies on the principle of fixed charge density. Ions in the extracellular fluid are distributed in relation to the concentration of negatively charged GAGs, which is a reflection of the quantity of proteoglycan content in cartilage. The negatively charged Gd(DTPA)2- molecules accumulate in high concentration in areas lacking in GAG and in low concentrations in GAG-rich regions. Subsequent imaging using 3D SPGR pulse sequences with variable flip angles [76], bSSFP, or T1 generates a GAG distribution. This T1 measurement is referred to as the dGEMRIC index; regions with low T1 signal correspond to a low dGEMRIC index, which indicates high Gd(DTPA)2- penetration and greater GAG depletion (Figure 7).
Figure 7.

Images of the medial and lateral mensici pre-surgery (A) and at two follow-up time points (B,C). The use of delayed gadolinium enhanced MRI of cartilage (dGEMRIC) imaging permits quantitative assessment of cartilage integrity which appears to improve following surgical intervention. Images courtesy of Deborah Burstein, PhD.
Finally, diffusion weighted imaging (DWI) and diffusion tensor imaging (DTI) exploit the orientation of water molecules to offer unique insight into articular cartilage structure and organization. In DWI, multiple diffusion-sensitizing gradients are applied. Diffusion weighting, expressed as the b-value, depends on the amplitude and timing of these gradients. In response to these gradients, water accrues a random amount of phase and does not refocus, resulting in signal loss in tissues where diffusion occurs [77]. In healthy cartilage, the apparent diffusion coefficient (ADC) is low and diffusion times are long because intact cartilage components restrict the motion of water. When the matrix is disrupted, however, water molecules move more freely, increasing the ADC of cartilage [78]. Following acquisition, an ADC map is generated. DTI is a more advanced form of DWI, capable of obtaining directionality and magnitude measurements of water diffusion. In DTI, diffusion anisotropy effects are obtained, characterized, and employed to provide information about tissue microstructure; this has been particularly useful in determining articular cartilage degeneration [79].
OCT
While conventional MRI is extremely useful in identifying full or partial-thickness changes of articular cartilage in OA, it does not reliably differentiate between healthy cartilage and diseased cartilage with an intact surface [80]. Arthroscopic evaluation is the current clinical standard for evaluating chondrosis, or pre-OA chondral lesions that do not involve bone and are not visible on radiographs [12], but this method of assessment is subjective. Optical coherence tomography (OCT) can provide quantitative information about the disease state of articular cartilage [12]. OCT is incorporated into arthroscopes and generates cross-sectional images of articular cartilage at resolutions comparable to low-power histology [9–11] (Figure 8). OCT is sensitive to collagen structural changes resulting from acute trauma and degeneration [9, 13, 14] and OA-associated changes in cartilage birefringence [13]. In 2010, Chu et al. demonstrated that OCT evaluation of cartilage correlated with both arthroscopy and T2 MRI measurements, making OCT a powerful potential tool for diagnosis of early chondral changes [12]. However, as with any modality, OCT has limitations, including the invasive procedure required to directly access the articular surface and the heavy dependence on operator-use and image postprocessing.
Figure 8.
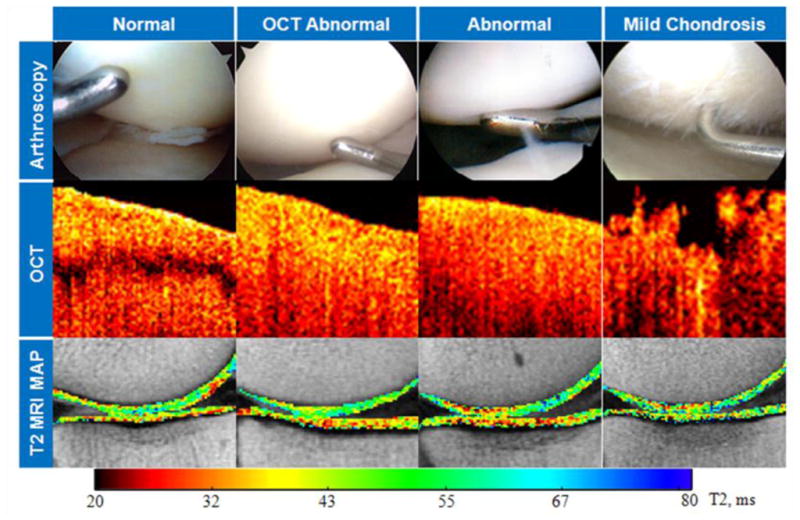
Correlation of arthroscopic images (top row), optical coherence tomography (middle row), and T2 mapping (bottom row). Images courtesy of Constance R. Chu, MD.
Menisci
Injury to the menisci is often viewed as a predisposing factor for OA. These fibrocartilaginous structures are positioned between the femur and tibia in the medial and lateral joint compartments and provide shock absorption and load transmission in both active and static loading [81–83]. Partial or total meniscectomies increase the strain on articular cartilage in the absence of meniscal shock absorbers, which causes dynamic deformation in knee joint areas. Loss of meniscus has been identified as a contributor to OA [84, 85].
Despite low signal from the menisci, MRI is the best imaging modality. The sagittal plane is most frequently used to evaluate meniscal pathology but recent studies have shown that imaging in the coronal [86, 87] or axial planes [88, 89] may improve diagnosis of specific tear types. A variety of sequences can be used for diagnostic imaging, but it is important to keep echo times (TE) short in order to reduce scan time, improve signal-to-noise ratio (SNR), acquire more slices per scan, and decrease susceptibility and artifact [90]. Commonly used sequences include PD-weighted SE or FSE with or without fat saturation, T1-weighting, and gradient echoes (GRE) [90]. The ideal sequence for diagnostic imaging of the menisci should have a short TE and optimize SNR; PD-weighted imaging achieves these aims [91]. The sensitivity and specifity PD-weighted sequences is 88% to 90% and 87% to 90%, respectively [92–94]; when FSE is added to PD sequences, the sensitivity and specificity drop to 82% to 96% and 84% to 94%, respectively [93, 95–97]. Addition of fat saturation to PD sequences is increasingly more common [90, 96]; In 2005, Blackmon et al. reported 93% sensitivity and 97% specificity for diagnosing meniscal tears using a fat-saturated conventional SE PD–weighted sequence [98].
Recent advancements in MRI of the meniscus have improved structural visualization. Higher field strengths (1.5 and 3.0T) improve SNR while maintaining comparable sensitivity and specificity [99–101]. Parallel imaging methods use multiple channels to extend the imaging field of view without increasing scan time by exploiting the spatially-varying sensitivity profiles of the phased array coil elements. These techniques have been shown to reduce scan time by nearly 50% [102] while retaining diagnostic sensitivity, specificity, and accuracy [103]. The use of ultrashort TE (uTE) imaging has also aided imaging of the menisci. uTE imaging sequences use TEs that are 20–50 times shorter than conventional T2 sequences [104–106]. The advantages here are two-fold: 1) high signal is acquired from tissues that typically produce little to no signal and 2) increased signal sensitivity allows detection of changes that indicate layers or defects of articular cartilage and identification of meniscal zones (Figure 9).
Figure 9.

Imaging of the meniscus using ultra-short echo time (uTE) MRI. Cartilaginous and fibrous components, particularly at the tissue periphery, are unmasked with the use of uTE. Images courtesy of Christine Chung, MD.
Ligaments
Damage to ligaments such as the anterior cruciate ligament (ACL) can often predispose to early OA [107, 108]. While not the most commonly implicated structures, disease-related degeneration and damage to the ligaments of the knee probably still occur in OA initiation and progression. These abnormalities have been documented in OA and detected with the use of ultrasound [109] and MRI. Imaging of the medial collateral ligament (MCL) and lateral collateral ligament (LCL) is often complicated by concomitant pathologies and can be limited by the complex anatomy of the posterolateral corner and posteromedial corner. The anterior cruciate ligament (ACL) and posterior cruciate ligament (PCL) are well-visualized in sagittal, coronal, and axial planes but may also be obscured by intra-articular pathologies. Despite these limitations, MRI is still the modality of choice given its exquisite soft tissue contrast.
Synovium
Synovitis, defined as inflammation of the synovial membrane, is increasingly regarded as a key player in the OA disease process [110, 111]. Among other roles, the synovium phagocytoses degraded cartilage and bone [112], and though the precise inflammatory mechanism of synovitis remains to be elucidated [111, 113], it appears that synovitis may be a secondary phenomenon in OA. Available evidence-based literature reveals inconsistencies. A 2008 arthroscopic study by Rollin et al. found that proliferative and inflammatory changes occurred in the synovium of up to 50% of OA patients [114] but there is debate as to whether synovitis is well-correlated with pain in OA [115, 116]. Other studies have demonstrated that synovitis in OA is likely to be associated with pain [116, 117], disease progression [118] and severity [113, 119].
Although radiography is used for OA diagnosis, it is not suitable for visualization of the synovium [120]. There is also limited applicability for computed tomography (CT) and nuclear medicine; ultrasound (US) and MRI are the primary modalities currently used for synovium assessment [121].
US
The Outcome Measures in Rheumatoid Arthritis Clinical Trials Ultrasonography Taskforce defines US-detected synovial hypertrophy as “abnormal hypoechoic (relative to subdermal fat, but sometimes isoechoic or hyperechoic) intra-articular tissue that is nondisplaceable and poorly compressible and which may exhibit Doppler” [122]. Though this definition explicitly refers to rheumatoid arthritis synovial pathology, it has been suggested that it may also be applied to OA because the difference in synovial inflammation between the two diseases is largely quantitative [123, 124]. In the knee, the most commonly imaged sites of synovial hypertrophy are the suprapatellar pouch and the medial and lateral recesses [125]. Current US technology acquires images with wide fields of view using high resolution probes operating at frequencies of up to 20 MHz [124]. This has allowed the detection of synovial pathologies including hypertrophy, vascularity, and presence of synovial fluid [18, 124] and the detection of synovitis in joints that appear otherwise clinically quiescent [124] (Figure 10). Doppler techniques allow an indirect evaluation of inflammatory activity via the assessment of vascularity [126, 127]. US-detected knee synovitis has been correlated with advanced radiographic OA [128] and markers of joint tissue metabolism [129]. Recently, CE-US has been proposed as a novel technique aimed at quantifying synovial vascularization [125]. CE-US showed higher sensitivity (95%) in imaging synovitis than CE-MRI (82%), power Doppler US (64%) or grayscale US (58%) [125].
Figure 10.

A) Sagittal grayscale ultrasound image of the suprapatellar pouch of an osteoarthritic knee joint demonstrates synovial fluid (sf), patella (p), distal femur (df), quadriceps tendon (qt), and synovial villi (v). (Image courtesy of Dr. Helen Keen, The University of Western Australia, Australia.) B) Power Doppler ultrasound image of the lateral recess of an osteoarthritic knee joint demonstrates synovial fluid (sf), distal femur (df), and the vascularity within the region of synovial hypertrophy (s) as demonstrated by the flash of color. (Image courtesy of Dr. Helen Keen, The University of Western Australia, Australia.)
MRI
MRI is also used for assessment of the synovium. Unlike US, MRI is able to visualize synovium located deep within joints such as the hip or the shoulder without being obscured by bony structures. The two primary methods for MR detection of synovitis in OA are the use of non-CE MRI and gadolinium (Gd)- based CE-MRI. Synovitis was first correlated with hypointense signal alterations in Hoffa’s fat pad on sagittal, non-CE T1 weighted SE images [130]. Since then, hyperintense signal changes in Hoffa’s fat pad on fat-suppressed PD or T2-weighted SE sequences have been suggested as surrogate markers for joint-wide synovitis [131, 132] (Figure 11). Non-CE MRI has been a common and effective tool for imaging of synovitis, but CE-MRI generally improves tissue visualization. Though the administration of intravenous gadolinium is suboptimal, CE-MRI more clearly differentiates inflamed synovium from joint effusion. In CE-MRI, synovium with inflammatory activity is enhanced while effusion remains hypointense; on nonCE MRI, both synovium and effusion are often depicted as signal hyperintensity. Recent studies have shown that signal changes in Hoffa’s fat pad on non-CE MRI were less specific for peripatellar synovitis than CE sequences [133] and that microscopic synovitis is not correlated with non-CE MRI [134]. Additional investigations have shown that CE-MRI detected synovitis correlates with histology [113, 134] and is more sensitive [125] and specific [133] than non-CE MRI. These studies further the belief that Gd-based CE-MRI improves imaging of the synovium. However, obvious drawbacks to intravenous gadolinium administration exist, including prolonged scan time, increased cost, possible allergic reactions, and a risk of nephrogenic systemic fibrosis. Finding a way to image synovial tissue with non-CE MRI while maintaining sensitivity and specificity may represent an area of interest for future research.
Figure 11.

Magnetic resonance imaging of synovitis in the medial (A) and lateral (B) compartments. In both images, synovial pathology is hallmarked by the enhanced signal surrounding Hoffa’s fat pad (arrows).
Conclusion
Because OA is a complex disease of the whole joint, it is important to assess all intraarticular structures to further understand disease pathogenesis and progression. Ideally, one imaging modality would enable sensitive and specific depiction of all components of the joint without utilizing intravenous contrast or ionizing radiation and with little dependence on machine operator. Currently, non-CE MRI permits visualization of multiple joint structures. However, in some tissues, additional supplemental imaging modalities may be necessary to enhance depiction, especially in the synovium and in the absence of full thickness articular cartilage defects. Currently, a combination of imaging techniques provides the most comprehensive assessment of the OA joint.
Footnotes
Conflicts of Interest: Dr. Gold receives research support from GE Healthcare. He also serves as a consultant for Zimmer, Arthrocare, and Isto Inc.
Publisher's Disclaimer: This is a PDF file of an unedited manuscript that has been accepted for publication. As a service to our customers we are providing this early version of the manuscript. The manuscript will undergo copyediting, typesetting, and review of the resulting proof before it is published in its final citable form. Please note that during the production process errors may be discovered which could affect the content, and all legal disclaimers that apply to the journal pertain.
References
- 1.Kellgren JH, Lawrence JS. Radiological assessment of osteo-arthrosis. Ann Rheum Dis. 1957;16:494–502. doi: 10.1136/ard.16.4.494. [DOI] [PMC free article] [PubMed] [Google Scholar]
- 2.Altman RD, Gold GE. Atlas of individual radiographic features in osteoarthritis, revised. Osteoarthritis Cartilage. 2007;15 (Suppl A):A1–56. doi: 10.1016/j.joca.2006.11.009. [DOI] [PubMed] [Google Scholar]
- 3.Gold GE, Mosher TJ. Arthritis in Color: Advanced Imaging of Osteoarthritis. Philadelphia: Elsevier Saunders; 2009. pp. 153–192. [Google Scholar]
- 4.Felson DT, Niu J, Guermazi A, Roemer F, Aliabadi P, Clancy M, Torner J, Lewis CE, Nevitt MC. Correlation of the development of knee pain with enlarging bone marrow lesions on magnetic resonance imaging. Arthritis Rheum. 2007;56:2986–92. doi: 10.1002/art.22851. [DOI] [PubMed] [Google Scholar]
- 5.Hunter DJ, Lo GH, Gale D, Grainger AJ, Guermazi A, Conaghan PG. The reliability of a new scoring system for knee osteoarthritis MRI and the validity of bone marrow lesion assessment: BLOKS (Boston Leeds Osteoarthritis Knee Score) Ann Rheum Dis. 2008;67:206–11. doi: 10.1136/ard.2006.066183. [DOI] [PubMed] [Google Scholar]
- 6.Kornaat PR, Ceulemans RY, Kroon HM, Riyazi N, Kloppenburg M, Carter WO, Woodworth TG, Bloem JL. MRI assessment of knee osteoarthritis: Knee Osteoarthritis Scoring System (KOSS)--inter-observer and intra-observer reproducibility of a compartment-based scoring system. Skeletal Radiol. 2005;34:95–102. doi: 10.1007/s00256-004-0828-0. [DOI] [PubMed] [Google Scholar]
- 7.Peterfy CG, Guermazi A, Zaim S, Tirman PF, Miaux Y, White D, Kothari M, Lu Y, Fye K, Zhao S, Genant HK. Whole-Organ Magnetic Resonance Imaging Score (WORMS) of the knee in osteoarthritis. Osteoarthritis Cartilage. 2004;12:177–90. doi: 10.1016/j.joca.2003.11.003. [DOI] [PubMed] [Google Scholar]
- 8.Huang D, Swanson EA, Lin CP, Schuman JS, Stinson WG, Chang W, Hee MR, Flotte T, Gregory K, Puliafito CA, et al. Optical coherence tomography. Science. 1991;254:1178–81. doi: 10.1126/science.1957169. [DOI] [PMC free article] [PubMed] [Google Scholar]
- 9.Chu CR, Lin D, Geisler JL, Chu CT, Fu FH, Pan Y. Arthroscopic microscopy of articular cartilage using optical coherence tomography. Am J Sports Med. 2004;32:699–709. doi: 10.1177/0363546503261736. [DOI] [PubMed] [Google Scholar]
- 10.Han CW, Chu CR, Adachi N, Usas A, Fu FH, Huard J, Pan Y. Analysis of rabbit articular cartilage repair after chondrocyte implantation using optical coherence tomography. Osteoarthritis Cartilage. 2003;11:111–21. doi: 10.1053/joca.2002.0862. [DOI] [PubMed] [Google Scholar]
- 11.Herrmann JM, Pitris C, Bouma BE, Boppart SA, Jesser CA, Stamper DL, Fujimoto JG, Brezinski ME. High resolution imaging of normal and osteoarthritic cartilage with optical coherence tomography. J Rheumatol. 1999;26:627–35. [PubMed] [Google Scholar]
- 12.Chu CR, Williams A, Tolliver D, Kwoh CK, Bruno S, 3rd, Irrgang JJ. Clinical optical coherence tomography of early articular cartilage degeneration in patients with degenerative meniscal tears. Arthritis Rheum. 62:1412–20. doi: 10.1002/art.27378. [DOI] [PMC free article] [PubMed] [Google Scholar]
- 13.Chu CR, Izzo NJ, Irrgang JJ, Ferretti M, Studer RK. Clinical diagnosis of potentially treatable early articular cartilage degeneration using optical coherence tomography. J Biomed Opt. 2007;12:051703. doi: 10.1117/1.2789674. [DOI] [PubMed] [Google Scholar]
- 14.Pan Y, Li Z, Xie T, Chu CR. Hand-held arthroscopic optical coherence tomography for in vivo high-resolution imaging of articular cartilage. J Biomed Opt. 2003;8:648–54. doi: 10.1117/1.1609201. [DOI] [PubMed] [Google Scholar]
- 15.Wakefield RJ, Gibbon WW, Emery P. The current status of ultrasonography in rheumatology. Rheumatology (Oxford) 1999;38:195–8. doi: 10.1093/rheumatology/38.3.195. [DOI] [PubMed] [Google Scholar]
- 16.Micu MC, Bogdan GD, Fodor D. Steroid injection for hip osteoarthritis: efficacy under ultrasound guidance. Rheumatology (Oxford) 49:1490–4. doi: 10.1093/rheumatology/keq030. [DOI] [PubMed] [Google Scholar]
- 17.Qvistgaard E, Kristoffersen H, Terslev L, Danneskiold-Samsoe B, Torp-Pedersen S, Bliddal H. Guidance by ultrasound of intra-articular injections in the knee and hip joints. Osteoarthritis Cartilage. 2001;9:512–7. doi: 10.1053/joca.2001.0433. [DOI] [PubMed] [Google Scholar]
- 18.Guermazi A, Eckstein F, Hellio Le, Graverand-Gastineau MP, Conaghan PG, Burstein D, Keen H, Roemer FW. Osteoarthritis: current role of imaging. Med Clin North Am. 2009;93:101–26. xi. doi: 10.1016/j.mcna.2008.08.003. [DOI] [PubMed] [Google Scholar]
- 19.Altman R, Asch E, Bloch D, Bole G, Borenstein D, Brandt K, Christy W, Cooke TD, Greenwald R, Hochberg M, et al. Development of criteria for the classification and reporting of osteoarthritis. Classification of osteoarthritis of the knee. Diagnostic and Therapeutic Criteria Committee of the American Rheumatism Association. Arthritis Rheum. 1986;29:1039–49. doi: 10.1002/art.1780290816. [DOI] [PubMed] [Google Scholar]
- 20.Spector TD, Hart DJ, Byrne J, Harris PA, Dacre JE, Doyle DV. Definition of osteoarthritis of the knee for epidemiological studies. Ann Rheum Dis. 1993;52:790–4. doi: 10.1136/ard.52.11.790. [DOI] [PMC free article] [PubMed] [Google Scholar]
- 21.Leach RE, Gregg T, Siber FJ. Weight-bearing radiography in osteoarthritis of the knee. Radiology. 1970;97:265–8. doi: 10.1148/97.2.265. [DOI] [PubMed] [Google Scholar]
- 22.Mazzuca SA, Brandt KD, Katz BP. Is conventional radiography suitable for evaluation of a disease-modifying drug in patients with knee osteoarthritis? Osteoarthritis Cartilage. 1997;5:217–26. doi: 10.1016/s1063-4584(97)80017-9. [DOI] [PubMed] [Google Scholar]
- 23.Buckland-Wright JC, Macfarlane DG, Williams SA, Ward RJ. Accuracy and precision of joint space width measurements in standard and macroradiographs of osteoarthritic knees. Ann Rheum Dis. 1995;54:872–80. doi: 10.1136/ard.54.11.872. [DOI] [PMC free article] [PubMed] [Google Scholar]
- 24.Buckland-Wright JC, Wolfe F, Ward RJ, Flowers N, Hayne C. Substantial superiority of semiflexed (MTP) views in knee osteoarthritis: a comparative radiographic study, without fluoroscopy, of standing extended, semiflexed (MTP), and schuss views. J Rheumatol. 1999;26:2664–74. [PubMed] [Google Scholar]
- 25.Mazzuca SA, Brandt KD, Buckland-Wright JC, Buckwalter KA, Katz BP, Lynch JA, Ward RJ, Emsley CL. Field test of the reproducibility of automated measurements of medial tibiofemoral joint space width derived from standardized knee radiographs. J Rheumatol. 1999;26:1359–65. [PubMed] [Google Scholar]
- 26.Peterfy C, Li J, Zaim S, Duryea J, Lynch J, Miaux Y, Yu W, Genant HK. Comparison of fixed-flexion positioning with fluoroscopic semi-flexed positioning for quantifying radiographic joint-space width in the knee: test-retest reproducibility. Skeletal Radiol. 2003;32:128–32. doi: 10.1007/s00256-002-0603-z. [DOI] [PubMed] [Google Scholar]
- 27.Lequesne M. Chondrometry. Quantitative evaluation of joint space width and rate of joint space loss in osteoarthritis of the hip. Rev Rhum Engl Ed. 1995;62:155–8. [PubMed] [Google Scholar]
- 28.Ravaud P, Chastang C, Auleley GR, Giraudeau B, Royant V, Amor B, Genant HK, Dougados M. Assessment of joint space width in patients with osteoarthritis of the knee: a comparison of 4 measuring instruments. J Rheumatol. 1996;23:1749–55. [PubMed] [Google Scholar]
- 29.Roemer FW, Crema MD, Trattnig S, Guermazi A. Advances in imaging of osteoarthritis and cartilage. Radiology. 260:332–54. doi: 10.1148/radiol.11101359. [DOI] [PubMed] [Google Scholar]
- 30.Conrozier T, Lequesne M, Favret H, Taccoen A, Mazieres B, Dougados M, Vignon M, Vignon E. Measurement of the radiological hip joint space width. An evaluation of various methods of measurement. Osteoarthritis Cartilage. 2001;9:281–6. doi: 10.1053/joca.2000.0386. [DOI] [PubMed] [Google Scholar]
- 31.Vignon E. Radiographic issues in imaging the progression of hip and knee osteoarthritis. J Rheumatol Suppl. 2004;70:36–44. [PubMed] [Google Scholar]
- 32.Bauer DC, Hunter DJ, Abramson SB, Attur M, Corr M, Felson D, Heinegard D, Jordan JM, Kepler TB, Lane NE, Saxne T, Tyree B, Kraus VB. Classification of osteoarthritis biomarkers: a proposed approach. Osteoarthritis Cartilage. 2006;14:723–7. doi: 10.1016/j.joca.2006.04.001. [DOI] [PubMed] [Google Scholar]
- 33.Altman RD, Hochberg M, Murphy WA, Jr, Wolfe F, Lequesne M. Atlas of individual radiographic features in osteoarthritis. Osteoarthritis Cartilage. 1995;3 (Suppl A):3–70. [PubMed] [Google Scholar]
- 34.Amin S, LaValley MP, Guermazi A, Grigoryan M, Hunter DJ, Clancy M, Niu J, Gale DR, Felson DT. The relationship between cartilage loss on magnetic resonance imaging and radiographic progression in men and women with knee osteoarthritis. Arthritis Rheum. 2005;52:3152–9. doi: 10.1002/art.21296. [DOI] [PubMed] [Google Scholar]
- 35.Taljanovic MS, Graham AR, Benjamin JB, Gmitro AF, Krupinski EA, Schwartz SA, Hunter TB, Resnick DL. Bone marrow edema pattern in advanced hip osteoarthritis: quantitative assessment with magnetic resonance imaging and correlation with clinical examination, radiographic findings, and histopathology. Skeletal Radiol. 2008;37:423–31. doi: 10.1007/s00256-008-0446-3. [DOI] [PubMed] [Google Scholar]
- 36.Zanetti M, Bruder E, Romero J, Hodler J. Bone marrow edema pattern in osteoarthritic knees: correlation between MR imaging and histologic findings. Radiology. 2000;215:835–40. doi: 10.1148/radiology.215.3.r00jn05835. [DOI] [PubMed] [Google Scholar]
- 37.Baranyay FJ, Wang Y, Wluka AE, English DR, Giles GG, Sullivan RO, Cicuttini FM. Association of bone marrow lesions with knee structures and risk factors for bone marrow lesions in the knees of clinically healthy, community-based adults. Semin Arthritis Rheum. 2007;37:112–8. doi: 10.1016/j.semarthrit.2007.01.008. [DOI] [PubMed] [Google Scholar]
- 38.Guymer E, Baranyay F, Wluka AE, Hanna F, Bell RJ, Davis SR, Wang Y, Cicuttini FM. A study of the prevalence and associations of subchondral bone marrow lesions in the knees of healthy, middle-aged women. Osteoarthritis Cartilage. 2007;15:1437–42. doi: 10.1016/j.joca.2007.04.010. [DOI] [PubMed] [Google Scholar]
- 39.Felson DT, McLaughlin S, Goggins J, LaValley MP, Gale ME, Totterman S, Li W, Hill C, Gale D. Bone marrow edema and its relation to progression of knee osteoarthritis. Ann Intern Med. 2003;139:330–6. doi: 10.7326/0003-4819-139-5_part_1-200309020-00008. [DOI] [PubMed] [Google Scholar]
- 40.Hunter DJ, Zhang Y, Niu J, Goggins J, Amin S, LaValley MP, Guermazi A, Genant H, Gale D, Felson DT. Increase in bone marrow lesions associated with cartilage loss: a longitudinal magnetic resonance imaging study of knee osteoarthritis. Arthritis Rheum. 2006;54:1529–35. doi: 10.1002/art.21789. [DOI] [PubMed] [Google Scholar]
- 41.Roemer FW, Guermazi A, Javaid MK, Lynch JA, Niu J, Zhang Y, Felson DT, Lewis CE, Torner J, Nevitt MC. Change in MRI-detected subchondral bone marrow lesions is associated with cartilage loss: the MOST Study. A longitudinal multicentre study of knee osteoarthritis. Ann Rheum Dis. 2009;68:1461–5. doi: 10.1136/ard.2008.096834. [DOI] [PMC free article] [PubMed] [Google Scholar]
- 42.Bergman AG, Willen HK, Lindstrand AL, Pettersson HT. Osteoarthritis of the knee: correlation of subchondral MR signal abnormalities with histopathologic and radiographic features. Skeletal Radiol. 1994;23:445–8. doi: 10.1007/BF00204605. [DOI] [PubMed] [Google Scholar]
- 43.Roemer FW, Hunter DJ, Guermazi A. MRI-based semiquantitative assessment of subchondral bone marrow lesions in osteoarthritis research. Osteoarthritis Cartilage. 2009;17:414–5. doi: 10.1016/j.joca.2008.07.019. author reply 416–7. [DOI] [PubMed] [Google Scholar]
- 44.Yu JS, Cook PA. Magnetic resonance imaging (MRI) of the knee: a pattern approach for evaluating bone marrow edema. Crit Rev Diagn Imaging. 1996;37:261–303. [PubMed] [Google Scholar]
- 45.Freund E. The pathological significance of intra-articular pressure. Edinb Med J. 1940;47:192–203. [PMC free article] [PubMed] [Google Scholar]
- 46.Landells JW. The bone cysts of osteoarthritis. J Bone Joint Surg Br. 1953;35-B:643–9. doi: 10.1302/0301-620X.35B4.643. [DOI] [PubMed] [Google Scholar]
- 47.Resnick D, Niwayama G, Coutts RD. Subchondral cysts (geodes) in arthritic disorders: pathologic and radiographic appearance of the hip joint. AJR Am J Roentgenol. 1977;128:799–806. doi: 10.2214/ajr.128.5.799. [DOI] [PubMed] [Google Scholar]
- 48.Rhaney K, Lamb DW. The cysts of osteoarthritis of the hip; a radiological and pathological study. J Bone Joint Surg Br. 1955;37-B:663–75. doi: 10.1302/0301-620X.37B4.663. [DOI] [PubMed] [Google Scholar]
- 49.Crema MD, Roemer FW, Marra MD, et al. MRI-detected bone marrow edema-like lesions are strongly associated with subchondral cysts in patients with or at risk for knee osteoarthritis: the MOST study. Osteoarthritis Cartilage. 2008;14:1033–40. [Google Scholar]
- 50.Carrino JA, Blum J, Parellada JA, Schweitzer ME, Morrison WB. MRI of bone marrow edema-like signal in the pathogenesis of subchondral cysts. Osteoarthritis Cartilage. 2006;14:1081–5. doi: 10.1016/j.joca.2006.05.011. [DOI] [PubMed] [Google Scholar]
- 51.Reichenbach S, Guermazi A, Niu J, Neogi T, Hunter DJ, Roemer FW, McLennan CE, Hernandez-Molina G, Felson DT. Prevalence of bone attrition on knee radiographs and MRI in a community-based cohort. Osteoarthritis Cartilage. 2008;16:1005–10. doi: 10.1016/j.joca.2008.02.001. [DOI] [PMC free article] [PubMed] [Google Scholar]
- 52.Roemer FW, Guermazi A, Neogi T, et al. Tibiofemoral bone marrow lesions and their association with prevalent and incident subchondral bone attrition: the MOST study. Osteoarthritis Cartilage. 2008;16:S160–1. [Google Scholar]
- 53.Coumas JM, Palmer WE. Knee arthrography. Evolution and current status. Radiol Clin North Am. 1998;36:703–28. doi: 10.1016/s0033-8389(05)70057-9. [DOI] [PubMed] [Google Scholar]
- 54.Cicuttini F, Forbes A, Asbeutah A, Morris K, Stuckey S. Comparison and reproducibility of fast and conventional spoiled gradient-echo magnetic resonance sequences in the determination of knee cartilage volume. J Orthop Res. 2000;18:580–4. doi: 10.1002/jor.1100180410. [DOI] [PubMed] [Google Scholar]
- 55.Eckstein F, Westhoff J, Sittek H, Maag KP, Haubner M, Faber S, Englmeier KH, Reiser M. In vivo reproducibility of three-dimensional cartilage volume and thickness measurements with MR imaging. AJR Am J Roentgenol. 1998;170:593–7. doi: 10.2214/ajr.170.3.9490936. [DOI] [PubMed] [Google Scholar]
- 56.Gold GE, Fuller SE, Hargreaves BA, Stevens KJ, Beaulieu CF. Driven equilibrium magnetic resonance imaging of articular cartilage: initial clinical experience. J Magn Reson Imaging. 2005;21:476–81. doi: 10.1002/jmri.20276. [DOI] [PubMed] [Google Scholar]
- 57.Duc SR, Pfirrmann CW, Schmid MR, Zanetti M, Koch PP, Kalberer F, Hodler J. Articular cartilage defects detected with 3D water-excitation true FISP: prospective comparison with sequences commonly used for knee imaging. Radiology. 2007;245:216–23. doi: 10.1148/radiol.2451060990. [DOI] [PubMed] [Google Scholar]
- 58.Eckstein F, Hudelmaier M, Wirth W, Kiefer B, Jackson R, Yu J, Eaton CB, Schneider E. Double echo steady state magnetic resonance imaging of knee articular cartilage at 3 Tesla: a pilot study for the Osteoarthritis Initiative. Ann Rheum Dis. 2006;65:433–41. doi: 10.1136/ard.2005.039370. [DOI] [PMC free article] [PubMed] [Google Scholar]
- 59.Peterfy CG, Schneider E, Nevitt M. The osteoarthritis initiative: report on the design rationale for the magnetic resonance imaging protocol for the knee. Osteoarthritis Cartilage. 2008;16:1433–41. doi: 10.1016/j.joca.2008.06.016. [DOI] [PMC free article] [PubMed] [Google Scholar]
- 60.Vasanawala SS, Pauly JM, Nishimura DG. Fluctuating equilibrium MRI. Magn Reson Med. 1999;42:876–83. doi: 10.1002/(sici)1522-2594(199911)42:5<876::aid-mrm6>3.0.co;2-z. [DOI] [PubMed] [Google Scholar]
- 61.Kijowski R, Blankenbaker DG, Klaers JL, Shinki K, De Smet AA, Block WF. Vastly undersampled isotropic projection steady-state free precession imaging of the knee: diagnostic performance compared with conventional MR. Radiology. 2009;251:185–94. doi: 10.1148/radiol.2511081133. [DOI] [PubMed] [Google Scholar]
- 62.Friedrich KM, Reiter G, Kaiser B, Mayerhofer M, Deimling M, Jellus V, Horger W, Trattnig S, Schweitzer M, Salomonowitz E. High-resolution cartilage imaging of the knee at 3T: basic evaluation of modern isotropic 3D MR-sequences. Eur J Radiol. 78:398–405. doi: 10.1016/j.ejrad.2010.01.008. [DOI] [PubMed] [Google Scholar]
- 63.Stevens KJ, Busse RF, Han E, Brau AC, Beatty PJ, Beaulieu CF, Gold GE. Ankle: isotropic MR imaging with 3D-FSE-cube--initial experience in healthy volunteers. Radiology. 2008;249:1026–33. doi: 10.1148/radiol.2493080227. [DOI] [PMC free article] [PubMed] [Google Scholar]
- 64.Stevens KJ, Wallace CG, Chen W, Rosenberg JK, Gold GE. Imaging of the wrist at 1.5 Tesla using isotropic three-dimensional fast spin echo cube. J Magn Reson Imaging. 33:908–15. doi: 10.1002/jmri.22494. [DOI] [PMC free article] [PubMed] [Google Scholar]
- 65.Dijkgraaf LC, de Bont LG, Boering G, Liem RS. The structure, biochemistry, and metabolism of osteoarthritic cartilage: a review of the literature. J Oral Maxillofac Surg. 1995;53:1182–92. doi: 10.1016/0278-2391(95)90632-0. [DOI] [PubMed] [Google Scholar]
- 66.Smith HE, Mosher TJ, Dardzinski BJ, Collins BG, Collins CM, Yang QX, Schmithorst VJ, Smith MB. Spatial variation in cartilage T2 of the knee. J Magn Reson Imaging. 2001;14:50–5. doi: 10.1002/jmri.1150. [DOI] [PubMed] [Google Scholar]
- 67.Mosher TJ, Zhang Z, Reddy R, Boudhar S, Milestone BN, Morrison WB, Kwoh CK, Eckstein F, Witschey WR, Borthakur A. Knee articular cartilage damage in osteoarthritis: analysis of MR image biomarker reproducibility in ACRIN-PA 4001 multicenter trial. Radiology. 258:832–42. doi: 10.1148/radiol.10101174. [DOI] [PMC free article] [PubMed] [Google Scholar]
- 68.Wheaton AJ, Casey FL, Gougoutas AJ, Dodge GR, Borthakur A, Lonner JH, Schumacher HR, Reddy R. Correlation of T1rho with fixed charge density in cartilage. J Magn Reson Imaging. 2004;20:519–25. doi: 10.1002/jmri.20148. [DOI] [PubMed] [Google Scholar]
- 69.Blumenkrantz G, Majumdar S. Quantitative magnetic resonance imaging of articular cartilage in osteoarthritis. Eur Cell Mater. 2007;13:76–86. doi: 10.22203/ecm.v013a08. [DOI] [PubMed] [Google Scholar]
- 70.Li XHE, Crane JC. Development of in vivo multi-slice spiral T1 rho mapping in cartilage at 3T and its application to osteoarthritis. Annual Meeting International Society of Magnetic Resonance in Medicine; Miami, FL. 2005. [Google Scholar]
- 71.Regatte RR, Akella SV, Wheaton AJ, Lech G, Borthakur A, Kneeland JB, Reddy R. 3D-T1rho-relaxation mapping of articular cartilage: in vivo assessment of early degenerative changes in symptomatic osteoarthritic subjects. Acad Radiol. 2004;11:741–9. doi: 10.1016/j.acra.2004.03.051. [DOI] [PubMed] [Google Scholar]
- 72.Stahl R, Luke A, Li X, Carballido-Gamio J, Ma CB, Majumdar S, Link TM. T1rho, T2 and focal knee cartilage abnormalities in physically active and sedentary healthy subjects versus early OA patients--a 3. 0-Tesla MRI study. Eur Radiol. 2009;19:132–43. doi: 10.1007/s00330-008-1107-6. [DOI] [PubMed] [Google Scholar]
- 73.Borthakur A, Shapiro EM, Beers J, Kudchodkar S, Kneeland JB, Reddy R. Sensitivity of MRI to proteoglycan depletion in cartilage: comparison of sodium and proton MRI. Osteoarthritis Cartilage. 2000;8:288–93. doi: 10.1053/joca.1999.0303. [DOI] [PubMed] [Google Scholar]
- 74.Wang L, Wu Y, Chang G, Oesingmann N, Schweitzer ME, Jerschow A, Regatte RR. Rapid isotropic 3D-sodium MRI of the knee joint in vivo at 7T. J Magn Reson Imaging. 2009;30:606–14. doi: 10.1002/jmri.21881. [DOI] [PMC free article] [PubMed] [Google Scholar]
- 75.Wheaton AJ, Borthakur A, Shapiro EM, Regatte RR, Akella SV, Kneeland JB, Reddy R. Proteoglycan loss in human knee cartilage: quantitation with sodium MR imaging--feasibility study. Radiology. 2004;231:900–5. doi: 10.1148/radiol.2313030521. [DOI] [PubMed] [Google Scholar]
- 76.McKenzie CA, Williams A, Prasad PV, Burstein D. Three-dimensional delayed gadolinium-enhanced MRI of cartilage (dGEMRIC) at 1.5T and 3.0T. J Magn Reson Imaging. 2006;24:928–33. doi: 10.1002/jmri.20689. [DOI] [PubMed] [Google Scholar]
- 77.Gold GE, Burstein D, Dardzinski B, Lang P, Boada F, Mosher T. MRI of articular cartilage in OA: novel pulse sequences and compositional/functional markers. Osteoarthritis Cartilage. 2006;14 (Suppl A):A76–86. doi: 10.1016/j.joca.2006.03.010. [DOI] [PubMed] [Google Scholar]
- 78.Burstein D, Gray ML, Hartman AL, Gipe R, Foy BD. Diffusion of small solutes in cartilage as measured by nuclear magnetic resonance (NMR) spectroscopy and imaging. J Orthop Res. 1993;11:465–78. doi: 10.1002/jor.1100110402. [DOI] [PubMed] [Google Scholar]
- 79.Filidoro L, Dietrich O, Weber J, Rauch E, Oerther T, Wick M, Reiser MF, Glaser C. High-resolution diffusion tensor imaging of human patellar cartilage: feasibility and preliminary findings. Magn Reson Med. 2005;53:993–8. doi: 10.1002/mrm.20469. [DOI] [PubMed] [Google Scholar]
- 80.Potter HG, Linklater JM, Allen AA, Hannafin JA, Haas SB. Magnetic resonance imaging of articular cartilage in the knee. An evaluation with use of fast-spin-echo imaging. J Bone Joint Surg Am. 1998;80:1276–84. doi: 10.2106/00004623-199809000-00005. [DOI] [PubMed] [Google Scholar]
- 81.Kurosawa H, Fukubayashi T, Nakajima H. Load-bearing mode of the knee joint: physical behavior of the knee joint with or without menisci. Clin Orthop Relat Res. 1980:283–90. [PubMed] [Google Scholar]
- 82.Seedhom BB, Hargreaves DJ. Transmission of the load in the knee joint with special reference to the role of the meniscus (part I + II) Eng Med. 1979;4:207–28. [Google Scholar]
- 83.Walker PS, Erkman MJ. The role of the menisci in force transmission across the knee. Clin Orthop Relat Res. 1975:184–92. doi: 10.1097/00003086-197506000-00027. [DOI] [PubMed] [Google Scholar]
- 84.Song Y, Greve JM, Carter DR, Giori NJ. Meniscectomy alters the dynamic deformational behavior and cumulative strain of tibial articular cartilage in knee joints subjected to cyclic loads. Osteoarthritis Cartilage. 2008;16:1545–54. doi: 10.1016/j.joca.2008.04.011. [DOI] [PubMed] [Google Scholar]
- 85.Song Y, Greve JM, Carter DR, Koo S, Giori NJ. Articular cartilage MR imaging and thickness mapping of a loaded knee joint before and after meniscectomy. Osteoarthritis Cartilage. 2006;14:728–37. doi: 10.1016/j.joca.2006.01.011. [DOI] [PubMed] [Google Scholar]
- 86.Magee T, Williams D. Detection of meniscal tears and marrow lesions using coronal MRI. AJR Am J Roentgenol. 2004;183:1469–73. doi: 10.2214/ajr.183.5.1831469. [DOI] [PubMed] [Google Scholar]
- 87.Magee TH, Hinson GW. MRI of meniscal bucket-handle tears. Skeletal Radiol. 1998;27:495–9. doi: 10.1007/s002560050426. [DOI] [PubMed] [Google Scholar]
- 88.Lee JH, Singh TT, Bolton G. Axial fat-saturated FSE imaging of knee: appearance of meniscal tears. Skeletal Radiol. 2002;31:384–95. doi: 10.1007/s00256-002-0507-y. [DOI] [PubMed] [Google Scholar]
- 89.Tarhan NC, Chung CB, Mohana-Borges AV, Hughes T, Resnick D. Meniscal tears: role of axial MRI alone and in combination with other imaging planes. AJR Am J Roentgenol. 2004;183:9–15. doi: 10.2214/ajr.183.1.1830009. [DOI] [PubMed] [Google Scholar]
- 90.Helms CA. The meniscus: recent advances in MR imaging of the knee. AJR Am J Roentgenol. 2002;179:1115–22. doi: 10.2214/ajr.179.5.1791115. [DOI] [PubMed] [Google Scholar]
- 91.Fox MG. MR imaging of the meniscus: review, current trends, and clinical implications. Radiol Clin North Am. 2007;45:1033–53. vii. doi: 10.1016/j.rcl.2007.08.009. [DOI] [PubMed] [Google Scholar]
- 92.Chang CY, Wu HT, Huang TF, Ma HL, Hung SC. Imaging evaluation of meniscal injury of the knee joint: a comparative MR imaging and arthroscopic study. Clin Imaging. 2004;28:372–6. doi: 10.1016/S0899-7071(03)00245-6. [DOI] [PubMed] [Google Scholar]
- 93.Escobedo EM, Hunter JC, Zink-Brody GC, Wilson AJ, Harrison SD, Fisher DJ. Usefulness of turbo spin-echo MR imaging in the evaluation of meniscal tears: comparison with a conventional spin-echo sequence. AJR Am J Roentgenol. 1996;167:1223–7. doi: 10.2214/ajr.167.5.8911185. [DOI] [PubMed] [Google Scholar]
- 94.Guckel C, Jundt G, Schnabel K, Gachter A. Spin-echo and 3D gradient-echo imaging of the knee joint: a clinical and histopathological comparison. Eur J Radiol. 1995;21:25–33. doi: 10.1016/0720-048x(95)00681-f. [DOI] [PubMed] [Google Scholar]
- 95.Cheung LP, Li KC, Hollett MD, Bergman AG, Herfkens RJ. Meniscal tears of the knee: accuracy of detection with fast spin-echo MR imaging and arthroscopic correlation in 293 patients. Radiology. 1997;203:508–12. doi: 10.1148/radiology.203.2.9114113. [DOI] [PubMed] [Google Scholar]
- 96.De Smet AA, Tuite MJ. Use of the “two-slice-touch” rule for the MRI diagnosis of meniscal tears. AJR Am J Roentgenol. 2006;187:911–4. doi: 10.2214/AJR.05.1354. [DOI] [PubMed] [Google Scholar]
- 97.Vande Berg BC, Malghem J, Poilvache P, Maldague B, Lecouvet FE. Meniscal tears with fragments displaced in notch and recesses of knee: MR imaging with arthroscopic comparison. Radiology. 2005;234:842–50. doi: 10.1148/radiol.2343031601. [DOI] [PubMed] [Google Scholar]
- 98.Blackmon GB, Major NM, Helms CA. Comparison of fast spin-echo versus conventional spin-echo MRI for evaluating meniscal tears. AJR Am J Roentgenol. 2005;184:1740–3. doi: 10.2214/ajr.184.6.01841740. [DOI] [PubMed] [Google Scholar]
- 99.Craig JG, Go L, Blechinger J, Hearshen D, Bouffard JA, Diamond M, van Holsbeeck MT. Three-tesla imaging of the knee: initial experience. Skeletal Radiol. 2005;34:453–61. doi: 10.1007/s00256-005-0919-6. [DOI] [PubMed] [Google Scholar]
- 100.Magee T, Williams D. 3. 0-T MRI of meniscal tears AJR. Am J Roentgenol. 2006;187:371–5. doi: 10.2214/AJR.05.0487. [DOI] [PubMed] [Google Scholar]
- 101.Ramnath RR, Magee T, Wasudev N, Murrah R. Accuracy of 3-T MRI using fast spin-echo technique to detect meniscal tears of the knee. AJR Am J Roentgenol. 2006;187:221–5. doi: 10.2214/AJR.05.0419. [DOI] [PubMed] [Google Scholar]
- 102.Kreitner KF, Romaneehsen B, Krummenauer F, Oberholzer K, Muller LP, Duber C. Fast magnetic resonance imaging of the knee using a parallel acquisition technique (mSENSE): a prospective performance evaluation. Eur Radiol. 2006;16:1659–66. doi: 10.1007/s00330-006-0288-0. [DOI] [PubMed] [Google Scholar]
- 103.Niitsu M, Ikeda K. Routine MR examination of the knee using parallel imaging. Clin Radiol. 2003;58:801–7. doi: 10.1016/s0009-9260(03)00260-5. [DOI] [PubMed] [Google Scholar]
- 104.Gatehouse PD, He T, Puri BK, Thomas RD, Resnick D, Bydder GM. Contrast-enhanced MRI of the menisci of the knee using ultrashort echo time (UTE) pulse sequences: imaging of the red and white zones. Br J Radiol. 2004;77:641–7. doi: 10.1259/bjr/31774546. [DOI] [PubMed] [Google Scholar]
- 105.Gold GE, Bergman AG, Pauly JM, Lang P, Butts RK, Beaulieu CF, Hargreaves B, Frank L, Boutin RD, Macovski A, Resnick D. Magnetic resonance imaging of knee cartilage repair. Top Magn Reson Imaging. 1998;9:377–92. [PubMed] [Google Scholar]
- 106.Robson MD, Gatehouse PD, Bydder M, Bydder GM. Magnetic resonance: an introduction to ultrashort TE (UTE) imaging. J Comput Assist Tomogr. 2003;27:825–46. doi: 10.1097/00004728-200311000-00001. [DOI] [PubMed] [Google Scholar]
- 107.Lohmander LS, Englund PM, Dahl LL, Roos EM. The long-term consequence of anterior cruciate ligament and meniscus injuries: osteoarthritis. Am J Sports Med. 2007;35:1756–69. doi: 10.1177/0363546507307396. [DOI] [PubMed] [Google Scholar]
- 108.Lohmander LS, Ostenberg A, Englund M, Roos H. High prevalence of knee osteoarthritis, pain, and functional limitations in female soccer players twelve years after anterior cruciate ligament injury. Arthritis Rheum. 2004;50:3145–52. doi: 10.1002/art.20589. [DOI] [PubMed] [Google Scholar]
- 109.Naredo E, Cabero F, Palop MJ, Collado P, Cruz A, Crespo M. Ultrasonographic findings in knee osteoarthritis: a comparative study with clinical and radiographic assessment. Osteoarthritis Cartilage. 2005;13:568–74. doi: 10.1016/j.joca.2005.02.008. [DOI] [PubMed] [Google Scholar]
- 110.Hayashi D, Roemer FW, Katur A, Felson DT, Yang SO, Alomran F, Guermazi A. Imaging of Synovitis in Osteoarthritis: Current Status and Outlook. Semin Arthritis Rheum. doi: 10.1016/j.semarthrit.2010.12.003. [DOI] [PubMed] [Google Scholar]
- 111.Pelletier JP, Martel-Pelletier J, Abramson SB. Osteoarthritis, an inflammatory disease: potential implication for the selection of new therapeutic targets. Arthritis Rheum. 2001;44:1237–47. doi: 10.1002/1529-0131(200106)44:6<1237::AID-ART214>3.0.CO;2-F. [DOI] [PubMed] [Google Scholar]
- 112.Myers SL, Flusser D, Brandt KD, Heck DA. Prevalence of cartilage shards in synovium and their association with synovitis in patients with early and endstage osteoarthritis. J Rheumatol. 1992;19:1247–51. [PubMed] [Google Scholar]
- 113.Loeuille D, Chary-Valckenaere I, Champigneulle J, Rat AC, Toussaint F, Pinzano-Watrin A, Goebel JC, Mainard D, Blum A, Pourel J, Netter P, Gillet P. Macroscopic and microscopic features of synovial membrane inflammation in the osteoarthritic knee: correlating magnetic resonance imaging findings with disease severity. Arthritis Rheum. 2005;52:3492–501. doi: 10.1002/art.21373. [DOI] [PubMed] [Google Scholar]
- 114.Rollin R, Marco F, Jover JA, Garcia-Asenjo JA, Rodriguez L, Lopez-Duran L, Fernandez-Gutierrez B. Early lymphocyte activation in the synovial microenvironment in patients with osteoarthritis: comparison with rheumatoid arthritis patients and healthy controls. Rheumatol Int. 2008;28:757–64. doi: 10.1007/s00296-008-0518-7. [DOI] [PubMed] [Google Scholar]
- 115.Brandt KD, Dieppe P, Radin E. Etiopathogenesis of osteoarthritis. Med Clin North Am. 2009;93:1–24. xv. doi: 10.1016/j.mcna.2008.08.009. [DOI] [PubMed] [Google Scholar]
- 116.Myers SL, Brandt KD, Ehlich JW, Braunstein EM, Shelbourne KD, Heck DA, Kalasinski LA. Synovial inflammation in patients with early osteoarthritis of the knee. J Rheumatol. 1990;17:1662–9. [PubMed] [Google Scholar]
- 117.Kortekaas MC, Kwok WY, Reijnierse M, Watt I, Huizinga TW, Kloppenburg M. Pain in hand osteoarthritis is associated with inflammation: the value of ultrasound. Ann Rheum Dis. 69:1367–9. doi: 10.1136/ard.2009.124875. [DOI] [PubMed] [Google Scholar]
- 118.Ledingham J, Regan M, Jones A, Doherty M. Factors affecting radiographic progression of knee osteoarthritis. Ann Rheum Dis. 1995;54:53–8. doi: 10.1136/ard.54.1.53. [DOI] [PMC free article] [PubMed] [Google Scholar]
- 119.Smith MD, Triantafillou S, Parker A, Youssef PP, Coleman M. Synovial membrane inflammation and cytokine production in patients with early osteoarthritis. J Rheumatol. 1997;24:365–71. [PubMed] [Google Scholar]
- 120.Keen HI, Wakefield RJ, Grainger AJ, Hensor EM, Emery P, Conaghan PG. An ultrasonographic study of osteoarthritis of the hand: synovitis and its relationship to structural pathology and symptoms. Arthritis Rheum. 2008;59:1756–63. doi: 10.1002/art.24312. [DOI] [PubMed] [Google Scholar]
- 121.Guermazi A, Burstein D, Conaghan P, Eckstein F, Hellio Le Graverand-Gastineau MP, Keen H, Roemer FW. Imaging in osteoarthritis. Rheum Dis Clin North Am. 2008;34:645–87. doi: 10.1016/j.rdc.2008.04.006. [DOI] [PubMed] [Google Scholar]
- 122.Wakefield RJ, Balint PV, Szkudlarek M, Filippucci E, Backhaus M, D’Agostino MA, Sanchez EN, Iagnocco A, Schmidt WA, Bruyn GA, Kane D, O’Connor PJ, Manger B, Joshua F, Koski J, Grassi W, Lassere MN, Swen N, Kainberger F, Klauser A, Ostergaard M, Brown AK, Machold KP, Conaghan PG. Musculoskeletal ultrasound including definitions for ultrasonographic pathology. J Rheumatol. 2005;32:2485–7. [PubMed] [Google Scholar]
- 123.Haraoui B, Pelletier JP, Cloutier JM, Faure MP, Martel-Pelletier J. Synovial membrane histology and immunopathology in rheumatoid arthritis and osteoarthritis. In vivo effects of antirheumatic drugs. Arthritis Rheum. 1991;34:153–63. doi: 10.1002/art.1780340205. [DOI] [PubMed] [Google Scholar]
- 124.Keen HI, Conaghan PG. Ultrasonography in osteoarthritis. Radiol Clin North Am. 2009;47:581–94. doi: 10.1016/j.rcl.2009.04.007. [DOI] [PubMed] [Google Scholar]
- 125.Song IH, Althoff CE, Hermann KG, Scheel AK, Knetsch T, Schoenharting M, Werner C, Burmester GR, Backhaus M. Knee osteoarthritis. Efficacy of a new method of contrast-enhanced musculoskeletal ultrasonography in detection of synovitis in patients with knee osteoarthritis in comparison with magnetic resonance imaging. Ann Rheum Dis. 2008;67:19–25. doi: 10.1136/ard.2006.067462. [DOI] [PubMed] [Google Scholar]
- 126.Walther M, Harms H, Krenn V, Radke S, Faehndrich TP, Gohlke F. Correlation of power Doppler sonography with vascularity of the synovial tissue of the knee joint in patients with osteoarthritis and rheumatoid arthritis. Arthritis Rheum. 2001;44:331–8. doi: 10.1002/1529-0131(200102)44:2<331::AID-ANR50>3.0.CO;2-0. [DOI] [PubMed] [Google Scholar]
- 127.Walther M, Harms H, Krenn V, Radke S, Kirschner S, Gohlke F. Synovial tissue of the hip at power Doppler US: correlation between vascularity and power Doppler US signal. Radiology. 2002;225:225–31. doi: 10.1148/radiol.2251011272. [DOI] [PubMed] [Google Scholar]
- 128.D’Agostino MA, Conaghan P, Le Bars M, Baron G, Grassi W, Martin-Mola E, Wakefield R, Brasseur JL, So A, Backhaus M, Malaise M, Burmester G, Schmidely N, Ravaud P, Dougados M, Emery P. EULAR report on the use of ultrasonography in painful knee osteoarthritis. Part 1: prevalence of inflammation in osteoarthritis. Ann Rheum Dis. 2005;64:1703–9. doi: 10.1136/ard.2005.037994. [DOI] [PMC free article] [PubMed] [Google Scholar]
- 129.Kumm J, Tamm A, Lintrop M. Association between ultrasonographic findings and bone/cartilage biomarkers in patients with early-stage knee osteoarthritis. Calcif Tissue Int. 2009;85:514–22. doi: 10.1007/s00223-009-9302-2. [DOI] [PubMed] [Google Scholar]
- 130.Fernandez-Madrid F, Karvonen RL, Teitge RA, Miller PR, An T, Negendank WG. Synovial thickening detected by MR imaging in osteoarthritis of the knee confirmed by biopsy as synovitis. Magn Reson Imaging. 1995;13:177–83. doi: 10.1016/0730-725x(94)00119-n. [DOI] [PubMed] [Google Scholar]
- 131.Hill CL, Gale DG, Chaisson CE, Skinner K, Kazis L, Gale ME, Felson DT. Knee effusions, popliteal cysts, and synovial thickening: association with knee pain in osteoarthritis. J Rheumatol. 2001;28:1330–7. [PubMed] [Google Scholar]
- 132.Hill CL, Hunter DJ, Niu J, Clancy M, Guermazi A, Genant H, Gale D, Grainger A, Conaghan P, Felson DT. Synovitis detected on magnetic resonance imaging and its relation to pain and cartilage loss in knee osteoarthritis. Ann Rheum Dis. 2007;66:1599–603. doi: 10.1136/ard.2006.067470. [DOI] [PMC free article] [PubMed] [Google Scholar]
- 133.Roemer FW, Guermazi A, Zhang Y, Yang M, Hunter DJ, Crema MD, Bohndorf K. Hoffa’s Fat Pad: Evaluation on Unenhanced MR Images as a Measure of Patellofemoral Synovitis in Osteoarthritis. AJR Am J Roentgenol. 2009;192:1696–700. doi: 10.2214/AJR.08.2038. [DOI] [PubMed] [Google Scholar]
- 134.Loeuille D, Rat AC, Goebel JC, Champigneulle J, Blum A, Netter P, Gillet P, Chary-Valckenaere I. Magnetic resonance imaging in osteoarthritis: which method best reflects synovial membrane inflammation? Correlations with clinical, macroscopic and microscopic features. Osteoarthritis Cartilage. 2009;17:1186–92. doi: 10.1016/j.joca.2009.03.006. [DOI] [PubMed] [Google Scholar]