Abstract
T2-mapping and diffusion-weighted imaging complement morphological imaging for assessing cartilage disease and injury. The double echo steady state (DESS) sequence has been used for morphological imaging and generates two echoes with markedly different T2 and diffusion weighting. Modifying the spoiler gradient area and flip angle in DESS allows greater control of the diffusion weighting of both echoes. Data from two acquisitions with different spoiler gradient areas and flip angles are used to simultaneously estimate the T2 and apparent diffusion coefficient (ADC) of each pixel. This method is verified in phantoms and validated in vivo in the knee; estimates from different regions of interest in the phantoms and cartilage are compared to those obtained using standard spin-echo (SE) methods. The Pearson correlations were 0.984 for T2 (~2% relative difference between SE and DESS estimates) and 0.997 for ADC (~1% relative difference between SE and DESS estimates) for the phantom study and 0.989 for T2 and 0.987 for ADC in regions of interest in the human knee in vivo. High accuracy for simultaneous 3D T2 and ADC measurements are demonstrated, while also providing morphologic 3D images without blurring or distortion in reasonable scan times.
INTRODUCTION
Osteoarthritis (OA) is a degenerative joint disease that involves functional, structural, morphological, and biochemical changes to the cartilage [1]. Assessing articular cartilage in the early stages of disease with MRI requires techniques that are sensitive to both cartilage morphology and matrix changes. T2 mapping and diffusion-weighted imaging (DWI) have been suggested for assessing early cartilage matrix changes [2], and both T2 and apparent diffusion coefficient (ADC) values can highlight regional structural or biochemical changes caused by disease, injury, or treatment [3, 4].
T2 measurement has been proposed as an indicator of cartilage structure and biochemistry that can track changes before there is cartilage loss [2, 5, 6]. Existing methods for T2 mapping include using multiple 2D spin-echo (SE) acquisitions at different echo times [7] and fast spin-echo techniques [5, 8, 9, 10, 11]. These methods are limited to 2D acquisitions, require long scan times, and often reach specific absorption rate (SAR) limits at high field strengths. A method for 3D T2 mapping with a double echo steady state (DESS) acquisition has recently been proposed [4]. While this method is fast and elegant, diffusion effects can limit its accuracy [12, 13].
Other approaches for monitoring cartilage health use DWI to detect early damage to the collagen matrix of the tissue [14, 15]. The current standard for ADC mapping is 2D SE-DWI [16] with an echo-planar imaging (EPI) readout [17]. This method has seen limited application for cartilage due to the short T2 of the tissue and spatial distortions arising from the sensitivity of the EPI trajectory to B0 field inhomogeneity. Methods using a segmented-EPI readout [18] are fast and reduce distortion and T2 blurring, but are sensitive to motion. Gradient-spoiled sequences with the acquisition following the spoiler such as PSIF (time-reversed FISP), CE-FAST, or T2-FFE provide equivalent information to the second echo of the DESS sequence [19, 20]. These sequences are sensitive to diffusion [12], are fast, and have been used to produce EPI artifact- and distortion-free images [21, 22]. However, they generate relative ADC maps or require independent measurements of other tissue parameters to calculate absolute ADC values [3, 12, 23, 24]. Additionally, T2 effects limit the accuracy of these methods at the echo times necessary to provide adequate diffusion weighting.
In this work, we present a method to simultaneously calculate 3D T2 and ADC maps from both echoes of two modified 3D DESS acquisitions. The two acquisitions have different flip angles and spoiler gradient areas. The sum-of-squares of the two echoes provides high-quality morphological images [25, 26, 27]. We validate our method in phantoms and in vivo comparing our results with those obtained with standard spin echo T2 maps and ADC measurements.
METHODS
We made modifications to a 3D DESS sequence to improve control and flexibility of the diffusion sensitivity. To calculate the T2 and ADC estimates efficiently, we chose to fit the measured signals from two acquisitions to the model described by Wu and Buxton in ref. 12. We chose imaging parameters that produce high-SNR morphological images and verified these parameters with Monte Carlo simulations. To validate our method, we acquired phantom and in vivo images and compared the results to those obtained with standard SE methods.
THE MODIFIED 3D DESS SEQUENCE
The double echo steady state (DESS) sequence [28], also known as fast acquisition double echo (FADE) sequence [29], consists of a steady-state-free-precession (SSFP) sequence where the readout gradient is lengthened and left unbalanced to allow the readout of two echoes. Typically, S+ denotes the signal at the first echo whose contrast is dominated by the T1/T2 ratio. This signal is equivalent to the signal from a gradient- spoiled sequence such as FISP [30], FAST [19], or FFE [20]. S− typically denotes the signal at second echo and its contrast is dominated by T2 and diffusion. This signal is equivalent to the signal from a PSIF, CE-FAST, or T2-FFE sequence [20]. Wu and Buxton have described the signal equations for both echoes in ref. 12.
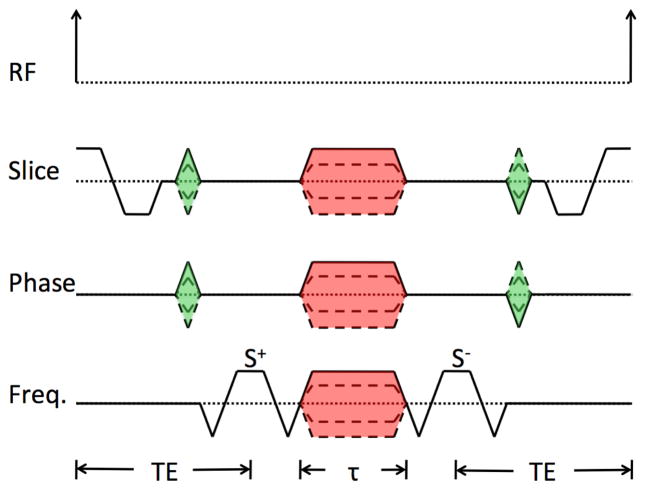
We modified the DESS sequence to enable greater control of the diffusion weighting of both S+ and S− echoes by separating two fully balanced readout gradients from the spoiler gradient as shown in Fig. 1. The unbalanced spoiler gradient produces multiple effects: it separates the echoes in time to eliminate the characteristic banding artifact associated with long-TR SSFP imaging [31] and it provides the sequence with variable diffusion sensitivity. The spoiler gradient duration (τ) and amplitude (G) can be set independently of the other sequence parameters. Furthermore, the spoiler gradient can be played in one or more of the gradient directions (slab select, phase encode, and readout). When the spoiler is played on the readout axis, it can be combined with the preparatory gradients to minimize the time needed between the readouts. Here we will refer to this sequence as the modified 3D DESS sequence (Fig. 1).
Figure 1. A single repetition of the modified 3D DESS sequence.
In the frequency direction, this consists of two fully-rewound readout gradients separated by a spoiler gradient, which can then be combined with the preparatory gradients to save scan time. The duration (τ) and the amplitude (G) of the spoiler gradient (shaded red) can be set for each axis independently of the other imaging parameters. The signal from the first readout is referred to as the S+ echo and signal from the second readout as the S− echo. The unbalanced spoiler gradient separates the two echoes in time and effects the diffusion weighting of the images. We chose to use the same time (TE) from the peak of the RF pulse to the center of the S+ readout and from the center of the S− readout to the peak of the following RF pulse for all of our experiments. However, this is an arbitrary choice, and these two times can be set independently.
TISSUE PARAMETER FITTING
Based on the signal model described by Wu and Buxton [12], the magnitude of the signal from each echo is a function of imaging and tissue parameters. For i=1,2 for the first and second acquisitions,
where TR is the repetition time, TE is the echo time of the S+ echo, τ is the spoiler gradient duration, FA is the flip angle, G is the spoiler gradient amplitude, and M0 is the equilibrium magnetization. We solve for T1, T2, and diffusivity (D).
In this model, M0 appears only as a multiplicative factor, so we use ratios to remove the contributions of M0 and proton density from our calculations. We used the ratios S1−/S1+, S2−/S2+, and S1+/S2+ so that the larger signal is in the denominator to reduce the sensitivity of the fit to noise, though other ratios could be used.
We obtained a total of four magnitude images from a pair of modified 3D DESS acquisitions: one with low flip angle and large spoiler gradient area (high diffusion sensitivity) and a second with high flip angle and small spoiler gradient area (low diffusion sensitivity) [12]. We simultaneously estimated T1, T2, and ADC for each voxel by searching over a range of values for the tissue parameters that minimize the sum of the squared errors between measured and modeled values for the 3 ratios S1−/S1+, S2−/S2+, and S1+/S2+. Our fit is equivalent to a non-linear least squares fit, described by the equation:
The imaging parameters for the modified 3D DESS acquisitions were chosen to provide adequate SNR for morphological cartilage assessment and sufficient sensitivity to T2 and ADC to accurately estimate them over the range of expected values for healthy cartilage [32]. (Although the fit also estimates T1, the values are not reported because the imaging parameters are not optimized for T1 estimation). We selected timing parameters (TR = 26 msec; TE = 9 msec; and τ = 2 msec) to allow fast imaging with a sufficient range of spoiler gradient areas to provide substantially different diffusion weightings. For in vivo images, we used a spectral-spatial (water-only) excitation to suppress fat. We used a 35° flip angle for the images with low diffusion sensitivity as is explained in ref. 4, and we used an 18° flip angle for the images with high diffusion sensitivity. This combination was chosen to provide similar SNR in cartilage as in the images with low diffusion sensitivity based on the signal equations using the expected tissue parameters for healthy cartilage. The maximum spoiler gradient area of 80 msec×mT/m per axis was chosen based on the maximum gradient amplitude all our systems are capable of, and the minimum spoiler gradient area of 10 msec×mT/m per axis was the lowest that provides adequate gradient spoiling (eliminates the balanced-SSFP banding artifact [31]). Note that the slice-select and imaging gradients do introduce additional diffusion weighting, but this is negligible and not included in our analysis.
We verified the accuracy of estimates calculated from data obtained with the above parameters using Monte Carlo simulations of the fit for a range of T2 values between 20 and 120 msec, and ADC values between 0.7 and 2.3 ×10⁻⁹ m2/sec. Real-valued Gaussian noise was added to predicted signals with a noise level chosen so that the echo with the highest signal had an SNR of 50. The fit for each tissue-parameter combination was repeated for 100 different noisy magnitude images and the bias in the means of the resulting estimates of T2 and ADC values were calculated by subtracting the true values from the mean estimated values.
PHANTOM STUDY
We imaged a series of phantoms consisting of tubes with different concentrations of agar in water, peanut oil, hen egg whites, and dishwashing soap, resulting in a wide range of T2 and diffusivity values. We compared the T2 values calculated using modified 3D DESS acquisitions and our algorithm with two other methods: (1) a series of SE acquisitions with different TEs, and (2) using a single DESS acquisition with a 35° flip angle, as explained in ref. 4 (referred to as DESS-T2d). We also compared the ADC values estimated with our algorithm with those generated using a SE-DWI sequence.
We acquired all images on a 3 T GE Discovery whole-body scanner (GE Healthcare, Waukesha, WI). The system has a maximum gradient amplitude of 50 mT/m and a maximum slew rate of 200 mT/m/sec. We obtained all data with an HD Array extremity radiofrequency (RF) coil consisting of a quadrature transmit coil and an 8-channel phased-array receive coil (GE Healthcare, Pewaukee, WI).
We obtained axial images using the modified 3D DESS sequence with the following parameters: TR = 26 msec; TE = 9 msec; field of view (FOV) = 18×18 cm2; matrix = 256×256; readout bandwidth (RBW) = ±32 kHz; slice thickness = 3 mm; 38 slices; and τ = 2 msec. To maximize diffusion sensitivity differences, we acquired one data set with lower diffusion sensitivity using flip angle = 35° and spoiler gradient area = 10 msec×mT/m per axis, and another data set with higher diffusion sensitivity using flip angle = 18° and spoiler gradient area = 80 msec×mT/m per axis. We applied the same spoiler gradient area on all three axes, resulting in effective spoiler gradient areas of 17.32 msec×mT/m or 138.56 msec×mT/m. The scan time for each of the two modified 3D DESS acquisitions was 4 min 10 sec.
For DESS-T2d, we estimate T2 as described in ref. 4: T2 = (TE2 − TE1)/ln(S+ / S−) using data from the modified 3D DESS acquisition with the lower diffusion sensitivity, i.e. with flip angle = 35° and spoiler gradient area of 10 msec×mT/m per axis.
To calculate T2 estimates with the traditional SE method, we acquired a single axial slice at the same location as a slice of the modified 3D DESS acquisitions near the center of the phantom. The FOV, in-plane matrix, readout bandwidth, and slice thickness were the same as those used for the modified 3D DESS acquisitions. We used TR = 300 msec and we obtained 8 images with TE = 10, 20, 30, 40, 50, 60, 70, and 80 msec; each SE image was acquired in 1 min 23 sec for a total scan time of 11 min 4 sec. We calculated the T2 values using a mono-exponential fit.
To calculate ADC estimates with the traditional SE method, we acquired axial SE-DWI-EPI images near the center of the phantom. Each SE-DWI-EPI image was acquired in approximately 18 seconds using the following parameters: FOV = 24×12 cm2; matrix = 64×32; slice thickness = 10 mm; TR = 6 s; TE = 57.7 msec; RBW = ±250 kHz; 1 signal average. We acquired two data sets with b-values of 0 and 200 s/mm2 and calculated the ADC values using a mono-exponential fit.
We used linear regressions to compare the estimated T2 and ADC values between modified 3D DESS and SE. The quality of the regressions was evaluated using the Pearson coefficient (R), and the accuracy of each method was evaluated using the average ratio of the estimated values to those calculated with the standard SE methods.
We selected regions of interest (ROIs) with the same area in each of the tubes. We compared the T2 and the DESS-T2d estimates voxel-by-voxel in each ROI to those generated with the standard SE images; we also compared the values of the mean and standard deviation for each ROI. We compared the mean and standard deviation of the ADC estimates for each ROI to those generated with the standard SE-DWI. Due to the distortion in the SE-DWI images, we did not perform a voxel-by-voxel comparison for the ADC estimates.
VOLUNTEER STUDY
To verify the feasibility of our method in vivo, we acquired knee images from four healthy subjects (two males, two females, ages 26 to 36, mean age 34) with no history of knee pain or injury and compared the resulting T2 and ADC maps with the standard SE T2 and ADC mapping methods. We obtained written informed consent from all volunteers and conducted all research activities within the guidelines of the institutional review board at our institution.
We scanned all volunteers using the modified 3D DESS sequence with the same parameters used for the phantom acquisitions, except that we used a spatial-spectral (water-only) RF excitation for fat suppression. We acquired axial images in all volunteers with between 46 slices (in 5 min 6 sec) and 56 slices (in 6 min 13 sec) required to cover the whole knee. Each 3D data set necessary for quantification was acquired in 10 min 12 sec to 12 min 26 sec. We acquired sagittal images from all volunteers with the same parameters to demonstrate our method in the sagittal plane. 38 slices (in 4 min 13 sec) to 46 slices (in 5 min 6 sec) were needed to cover the knee resulting in 8 min 26 sec to 10 min 12 sec total acquisition time for the data necessary for quantification.
To obtain T2 and ADC estimates with traditional methods, we acquired a single slice image using product SE sequences at the same location as a slice of the modified 3D DESS acquisitions. For T2 calculations, we acquired data with a fast SE (FSE) T2- mapping product sequence (GE Healthcare, Waukesha, WI) with the same resolution as the modified 3D DESS acquisitions, with TR = 1.2 sec, and seven echoes with TEs = 8.2, 16.5, 24.7, 33.0, 41.2, 49.5, 57.7, and 66.0 msec, with the first echo discarded for analysis. Each FSE image was acquired in 5 min 8 sec. We acquired SE-DWI-EPI images with the following parameters: FOV = 18×18 cm2; matrix = 128×128; slice thickness = 3 mm; TR = 8 s; TE = 89 msec; RBW = ±250 kHz; 4 signal averages. We acquired two data sets with b-values of 0 and 200 s/mm2. The scan time for each SE-DWI image was 2 min 16 sec. The in vivo scans required longer scan times than the phantom scans due to the larger matrix and number of averages.
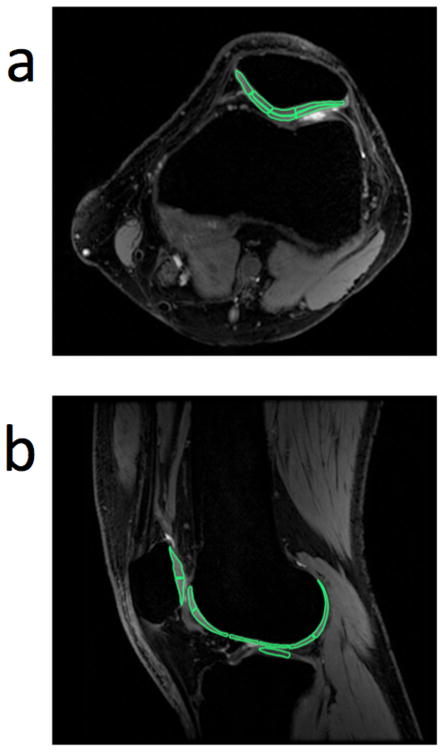
We selected in different areas of the cartilage based on the visible anatomical features on the modified 3D DESS images. The locations of the ROIs are shown in Fig. 2. We selected 7 ROIs on a single axial slice for each subject (13 to 24 mm2, 19.2 mm2 average area) through the mid-patella: medial, superficial and deep medial-apical, superficial and deep lateral-apical, and superficial and deep lateral patellar cartilage. We selected 9 ROIs on a single sagittal slice for each subject (13 to 39 mm2, 26.5 mm2 average area) through the lateral compartment: superior and inferior patellar, superior and inferior trochlea, anterior femoral, mid-anterior femoral, mid-posterior femoral, posterior femoral, and central tibia cartilage. We copied the ROIs onto the standard SE images and adjusted them for patient motion or distortion. We compared the mean and standard deviation of T2 and ADC values generated with modified 3D DESS and standard SE methods across each ROI. The statistical analysis of all comparisons was the same as for the phantom study.
Figure 2. Positions of ROIs within knee cartilage.
Seven ROIs (13 to 24 mm2, 19.2 mm2 average area) were selected in a single axial slice through the mid-patella (a) from each subject: medial, superficial and deep medial-apical, superficial and deep lateral-apical, and superficial and deep lateral patellar cartilage. Nine ROIs (13 to 39 mm2, 26.5 mm2 average area) were selected in a single sagittal slice through the lateral compartment (b) from each subject: superior and inferior patellar, superior and inferior trochlea, anterior femoral, mid-anterior femoral, mid-posterior femoral, posterior femoral, and central tibia cartilage. All ROIs were selected based on the morphological 3D DESS images. We carefully selected the ROIs in equivalent locations in all subjects. We compared the mean T2 and ADC values obtained with the modified 3D DESS method and with standard SE methods for each ROI.
RESULTS
We estimated T2 and ADC values, which matched well with standard methods, both in phantoms and in vivo, thus validating our method.
TISSUE PARAMETER FITTING
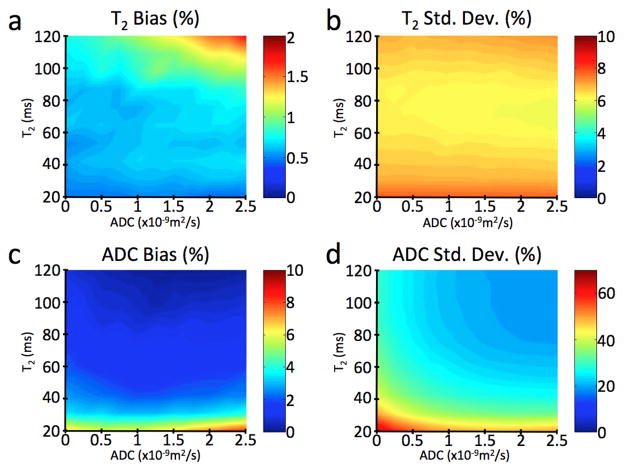
The results of the Monte Carlo simulations show that the T2 and ADC fits are robust (Fig. 3). For an SNR of 50 in the highest-signal image, the bias of the mean T2 fits was positive and less than 2% in every simulated case, although typically less than 1%, and equal to 0.7% for the tissue parameters expected for healthy cartilage (T2 = 40 msec, ADC = 1.5×10⁻⁹ m2/sec). The standard deviation of the T2 fits was typically around 7%. The bias of the mean ADC estimates was positive and less than 10% for all simulated cases, and 3% for the tissue parameters expected for healthy cartilage. The standard deviation for the ADC simulations was between 20% and 75% for all cases, and 34% for the tissue parameters expected for healthy cartilage. The standard deviation would be substantially reduced if higher-SNR source images were used: SNRs of 100 or 200 in the highest-signal image results in a standard deviations for the ADC estimates of 16% or 8%. While these SNR levels are routinely reached with our method as described, further increases of SNR could be achieved, for example, by voxel averaging prior to parameter estimation.
Figure 3. Simulation results verifying the accuracy of the T2 and ADC estimates.
We verified the accuracy of our estimates with Monte Carlo simulations for a range of different T2 and ADC values and with an SNR of 50 for the echo with the highest signal. The difference between the mean estimate for T2 and the true value is less than 2% in every simulated case, under 1% in most cases, and equal to 0.7% for the values expected for cartilage (T2 = 40 msec, ADC = 1.5×10⁻⁹ m2/sec) (a). The standard deviation of these T2 estimates (b) is always around 7%. The bias on the mean estimate for ADC is always less than 10% (c), and less than 5% for the values expected for cartilage. While the standard deviation of the ADC estimates can be as high as 75% for very low T2 and ADC values, it is 34% for the values expected for cartilage (d). Increasing the SNR of the modified 3D DESS images can substantially reduce this standard deviation: an SNR of 100 results in a standard deviation of 16%, and an SNR of 200 results in a standard deviation of 8%.
PHANTOM STUDY
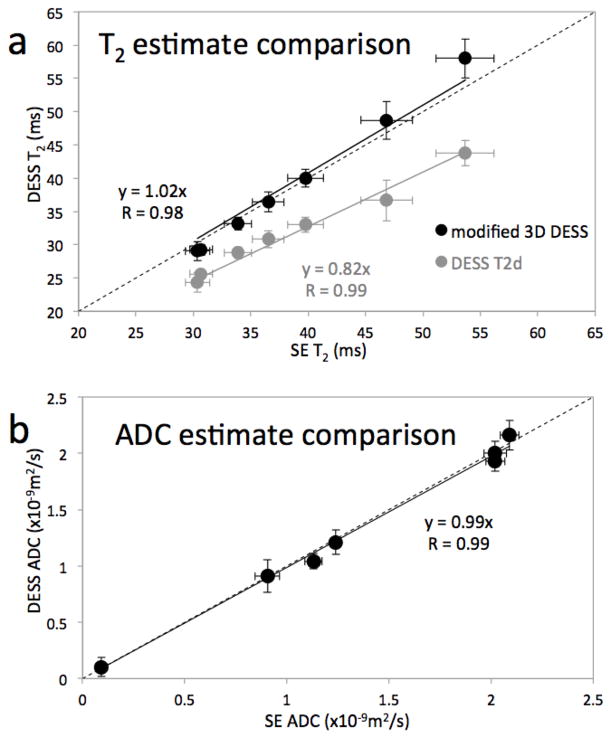
The linear regression of the T2 values shows good correlation between the modified 3D DESS method and the SE method, with a Pearson coefficient of 0.984 (p < 0.0001) (Fig. 4a, black data points). Our method overestimated the SE T2 values by about 2% on average. Although the Pearson coefficient (R) is high (R = 0.995), DESS-T2d underestimated the SE T2 values by about 18% (Fig 4a, gray data points). Voxel-by-voxel comparisons yield similar results: R = 0.954 with a 2% overestimation for our modified 3D DESS method and R = 0.942 with an 18% underestimation for the DESS-T2d method, consistent with ref. 4.
Figure 4. Phantom study results.
In both plots, the location of each dot represents the mean values and the length of the error bars represent ±1 standard deviation of the measurements in the ROI in each phantom using data from the modified 3D DESS acquisition (vertical) and standard SE techniques (horizontal). The T2 estimates from the modified 3D DESS sequence compare very well with those from the SE method (R = 0.984) (a, black data). While the DESS-T2d fit is marginally better (R = 0.990) (a, gray data) this method underestimates the SE T2 values by 18% on average. With our modified 3D DESS method, we can correct the T2 estimates to within 2% and simultaneously generate ADC estimates. The cost for this improvement is the additional scan time needed for a second modified 3D DESS acquisition. The ADC values from both methods compare remarkably well, with R > 0.99 and the estimates differ by less than 2% on average (b). Note that the standard deviations of the estimates from the modified 3D DESS method and the standard SE methods are comparable.
The ADC regression shows high linearity, with a Pearson coefficient of 0.997 (p < 0.0001) and high accuracy with the values underestimated by 1% on average (Fig. 4b). In all cases, the standard deviations of the modified 3D DESS method and the SE methods are comparable.
VOLUNTEER STUDY
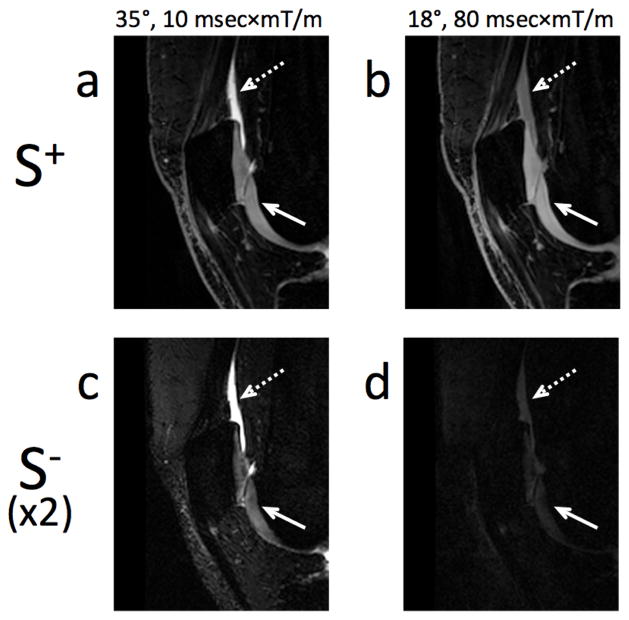
Figure 5 shows four images obtained with the two modified 3D DESS acquisitions required for our method. The figure shows that, with all other parameters constant, higher diffusion weighting changes the image contrast. This is particularly evident when comparing the signal in fluid (dashed arrow) and cartilage (solid arrow). While the fluid signal changes significantly between the scans with different gradient areas, the cartilage signal changes much less, which is expected since the diffusivity of fluid is much higher than that of cartilage. Compared to the S+ signal (Fig. 5a, b), the S− (Fig. 5c, d) is considerably more T2-weighted, hence the cartilage signal is more heavily attenuated between echoes than the fluid signal, in agreement with refs. 4, 28, 29, and 33.
Figure 5. Contrast in the modified 3D DESS sequence.
In the modified 3D DESS sequence, to first order, T2 effects dominate the contrast difference between the two echoes (S+ and S−) and diffusion effects dominate the contrast difference between the two acquisitions (35° flip angle, 10 msec×mT/m per axis gradient area, and 18° flip angle, 80 msec×mT/m per axis gradient area). This can be seen in cartilage (short T2, solid arrow) and in fluid (high diffusivity, dashed arrow). The first row (a, b) shows the S+ echo for two acquisitions of the modified 3D DESS sequence with the same timing parameters, but with different flip angles and spoiler gradient amplitudes. Cartilage and fluid appear isointense in (b) while fluid appears much brighter than cartilage in the S+ echo of the acquisition with lower diffusion sensitivity (a). The second row (c, d) shows the S− echo of these acquisitions (signal intensity multiplied by 2). The cartilage signal intensity is attenuated much more than that of the fluid when the effective echo time is increased (a vs. c, b vs. d).
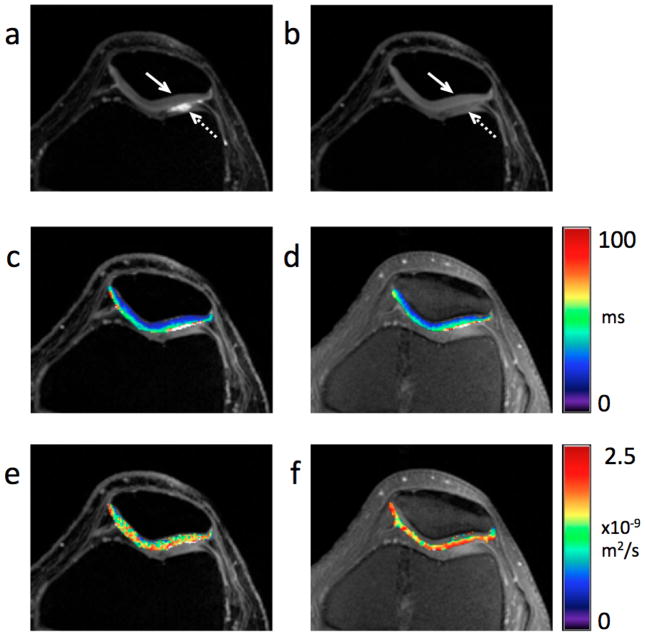
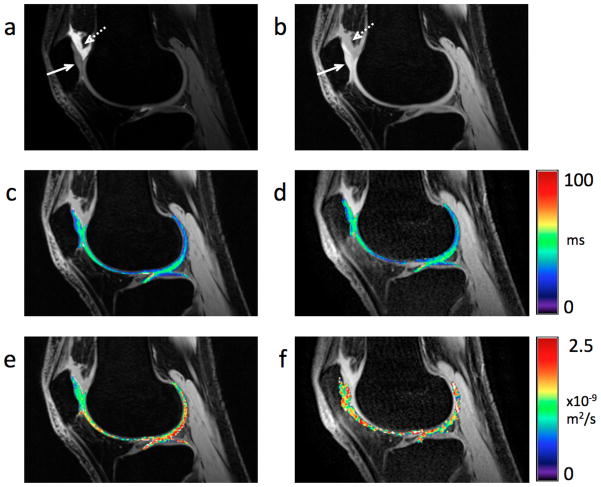
Figures 6a and 7a show that the images obtained with the lower diffusion sensitivity exhibit the traditional DESS “T2-like” contrast [4, 28, 29, 33], while the images obtained with the higher diffusion sensitivity (Figs. 6b, 7 b) exhibit more signal attenuation in areas with high diffusivity, such as synovial fluid (dashed arrows). Both the images with low diffusion sensitivity and with high diffusion sensitivity have similar SNR in the cartilage (solid arrows). The T2 maps (Figs. 6c, 7c) show the expected variations within the cartilage, increasing from deep to tangential layers [5]. Figure 7c shows the normal magic angle lengthening.
Figure 6. Detail of axial modified 3D DESS images, ADC and T2 maps of the knee in vivo.
Sum-of-squares images from the modified 3D DESS acquisition with lower diffusion weighting (flip angle = 35°, spoiler gradient area = 10 msec×mT/m per axis) (a) and with higher diffusion weighting (flip angle = 18°, spoiler gradient area = 80 msec×mT/m per axis) (b). While both images show comparable SNR, the cartilage (solid arrow) to fluid (dashed arrow) contrast is markedly different. The expected variation in T2 within cartilage is clearly visible in the DESS T2 map (c) overlaid on (b) and the standard FSE T2 map (d) overlaid on a source FSE T2-weighted image. No substantial change in ADC is visible through the cartilage thickness in neither the DESS ADC map (e) overlaid on (b) nor the standard SE-DWI ADC map (f) overlaid on a source FSE T2-weighted image. While none of the DESS images (a, b) or maps (c, e) show evidence of distortion or blurring, some distortion is noticeable on the SE-DWI ADC map (f).
Figure 7. Detail of sagittal modified 3D DESS images, ADC and T2 maps of the knee in vivo.
Sum-of-squares image from the modified 3D DESS acquisition with lower diffusion weighting (flip angle = 35°, spoiler gradient area = 10 msec×mT/m per axis) (a) and with higher diffusion weighting (flip angle = 18°, spoiler gradient area = 80 msec×mT/m per axis) (b). The different diffusion weightings clearly result in different contrasts between cartilage (solid arrow) and fluid (dashed arrow) in (a) and (b). Both the DESS T2 map (c) overlaid on (b) and the FSE T2 map (d) overlaid on a source FSE T2- weighted image exhibit the expected variation within cartilage, including magic angle effects. The DESS ADC map (e) overlaid on (b) does not show any distortion nor blurring, while the SE-DWI ADC map (f) overlaid on a source FSE T2-weighted image is clearly distorted.
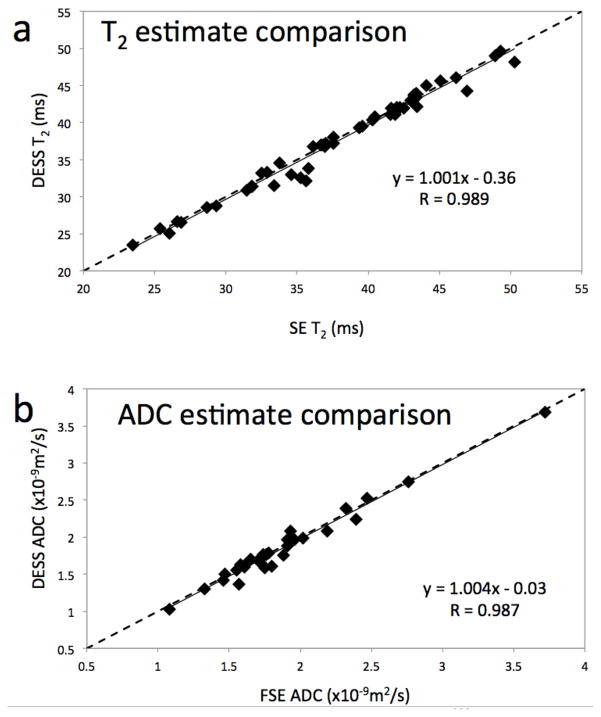
The mean T2 values in each ROI in the in vivo images (for example, Fig. 6c) were highly correlated with T2 values from the FSE data (Fig. 8a), with a Pearson coefficient of 0.989 (p < 0.0001). The T2 estimates were also very accurate, with the mean absolute difference between the T2 estimates of 1.8% and with a standard deviation of 2%. Furthermore, the values from the modified 3D DESS data and the FSE data correlate linearly with a slope of 1.001 and cross the y-axis at −0.36 msec, implying that the values from the modified 3D DESS data were similar on average to the FSE data.
Figure 8. In vivo results.
In both plots, the location of each dot represents the mean values for each ROI using data from the modified 3D DESS acquisition (vertical) and standard SE techniques (horizontal). The T2 estimates from the modified 3D DESS sequence compare very well with those from the SE method (R = 0.989) (a). The slope of the linear correlation is only marginally larger than unity, and its zero-crossing absolute value is less than 0.5 msec. The high correlation and proximity of the fitted slope to unity indicate a very good match between the values obtained from both methods. Similar results are shown for the ADC values (b), with R = 0.987, the slope of the correlation less than 0.5% away from unity, and the zero crossing at −0.03 ×10⁻⁹ m2/sec.
We obtained similar results for the ADC estimates. The mean ADC values in each ROI from the in vivo images (for example, Fig. 6e) were highly correlated with the SE-DWI data (Fig. 8b), with a Pearson coefficient of 0.987 (p < 0.0001). The ADC estimates were also very accurate, with the mean absolute difference between the ADC estimates of 3.3% and with a standard deviation of 3.4%. Furthermore, the values from the modified 3D DESS data and the SE-DWI data correlate linearly with a slope of 1.004 and cross the y-axis at −0.03×10⁻⁹ m2/sec, implying that the values from the modified 3D DESS data were less than 1% higher on average than the SE-DWI data. Our method also produced distortion-free ADC maps in the sagittal plane (Fig. 7e).
DISCUSSION
Our results demonstrate that accurate 3D maps of T2 and ADC can be made using both S+ and S− echoes from two modified 3D DESS acquisitions with different diffusion sensitivity. These images were fitted to the signal model developed by Wu and Buxton [12] for estimating T2 and ADC values. We first simulated this fitting method to confirm that the chosen parameters yielded robust estimations and high-SNR morphological images. Next, we compared our T2 and ADC estimates for a set of phantoms with those generated by standard methods, i.e., acquiring SE images with varying TE for T2 estimation and SE-DWI-EPI for ADC estimation. Finally, we validated our method with a study in healthy volunteers that compared the resulting T2 and ADC maps of articular knee cartilage with those obtained using SE sequences.
Since the diffusion sensitivity of the original DESS sequence is dependent on the unbalanced gradient area, any change to the imaging parameters that changes the readout gradient area may also change the contrast, which in turn affects DESS-T2d estimates [13]. Therefore, changes in imaging parameters may affect the T2 estimates obtained with DESS-T2d. Since DESS-T2d underestimates T2 compared to SE, and the S− echo is more heavily diffusion weighted, the error is quite likely due in part to diffusion effects. Furthermore, changing (for example) the resolution in the original DESS sequence could change the diffusion sensitivity leading to a different bias in T2 estimates. This is the reason for our modification to 3D DESS, to decouple the diffusion weighting from imaging parameters other than the spoiler gradient area. With the modified 3D DESS sequence, the amount of unbalancing is only determined by the spoiler gradients. Therefore, changing the resolution or FOV does not affect the contrast.
Compared with spin echo (SE) methods, there are several advantages to using the proposed method. Since the proposed method uses a 3D acquisition, it can achieve full-knee coverage with thin, contiguous slices in much less scan time than the traditional 2D SE methods and it does not suffer from the limitations of 2D multi-slice acquisitions, such as slice gaps, slice-profile effects or slice cross talk. While two modified 3D DESS acquisitions of the whole knee, from which we can generate T2 and ADC maps, are acquired in 12 minutes, obtaining SE images with 2 TEs to generate only T2 maps of the same volume and resolution would demand over 24 minutes. Our method is also compatible with parallel imaging and acceleration techniques, potentially shortening the acquisition time. Alternatively, fast spin echo (or TSE/RARE) sequences [34] can be used to speed up the acquisition of individual SE images, but this can result in blurring, especially in cartilage, which is not a problem with the modified 3D DESS sequence.
Further advantages of our modified 3D DESS method over SE methods include that the latter are difficult to implement at high fields due to the refocusing RF pulses and SAR limits. Because echo trains are often used to acquire SE data, T2 decay during the echo train results in blurring and reduces the effective resolution. Furthermore, imperfect refocusing pulses can affect the T2 estimates. Simultaneously solving for T2 and ADC generates more accurate estimates of both values than solving for one parameter without considering the effects of the other. The proposed modified 3D DESS method also produces more accurate estimates of T2 than the DESS-T2d method, at the cost of doubling the acquisition time. Traditional SE-DW methods are particularly difficult to use in the knee because the relatively short T2 of cartilage can result in low signal and blurring and because the EPI readout can cause distortion. The proposed method achieves both high SNR estimates and distortion-free images.
The modified 3D DESS sequence as presented may be very useful in evaluation of cartilage in OA. First, it generates high-resolution, high-SNR 3D morphological images that are very similar to those routinely used for cartilage morphology in large, multicenter trials such as the OA Initiative [25, 26, 27]. Furthermore, the addition of accurate assessment of T2 and ADC from the cartilage matrix may provide a means to detect changes of OA before tissue loss has occurred.
Some practical considerations need to be taken into account when choosing the imaging parameters for the modified 3D DESS sequence. In order to obtain an accurate ADC fit, images with low and high diffusion sensitivities are necessary. Reducing the flip angle and increasing spoiler gradient area increase the diffusion sensitivity. If the spoiler gradient area is too small, there will be insufficient spoiling (resulting in the SSFP banding artifact [31]), and if the spoiler gradient is too large, there will be insufficient signal in the second echo. By modulating the diffusion sensitivity using both the spoiler gradient amplitude and the flip angle, we can achieve sufficiently different diffusion weightings while maintaining image quality. Use of flip angles of 35° and 18° produces S+ images with high cartilage SNR and with useful contrast for cartilage segmentation and morphological assessment. While other flip angles may produce a more precise or accurate fit, the flip angles we used are a good compromise between anatomical image quality and estimation quality.
Our current technique for estimating tissue parameters using the Wu and Buxton model [12] consists of a non-linear least-squares minimization. While the accuracy of our results is very good, other techniques such as an equation inversion may provide more accurate results or much faster parameter fits. Furthermore, it has recently been proposed that the Wu and Buxton model is not accurate in the high diffusion sensitivity regime with very low flip angles [35, 36]. Fitting the acquired signals to the Freed model [35], using extended phase graph methods [37], or using Bloch equation simulations may further improve accuracy, at a cost of increased computational complexity of the fit.
As with other steady-state diffusion imaging techniques [38], the modified 3D DESS sequence allows the flexibility of having spoiler gradients with different amplitudes on each axis, it can encode diffusion in an arbitrary direction, making it a candidate for applications such as diffusion-tensor imaging [39]. However, since a minimum gradient area may be required on some axes to avoid artifacts, not all directions or magnitudes may be equally achievable.
The unbalanced gradients that make the sequence sensitive to diffusion also make the sequence sensitive to other motion. While we have not observed motion artifacts in our knee images, other applications do suffer from this issue. Motion correction techniques that have been shown for steady-state diffusion sequences [3] should be applicable for the modified 3D DESS sequence.
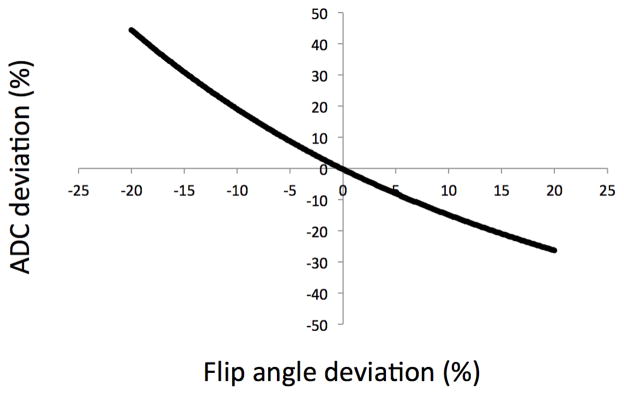
Since the acquired data are fitted to a signal model, it is important that sequence parameters be known precisely. Simulations have shown that our sequence is sensitive to errors in the flip angles (Fig. 9). For example, an error of −10% in the flip angles generates an error of +18% in the ADC estimates for healthy cartilage, while an error of +10% in the flip angles generates an error of −15% in the ADC estimates. A short B1 mapping sequence [40, 41, 42, 43] could be used to accurately measure flip angle and correct the fitted values. The T2 estimation is not affected by errors of up to 20% in flip angles.
Figure 9. Sensitivity of ADC estimates to flip angle.
The error in the ADC estimate was calculated for varying flip angles. The ADC estimate is sensitive to flip angle and the error is more severe when the actual flip angle is less than the desired flip angle because diffusion weighting of the 3D DESS sequence increases rapidly with decreasing flip angles. Estimated T2 values are unchanged in this range.
Given that our method uses both echoes of each acquisition separately, it is desirable that even the S− echoes have enough SNR to allow a robust fit. As shown in our simulation results (Fig. 4), parameter fits for tissues with T2 values less than about 20 msec have a substantial bias and a high standard deviation, particularly for the ADC estimates, due to the low SNR of the S− echo. In order to improve the quality of the fits for these tissues, it is necessary to reduce the TR to reduce the effective TE of the S− echo, thus increasing the SNR. Some means of achieving this include using a non-spectrally-selective RF pulse, increasing the readout bandwidth, decreasing the spoiler gradient duration, or using a partial Fourier readout.
The simulated standard deviation of the ADC estimates was 34% for an SNR of 50 in the echo with the highest signal. We are unaware of any studies estimating the differences in ADC between normal and compromised cartilage in vivo, and therefore the acceptable level for the standard deviation of ADC values has not yet been determined. However our modified 3D DESS method compares favorably with the standard sequence: a simulation of SE-DWI with the same noise levels resulted in a standard deviation of 42%. Methods to increase the SNR of the source signals and reduce the standard deviation of the fits are discussed above.
The imaging parameters were chosen to yield accurate and robust estimations of the expected T2 and ADC values and we fit signal ratios instead of signal levels in order to minimize the effects of proton density (PD) and T1 on the estimates. Our method generates accurate results for T1 values around those expected for cartilage and puts no restrictions on the PD of the tissues imaged. With further optimization of the fitting methodology and the choice of imaging parameters, the same sequence could be used to estimate T1 and PD. However, more than two acquisitions may be needed to do so robustly.
CONCLUSION
By modifying the flip angle and spoiler gradient area, the diffusion sensitivity of DESS acquisitions can be modulated. We have demonstrated that this approach can accurately and robustly estimate T2 and ADC values of knee cartilage in vivo based on two consecutive acquisitions of the modified 3D DESS sequence. We have validated this method in phantoms and in healthy volunteers by comparing the results to standard spin echo methods and found excellent agreement, with Pearson coefficients higher than 0.98 in every case and with mean absolute differences less than 4%.
Acknowledgments
We would like to thank Kyunghyun Sung, Rafael O’Halloran, and Samantha Holdsworth for their assistance with quantitative measurements and the preparation of this manuscript. We also acknowledge our funding sources: NIH EB002524, EB009055, EB012591, RR009784, Arthritis Foundation, and GE Healthcare.
BIBLIOGRAPHY
- 1.Felson DT, Lawrence RC, Dieppe PA, Hirsch R, Helmick CG, Jordan JM, Kington RS, Lane NE, Nevitt MC, Zhang Y, Sowers M, McAlindon T, Spector TD, Poole AR, Yanovski SZ, Ateshian G, Sharma L, Buckwalter JA, Brandt KD, Fries JF. Osteoarthritis: New Insights. 1. The Disease and its Risk Factors. Ann Intern Med. 2000;133:635–646. doi: 10.7326/0003-4819-133-8-200010170-00016. [DOI] [PubMed] [Google Scholar]
- 2.Glaser C. New Techniques for Cartilage Imaging: T2 Relaxation Time and Diffusion-Weighted MR Imaging. Radiol Clin N Am. 2005;43:641–653. doi: 10.1016/j.rcl.2005.02.007. [DOI] [PubMed] [Google Scholar]
- 3.Miller KL, Hargreaves BA, Gold GE, Pauly JM. Steady-State Diffusion-Weighted Imaging of In Vivo Knee Cartilage. Magn Reson Med. 2004;51:394–398. doi: 10.1002/mrm.10696. [DOI] [PubMed] [Google Scholar]
- 4.Welsch GH, Scheffler K, Mamisch TC, Hughes T, Millington S, Deimling M, Trattnig S. Rapid Estimation of Cartilage T2 Based on Double Echo at Steady State (DESS) With 3 Tesla. Magn Reson Med. 2009;62:544–549. doi: 10.1002/mrm.22036. [DOI] [PubMed] [Google Scholar]
- 5.Dardzinski BJ, Mosher TJ, Li S, Van Slyke MA, Smith MB. Spatial Variation of T2 in Human Articular Cartilage. Radiology. 1997;205:546–550. doi: 10.1148/radiology.205.2.9356643. [DOI] [PubMed] [Google Scholar]
- 6.Mosher TJ, Dardzinski BJ, Smith MB. Human Articular Cartilage: Influence of Aging and Early Symptomatic Degeneration on the Spatial Variation of T2 - Preliminary Findings at 3T. Radiology. 2000;214:259–266. doi: 10.1148/radiology.214.1.r00ja15259. [DOI] [PubMed] [Google Scholar]
- 7.Hahn EL. Spin Echoes. Phys Rev. 1950;80:580–594. [Google Scholar]
- 8.Stanisz GJ, Li JG, Wright GA, Henkelman RM. Water Dynamics in Human Blood via Combined Measurements of T2 Relaxation and Diffusion in the Presence of Gadolinium. Magn Reson Med. 1998;39:223–233. doi: 10.1002/mrm.1910390209. [DOI] [PubMed] [Google Scholar]
- 9.Stanisz GJ, Kecojevic A, Bronskill MJ, Henkelman RM. Characterizing White Matter With Magnetization Transfer and T2. Magn Reson Med. 1999;42:1128–1136. doi: 10.1002/(sici)1522-2594(199912)42:6<1128::aid-mrm18>3.0.co;2-9. [DOI] [PubMed] [Google Scholar]
- 10.Whittal KP, MacKay AL, Graeb DA, Nugent RA, Li DKB, Paty DW. In Vivo Measurement of T2 Distributions and Water Contents in Normal Human Brain. Magn Reson Med. 1997;37:34–43. doi: 10.1002/mrm.1910370107. [DOI] [PubMed] [Google Scholar]
- 11.Stefanovic B, Sled JG, Pike GB. Quantitative T2 in the Occipital Lobe: The Role of the CPMG Refocusing Rate. J Magn Reson Imaging. 2003;18:302–309. doi: 10.1002/jmri.10360. [DOI] [PubMed] [Google Scholar]
- 12.Wu EX, Buxton RB. Effect of Diffusion on the Steady-State Magnetiztion with Pulsed Field Gradients. J Magn Reson. 1990;90:243–253. [Google Scholar]
- 13.Staroswiecki E, Granlund KL, Alley MT, Gold GE, Hargreaves BA. T2 Maps and Diffusion-Weighted Imaging of Knee Cartilage with a DESS Sequence at 3T. Proceedings of the 18th Annual Meeting of ISMRM; Stockholm, Sweeden. 2010. p. 824. [Google Scholar]
- 14.Frank LR, Wong EC, Luh W, Ahn JM, Resnick D. Articular Cartilage in the Knee: Mapping of the Physiologic Parameters at MR Imaging with a Local Gradient Coil - Preliminary Results. Radiology. 1999;210:241–246. doi: 10.1148/radiology.210.1.r99ja01241. [DOI] [PubMed] [Google Scholar]
- 15.Mlynárik V, Sulzbacher I, Bittšanský M, Fuiko R, Trattnig S. Investigation of Apparent Diffusion Constant as an Indicator of Early Degenerative Disease in Articular Cartilage. J Magn Reson Imaging. 2003;17:440–444. doi: 10.1002/jmri.10276. [DOI] [PubMed] [Google Scholar]
- 16.Stejskal EO, Tanner JE. Spin Diffusion Measurements: Spin Echoes in the Presence of a Time-Dependent Field Gradient. J Chem Phys. 1965;42:288–292. [Google Scholar]
- 17.Mansfield P. Multi-Planar Image Formation Using NMR Spin Echoes. J Phys C: Slid State Phys. 1977;10:L55–L58. [Google Scholar]
- 18.Gold GE, Butts K, Fechner KP, Bergman G, Beaulieu CF, Lang PK, Macovski A. In Vivo Diffusion-Weighted Imaging of Cartilage. Proceedings of the 6th Annual Meeting of ISMRM; Sydney, Australia. 1998. p. 1066. [Google Scholar]
- 19.Gyngell ML. The Application of Steady-State Free Precession in Rapid 2D FT NMR Imaging: FAST and CE-FAST Pulse Sequences. Magn Reson Med. 1988;6:415–419. doi: 10.1016/0730-725x(88)90478-x. [DOI] [PubMed] [Google Scholar]
- 20.van der Meulen P, Groen JP, Tinus AMC, Bruntink G. Fast Field Echo Imaging: an Overview and Contrast Calculations. Magn Reson Imaging. 1988;6:335–368. doi: 10.1016/0730-725x(88)90472-9. [DOI] [PubMed] [Google Scholar]
- 21.LeBihan D. Intravoxel Incoherent Motion Imaging Using Steady-State Free Precession. Magn Reson Med. 1988;7:346–351. doi: 10.1002/mrm.1910070312. [DOI] [PubMed] [Google Scholar]
- 22.Merboldt K, Hänicke W, Gyngell ML, Frahm J, Bruhn H. Rapid NMR Imaging of Molecular Self-Diffusion Using a Modified CE-FAST Seqeunce. J Magn Reson. 1989;82:115–121. [Google Scholar]
- 23.McNab JA, Miller KL. Steady-State Diffusion-Weighted Imaging: Theory, Acquisition and Analysis. NMR Biomed. 2010;23:781–793. doi: 10.1002/nbm.1509. [DOI] [PubMed] [Google Scholar]
- 24.Deoni SCL, Peters TM, Rutt BK. Quantitative Diffusion Imaging With Steady-State Free Precession. Magn Reson Med. 2004;51:428–433. doi: 10.1002/mrm.10708. [DOI] [PubMed] [Google Scholar]
- 25.Eckstein F, Hudelmaier M, Wirth W, Kiefer B, Jackson R, Yu J, Eaton CB, Schneider E. Double Echo Steady State Magnetic Resonance Imaging of Knee Articular Cartilage at 3 Tesla: A Pilot Study for the Osteoarthritis Initiative. Ann Rheum Dis. 2006;65:433–441. doi: 10.1136/ard.2005.039370. [DOI] [PMC free article] [PubMed] [Google Scholar]
- 26.Peterfy CG, Schneider E, Nevitt M. The Osteoarthritis Initiative: Report on the Design Rationale for the Magnetic Resonance Imaging Protocol for the Knee. Osteoarthr Cartilage. 2008;16:1433–1441. doi: 10.1016/j.joca.2008.06.016. [DOI] [PMC free article] [PubMed] [Google Scholar]
- 27.DJH, Niu J, Zhang Y, Totterman S, Tamez J, Dabrowski C, Davies R, Hellio Le Graverand M, Luchi M, Tymofyeyev Y, Beals CR. Change in Cartilage Morphometry: A Sample of the Progression Cohort of the Osteoarthritis Initiative. Ann Rheum Dis. 2009;68:349–356. doi: 10.1136/ard.2007.082107. [DOI] [PMC free article] [PubMed] [Google Scholar]
- 28.Bruder H, Fischer H, Graumann R, Deimling M. A New Steady-State Imaging Sequence for Simultaneous Acquisition of Two MR Images with Clearly Different Contrasts. Magn Reson Med. 1988;7:35–42. doi: 10.1002/mrm.1910070105. [DOI] [PubMed] [Google Scholar]
- 29.Redpath TW, Jones RA. FADE - A New Fast Imaging Sequence. Magn Reson Med. 1988;6:224–234. doi: 10.1002/mrm.1910060211. [DOI] [PubMed] [Google Scholar]
- 30.Oppelt A, Graumann R, Barfuss H, Fischer H, Hartl W, Shajor W. FISP: A New Fast MRI Sequence. Electromedica. 1986;54:15–18. [Google Scholar]
- 31.Scheffler K. A Pictorial Description of Steady-States in Rapid Magnetic Resonance Imaging. Concepts Magn Reson. 1999;11:291–304. [Google Scholar]
- 32.Xia Y, Farquhar T, Burton-Wurster N, Ray E, Jelinski LW. Diffusion and Relaxation Mapping of Cartilage-Bone Plugs and Excised Discs Using Microscopic Magnetic Resonance Imaging. Magn Reson Med. 1994;31:273–282. doi: 10.1002/mrm.1910310306. [DOI] [PubMed] [Google Scholar]
- 33.Hardy PA, Recht MP, Piraino D, Thomasson D. Optimization of a Dual Echo in the Steady State (DESS) Free-Precession Sequence for Imaging Cartilage. J Magn Reson Imaging. 1996;6:329–336. doi: 10.1002/jmri.1880060212. [DOI] [PubMed] [Google Scholar]
- 34.Hennig J, Nauerth A, Friedburg H. RARE Imaging: A Fast Imaging Method for Clinical MR. Magn Reson Med. 1986;3:823–833. doi: 10.1002/mrm.1910030602. [DOI] [PubMed] [Google Scholar]
- 35.Freed DE, Scheven UM, Zielinski LJ, Sen PN, Hürlimann MD. Steady-State Free Precession Experiments and Exact Treatment of Diffusion in a Uniform Gradient. J Chem Phys. 2001;115:4249–4258. [Google Scholar]
- 36.Bieri O, Ganter C, Scheffler K. On the Accuracy of Diffusion Models for Fast Low- Angle Short-TR SSFP-Echo (FLASH-DW SSFP). Proceedings of the 18th Annual Meeting of ISMRM; Stockholm, Sweeden. 2010; p. 1631. [Google Scholar]
- 37.Weigel M, Schwenk S, Kiselev VG, Scheffler K, Hennig J. Extended Phase Graphs with Anisotropic Diffusion. J Magn Reson. 2010;205:276–285. doi: 10.1016/j.jmr.2010.05.011. [DOI] [PubMed] [Google Scholar]
- 38.McNab JA, Miller KL. Sensitivity of Diffusion Weighted Steady State Free Precession to Anisotropic Diffusion. Magn Reson Med. 2008;60:405–413. doi: 10.1002/mrm.21668. [DOI] [PubMed] [Google Scholar]
- 39.Basser PJ, Mattiello J, LeBihan D. Estimation of the Effective Self-Diffusion Tensor from the NMR Spin Echo. J Magn Reson B. 1994;103:247–254. doi: 10.1006/jmrb.1994.1037. [DOI] [PubMed] [Google Scholar]
- 40.Insko E, Bolinger L. Mapping of the Radiofrequency Field. J Magn Reson. 1993;103:82–85. [Google Scholar]
- 41.Yarnykh VL. Actual Flip-Angle Imaging in the Pulsed Steady State: A Method for Rapid Three-Dimensional Mapping of the Transmitted Radiofrequency Field. Magn Reson Med. 2007;57:192–200. doi: 10.1002/mrm.21120. [DOI] [PubMed] [Google Scholar]
- 42.Morrell GR. A Phase-Sensitive Method of Flip Angle Mapping. Magn Reson Med. 2008;60:889–894. doi: 10.1002/mrm.21729. [DOI] [PubMed] [Google Scholar]
- 43.Sacolick LI, Wiesinger F, Hancu I, Vogel MW. B1 Mapping by Bloch-Siegert Shift. Magn Reson Med. 2010;63:1315–1322. doi: 10.1002/mrm.22357. [DOI] [PMC free article] [PubMed] [Google Scholar]


