

Abstract
Collagen type I fibrils are the major building blocks of connective tissues. Collagen fibrils are anisotropic supra-molecular structures, and their orientation can be revealed by polarized light microscopy and vibrational microspectroscopy. We hypothesized that the anisotropy of chemical bonds in the collagen molecules, and hence their orientation, might also be detected by X-ray photoemission electron spectromicroscopy (X-PEEM) and X-ray absorption near-edge structure (XANES) spectroscopy, which use linearly polarized synchrotron light. To test this hypothesis, we analyzed sections of rat-tail tendon, composed of parallel arrays of collagen fibrils. The results clearly indicate that XANES-PEEM is sensitive to collagen fibril orientation and, more specifically, to the orientations of carbonyl and amide bonds in collagen molecules. These data suggest that XANES-PEEM is a promising technique for characterizing the chemical composition and structural organization at the nanoscale of collagen-based connective tissues, including tendons, cartilage, and bone.
Collagen type I, the most abundant protein in the body,1 is found primarily in connective tissues. Collagen fibrils are the major building blocks of both non-mineralized and mineralized connective tissues, and their morphology and organization determine the mechanical properties of these tissues.2,3 Collagen type I molecules consist of two α1 and 1 α2 poly-peptide chains that adopt polyproline type II left-handed helical conformations. These chains assemble into a right-handed triple-helix, which is 300 nm long and 1.5 nm in diameter.1,4 The polypeptide chains are made of trimeric motifs Gly-X-Y, with glycine (Gly) occupying every third position, while proline (Pro) and hydroxyproline (Hyp) have high propensities to occupy X and Y positions, respectively. The resulting macro-molecular structures are stabilized by hydrogen bonds and are extremely stable both mechanically and chemically.
Collagen molecules self-assemble into fibrils 50–200 nm in diameter and several micrometers in length. The collagen molecules are aligned along the fibril axis, with their C-termini oriented in the same direction. The adjacent collagen molecules are not in register, but staggered by approximately 67 nm. This results in the periodic 4-staggered organization of collagen fibrils with axial D-period of 67 nm.1 Hence, the fibril structure is periodic, anisotropic, and optically birefringent, which makes it possible to study the organization of collagenous tissues at the microscopic level using polarized light microscopy.5 Since the synchrotron beam is linearly polarized, synchrotron imaging and spectroscopy can provide new insights into the chemical and structural organization of collagenous tissues at the nanoscale,6,7 as well as into the interactions of collagen molecules with other macromolecules8,9 or mineral phases.10–12 XANES-PEEM combines imaging with spectroscopy with spatial resolution variable between 300 and 10 nm.6 Each pixel in a stack of XANES-PEEM images contains the full XANES spectrum, which is extremely sensitive to the architecture of chemical bonds, i.e., the bond orientation, length, and angle, and the short-range order. Furthermore, it does not require the sample to be crystalline; therefore it can be used for probing organic structures as well as organic–mineral interactions in mineralized tissues such as bones.6,11 XANES spectroscopy is sensitive to molecular structure and orientation,13,14 as shown in a variety of systems including magnetic materials,15–18 organic molecules,19 molecular monolayers,14 liquid crystals,20 and biominerals.12,21–23
To use XANES-PEEM for chemical imaging at the nanoscale, it is important to understand how different chemical/physical/orientational properties of a protein affect the resulting spectra in a well-defined model system before analyzing more complex systems. For this purpose, in this study we examined the carbon K-edge spectra of well-aligned collagen fibrils in rat-tail tendon (RTT) in two different orientations to determine if XANES-PEEM is sensitive to the orientation of collagen fibrils.
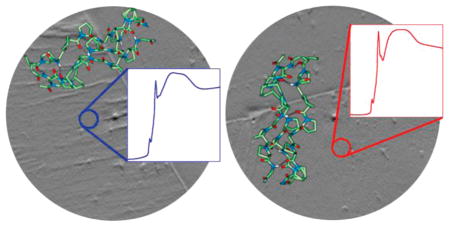
XANES-PEEM of RTT sections provides a unique opportunity to observe the structural anisotropy of collagen molecules, since in this tissue the fibrils and hence the collagen molecules are co-oriented. The XANES-PEEM analysis of RTT sections was carried out in two different orientations, approximately perpendicular to each other, as shown in Figure 1. In orientation 1 (Figure 1A) the fibril axis is approximately orthogonal to the linear polarization vector, whereas in orientation 2 (Figure 1B) the axis is nearly parallel to the polarization vector. Three areas with no obvious crimping of collagen fibrils were selected for the analysis. Care was taken to select the same identical areas on the sample when extracting the XANES spectra from the two different orientations. Carbon K-edge XANES spectra of each area were extracted from the three areas, normalized, and peak-fitted. After normalization and background correction, the spectra in two different orientations were compared, as shown in Figure 2 and Table 1.
Figure 1.

X-PEEM images of the RTT section in two orthogonal orientations (A and B). The areas selected for analysis are outlined by red circles numbered 1–3. Note that exactly the same areas were selected in two orientations. The red arrows indicate the fiber axis direction, while the blue arrows indicate the direction of the illuminating X-ray linear polarization. The scale bar in the image is 20 μm. The molecular orientation of the collagen molecules for each orientation (A and B) is shown below the corresponding images in C and D.
Figure 2.

Carbon K-edge XANES spectra of rat-tail tendon in the two different orientations shown in Figure 1. In all plots XANES experimental data points are shown as red dots, and the best-fit curve is represented by a continuous blue line, closely overlapping the data points. (A–C) Experimental data and fit results for the spectra extracted from the 3 areas shown in Figure 1A, in which the collagen fiber axis orientation is approximately perpendicular to the polarization. (D–F) Data and fit results acquired from the same 3 areas, after rotating the sample by approximately 90°, as shown in Figure 1B. See Methods section for peak fitting details. For clarity, the data, the fit, and the arctangents are shifted up, while the polynomial and the residue are shifted down along the vertical axis.
Table 1.
Average Peak Positions, Intensities, and FWHM Values for Carbon K-edge XANES Spectra from All Analyzed Areas for Each of the Three Collagen Samples Studieda
| RTT orientation 1 (SD) | RTT orientation 2 (SD) | peak assignment ref (position, eV) | |
|---|---|---|---|
| Peak 1 | C=C π* 11 (285.0 eV) | ||
| position (eV) | 285.64 (0.02) | 285.57 (0.01) | |
| intensity (arb u) | 0.16 (0.00) | 0.15 (0.01) | |
| fwhm (eV) | 0.71 (0.02) | 0.67 (0.07) | |
| Peak 2 | C–H σ* 11 (287.2 eV) | ||
| position (eV) | 288.15 (0.02) | 288.16 (0.02) | |
| intensity (arb u) | 0.48 (0.02) | 0.47 (0.01) | |
| fwhm (eV) | 3.11 (0.07) | 2.82 (0.03) | |
| Peak 3 | C=O π* backbone carbonyl 11,27,26 (288.3–288.6 eV) | ||
| position (eV) | 288.60 (0.01) | 288.63 (0.01) | |
| intensity (arb u) | 0.51 (0.02) | 0.60 (0.03) | |
| fwhm (eV) | 0.91 (0.01) | 0.85 (0.02) | |
| Peak 4 | C-NH σ* amide 26 (289.4 eV) | ||
| position (eV) | 289.86 (0.01) | 289.79 (0.02) | |
| intensity (arb u) | 0.48 (0.01) | 0.51 (0.01) | |
| fwhm (eV) | 1.78 (0.04) | 1.69 (0.02) | |
| Peak 5 | C–C σ* 26 (294.3 eV) | ||
| position (eV) | 293.84 (0.01) | 293.92 (0.15) | |
| intensity (arb u) | 0.28 (0.00) | 0.18 (0.05) | |
| fwhm (eV) | 5.24 (0.04) | 5.28 (1.11) | |
| Peak 6 | C–C σ* 26 (297.0 eV) | ||
| position (eV) | 297.64 (0.02) | 297.74 (0.19) | |
| intensity (arb u) | 0.10 (0.00) | 0.08 (0.01) | |
| fwhm (eV) | 4.05 (0.02) | 3.42 (0.38) | |
| Peak 7 | C=O σ* carbonyl 11,26 (302.0 eV) | ||
| position (eV) | 301.21 (0.00) | 301.38 (0.04) | |
| intensity (arb u) | 0.29 (0.00) | 0.16 (0.01) | |
| fwhm (eV) | 8.97 (0.12) | 6.27 (0.13) | |
| Peak 8 | |||
| position (eV) | 304.10 (0.02) | 304.38 (0.13) | |
| intensity (arb u) | 0.06 (0.00) | 0.04 (0.00) | |
| fwhm (eV) | 1.67 (0.16) | 3.75 (0.61) |
In XANES spectroscopy of molecules, absorption resonances lead to peaks in the spectra due to transitions from the ground state of the electron in the atomic core level to unoccupied molecular orbitals. These final states have characteristics determined by the bonding interactions of the absorbing atom with its neighbors but are excited states due to the presence of the hole in the core level. Despite the fact that XANES spectroscopy does not probe the ground state, detailed studies including experimental XANES spectroscopy and ab initio calculations have proven that this spectroscopy is a powerful probe of molecular electronic and geometric structures.7,13 To a good approximation, the electronic states involved in XANES transitions can be described using the formalism of molecular orbital theory, and resonances with characteristic energy positions are frequently observed to be associated with specific bonds in functional groups. For instance, in the carbonyl (C=O) group, the carbon 1s electron is excited to the unoccupied, antibonding π orbital of the C=O. The unoccupied, or antibonding, nature of this excited state is symbolized by an asterisk, and hence the sharp resonance above 288 eV is described as the C 1s→π*C=O transition. For brevity, hereafter we refer to each resonance as “peak” and state that it is “associated with” specific bonds, rather than repeating the long, accurate description given above.
In Figure 2 and Table 1 the most obvious change upon rotation affected the major peak at ~288.6 eV (peak 3), associated with the carbonyl group (C=O) resonance along the main chain of the polypeptides, which had significantly lower intensity in orientation 1 than 2. Peak intensity, averaged over the three areas was 0.51 in position 1 and 0.60 in position 2 (Figure 2, Table 1). Numerical analysis of this effect was done by peak fitting the XANES spectra. Seven distinct peaks associated with different bonds in the protein structure were identified in all of the spectra and assigned according to previous literature on single amino acids and simple peptides,11,24–27 as well as several proteins28 and biomineral-associated peptides.10 For all peaks, the energy position, assignment to specific bonds, intensity, and full width at half-maximum (fwhm) are summarized in Table 1. We were not able to assign peak 8 (Table 1) to any protein group; however, this small but distinct high-energy peak appears in all of the spectra in orientation 1 (Figure 2), and hence we include it in our peak fitting procedure.
The position of the peaks in a XANES spectrum is related to the energy of the corresponding bonds. Since the spectroscopic data were acquired from the same areas of the RTT section and the only difference was the rotation of the sample in the plane of the section, one would expect the peak positions to be the same between the two orientations. However, four peaks showed statistically significant shifts upon rotation. Peaks 1 and 4 were both shifted to lower energy by ~0.07 eV upon rotation (p = 0.0075 and 0.0032, respectively), whereas peak 3 and peak 7 were shifted to higher energy by ~0.03 eV (p = 0.0161) and ~0.17 eV (p = 0.0010), respectively (Table 1, Supplementary Table 1).
Most interestingly, the analysis of the data revealed significant variations in the intensities and fwhm of individual peaks in different orientations. The most significant difference between the two orientations is the change in intensity for peak 3 (~288.6 eV) and peak 5 (~293.9 eV), which correspond to backbone carbonyl C=O π* and C–C σ*, respectively11,26 (Table 1; Supplementary Table 1). Upon rotation, the intensity of peak 3 increased significantly from 0.51 to 0.60 (p = 0.0158), while the average intensity for peak 5 decreased from 0.28 to 0.18 (p = 0.0233) (Supplementary Table 2). This change in peak intensity is attributed to X-ray linear dichroism.14,20,29 In collagen molecules the backbone carbonyl bonds (peak 3) are approximately normal to the fibril axis, while the C–C bonds (peak 5) form angles of ~30° with the fibril axes. Since the long axes of collagen fibrils are in the plane of the sections, when the polarization is perpendicular to the fibril axis (position 1), it is parallel to the p orbitals in the backbone carbonyls (Figure 1). This might explain why the changes in peak 3 and peak 5 intensities are anti-correlated in the two orientations studied, and why the C=O peak 3 intensity is higher when the polarization is orthogonal to the fibril axis. Furthermore, peak 7 at ~304.1 eV, associated with C=O σ*, exhibits significant changes in intensity between the two orientations. Interestingly, these changes in the intensity of peak 7 are also anti-correlated with peak 3 (C=O π*) changes. Specifically, while in orientation 1 the intensity of peak 3 is lower than in orientation 2, the peak 7 intensity is more than 50% higher in orientation 1 than in orientation 2, 0.29 and 0.16, respectively (Figure 1, Table 1, Supplementary Tables 1 and 2). This anti-correlation is expected since the σ orbital is in-plane with the C=O bond axis, while the π orbital is perpendicular to the plane. All data were acquired with minimal doses and were thus not affected by radiation damage (see Supporting Information for dose calculations). The present results, therefore, demonstrate that XANES is extremely sensitive to the structural anisotropy and orientation of collagen molecules. Since the spatial resolution of advanced XANES-PEEM microscopes is on the order of tens of nanometers,6 orders of magnitude higher than in FTIR and Raman spectromicroscopies, this sensitivity may be usefully employed for chemical and structural studies of connective tissues at the nanoscale.
This study demonstrates for the first time that XANES-PEEM is sensitive to structural organization of supramolecular protein assemblies, using arrays of collagen fibrils as a model system with known orientation. The data presented validate and inspire future experiments on other more complex collagen assemblies, mineralized or not, in which the collagen orientation is not known at the nanoscale and will be revealed by XANES-PEEM. This unique capability may prove valuable in the study of healthy and diseased bone.
METHODS
Rat-Tail Tendon (RTT) Sample Preparation
RTTs consisting of parallel arrays of collagen fibrils provide the perfect model system for investigating the effect of collagen orientation on XANES spectra. Rat tails were collected from 2- to 3-month-old Wistar rats. The tendons were dissected from the tails and washed in cold PBS before they were cut into smaller pieces, each approximately 3–5 mm long. These smaller portions were fixed by immersing in 3.7% formalin at 4 °C overnight. The fixed samples were dehydrated with a series of alcohol and xylene washes before being embedded in destabilized Technovit 9100 New resin at −4 °C. The embedded tendon samples were microtomed in the plane of the fibrils onto 70% ethanol and mounted on clean silicon wafers. Once the sections were mounted on the silicon wafers, the resin was removed by washing the samples with xylene (2 × 20 min), followed by a 2-methoxyethylacetate (2-MEA) wash (20 min), two pure acetone washes (5 min each), and two distilled water washes (2 min each). The resulting samples were blotted against filter paper to remove excess water, deposited on silicon wafers, and left to air-dry. The collagen orientation in the sections was examined by polarized light microscopy prior to the X-PEEM experiments.
XANES-PEEM Spectromicroscopy
XANES-PEEM spectromi-croscopy data were acquired using the SPHINX spectromicroscope installed on the High-Energy Resolution MONochromator (HER-MON) beamline at the Synchrotron Radiation Center (SRC, University of Wisconsin, Madison, WI).6,11 The HERMON beamline is optimized for low flux density and high resolution, and hence the energy resolution for all spectra presented here is better than 0.04 eV, as tested on gas-phase samples. The low flux density minimizes the doses necessary to acquire carbon spectra but has the disadvantage of preventing high spatial resolution in X-PEEM images. The samples were coated with 1 nm Pt and transferred into the ultrahigh vacuum chamber of the microscope. The samples were illuminated with photon energies between 270 and 325 eV for C K-edge spectroscopy. Stacks of images with field of view 180 μm were acquired while scanning the photon energy between 270 and 325 eV, and XANES spectra were extracted from selected regions of interest. Because the polarization of the illuminating X-rays cannot be rotated on the HERMON beamline, the sample was rotated 90° after the first set of data collection, and the measurement was repeated. The exposure times and the radiation doses were kept low and never exceeded 1.1 MGy per spectrum, and thus even with repeated acquisitions, we remained well below the critical dose for radiation damage to proteins of 280 MGy.30 See Supporting Information for the dose calculation details.
Data Analysis
The XANES C K-edge spectra were analyzed using Igor Pro 6.1 (WaveMetric, Lake Oswego, OR) as previously described.11 Briefly, the background spectrum from the clean silicon wafer was first subtracted from the C K-edge XANES data. The spectra were then shifted with respect to the background so that the main carbon dip of the background was positioned at 284.57 eV. The energy calibration of the beamline was done using gas-phase CO2. The CO2 spectra have two sharp resonances at 292.74 and 294.96 eV, which are used for calibration, but they also always contain two carbon dips originating from the carbon contamination on mirrors and gratings along the beamline. The main dip has its minimum at 284.57 eV, occurring at a constant energy distance from the CO2 absorption resonances. This is a very useful feature, as it provides accurate calibration of all spectra, including those from proteins. By shifting all spectra presented here so the minima are at 284.57 eV, we achieved accurate and simultaneous energy calibration of each spectrum. Due to this accurate energy calibration of each spectrum, the energy position of each resonance peak has an uncertainty on the order of 0.01 eV. The spectra were then normalized to a linear postedge fit above 289 eV, so the intensity of the postedge is 1, and that of the pre-edge is 0. Peak fitting of the spectra was carried out using 8 Gaussian Gain curves, labeled peaks 1–8 in different colors in Figure 2. Three arct-angents centered at 290.6 eV, 292.3 and 295.1 eV, as indicated by dashed gray lines in Figure 2, were used to represent the ionization thresholds of C–C, Cα and C=O, respectively. A second order polynomial, indicated by the smooth gray line, was used for baseline correction. The noisy gray line in Figure 2 is the residue, that is, the difference between the fit and the experimental data. Notice that the residue contains only noise and no spectral features, indicating the good quality of the fit.
Supplementary Material
Acknowledgments
This work was supported by NIH/NIDCR award DE-016703 to E.B., DOE award DE-FG02-07ER15899, NSF awards CHE-0613972 and DMR-1105167, and UW-Hamel Award to P.U.P.A.G. The X-PEEM experiments were performed at the Wisconsin SRC, supported by NSF grant DMR-0537588.
Footnotes
This material is available free of charge via the Internet at http://pubs.acs.org.
References
- 1.Kadler KE, Holmes DF, Trotter JA, Chapman JA. Collagen fibril formation. Biochem J. 1996;316:1–11. doi: 10.1042/bj3160001. [DOI] [PMC free article] [PubMed] [Google Scholar]
- 2.Weiner S, Wagner HD. The material bone: Structure mechanical function relations. Annu Rev Mater Sci. 1998;28:271–298. [Google Scholar]
- 3.Fratzl P, Misof K, Zizak I, Rapp G, Amenitsch H, Bernstorff S. Fibrillar structure and mechanical properties of collagen. J Struct Biol. 1998;122:119–122. doi: 10.1006/jsbi.1998.3966. [DOI] [PubMed] [Google Scholar]
- 4.Brodsky B, Ramshaw JAM. The collagen triple-helix structure. Matrix Biol. 1997;15:545–554. doi: 10.1016/s0945-053x(97)90030-5. [DOI] [PubMed] [Google Scholar]
- 5.Giraud-Guille M-M, Besseau L, Martin R. Liquid crystalline assemblies of collagen in bone and in vitro systems. J Biomech. 2003;36:1571–1579. doi: 10.1016/s0021-9290(03)00134-9. [DOI] [PubMed] [Google Scholar]
- 6.Frazer BH, Girasole M, Wiese LM, Franz T, De Stasio G. Spectromicro scope for the photoelectron imaging of nanostructures with X-rays (SPHINX): performance in biology, medicine and geology. Ultramicroscopy. 2004;99:87–94. doi: 10.1016/j.ultramic.2003.10.001. [DOI] [PubMed] [Google Scholar]
- 7.Hitchcock AP, Morin C, Zhang X, Araki T, Dynes J, Stöver H, Brash J, Lawrence JR, Leppard GG. Soft X-ray spectromicroscopy of biological and synthetic polymer systems. J Electron Spectrosc Relat Phenom. 2005;144–147:259–269. [Google Scholar]
- 8.Leung BO, Hitchcock AP, Cornelius R, Brash JL, Scholl A, Doran A. X-ray spectromicroscopy study of protein adsorption to a polystyrene-polylactide blend. Biomacromolecules. 2009;10:1838–1845. doi: 10.1021/bm900264w. [DOI] [PubMed] [Google Scholar]
- 9.Morin C, Hitchcock AR, Cornelius RM, Brash JL, Urquhart SG, Scholl A, Doran A. Selective adsorption of protein on polymer surfaces studied by soft X-ray photoemission electron microscopy. J Electron Spectrosc Relat Phenom. 2004;137:785–794. [Google Scholar]
- 10.Metzler RA, Evans JS, Killian CE, Zhou D, Churchill TH, Appathurai NP, Coppersmith SN, Gilbert P. Nacre protein fragment templates lamellar aragonite growth. J Am Chem Soc. 2010;132:6329–6334. doi: 10.1021/ja909735y. [DOI] [PubMed] [Google Scholar]
- 11.Metzler RA, Kim IW, Delak K, Evans JS, Zhou D, Beniash E, Wilt F, Abrecht M, Chiou JW, Guo JH, Coppersmith SN, Gilbert P. Probing the organic-mineral interface at the molecular level in model biominerals. Langmuir. 2008;24:2680–2687. doi: 10.1021/la7031237. [DOI] [PubMed] [Google Scholar]
- 12.Beniash E, Metzler RA, Lam RSK, Gilbert P. Transient amorphous calcium phosphate in forming enamel. J Struct Biol. 2009;166:133–143. doi: 10.1016/j.jsb.2009.02.001. [DOI] [PMC free article] [PubMed] [Google Scholar]
- 13.Stohr J. NEXAFS Spectroscopy. Springer-Verlag; Berlin: 1992. pp. 276–291. [Google Scholar]
- 14.Stohr J, Baberschke K, Jaeger R, Treichler R, Brennan S. Orientation of chemisorbed molecules from surface-absorption fine-structure measurements: CO and NO on Ni(100) Phys Rev Lett. 1981;47:381–384. [Google Scholar]
- 15.Holcomb MB, Martin LW, Scholl A, He Q, Yu P, Yang CH, Yang SY, Glans PA, Valvidares M, Huijben M, Kortright JB, Guo J, Chu YH, Ramesh R. Probing the evolution of antiferromagnetism in multiferroics. Phys Rev B. 2010;81:134406. [Google Scholar]
- 16.Lüning J, Nolting F, Scholl A, Ohldag H, Seo JW, Fompeyrine J, Locquet JP, Stöhr J. Determination of the antiferromagnetic spin axis in epitaxial LaFeO3 films by x-ray magnetic linear dichroism spectroscopy. Phys Rev B. 2003;67:214433. [Google Scholar]
- 17.Scholl A, Stohr J, Luning J, Seo JW, Fompeyrine J, Siegwart H, Locquet JP, Nolting F, Anders S, Fullerton EE, Scheinfein MR, Padmore HA. Observation of antiferromagnetic domains in epitaxial thin films. Science. 2000;287:1014–1016. doi: 10.1126/science.287.5455.1014. [DOI] [PubMed] [Google Scholar]
- 18.Stohr J, Scholl A, Regan TJ, Anders S, Luning J, Scheinfein MR, Padmore HA, White RL. Images of the antiferromagnetic structure of a NiO(100) surface by means of X-ray magnetic linear dichroism spectromicroscopy. Phys Rev Lett. 1999;83:1862–1865. [Google Scholar]
- 19.Ade H, Hsiao B. X-ray linear dichroism microscopy. Science. 1993;262:1427–1429. doi: 10.1126/science.262.5138.1427. [DOI] [PubMed] [Google Scholar]
- 20.Stohr J, Samant MG, Luning J, Callegari AC, Chaudhari P, Doyle JP, Lacey JA, Lien SA, Purushothaman S, Speidell JL. Liquid crystal alignment on carbonaceous surfaces with orientational order. Science. 2001;292:2299–2302. doi: 10.1126/science.1059866. [DOI] [PubMed] [Google Scholar]
- 21.Gilbert PUPA, Metzler RA, Zhou D, Scholl A, Doran A, Young A, Kunz M, Tamura N, Coppersmith SN. Gradual ordering in red abalone nacre. J Am Chem Soc. 2008;130:17519–17527. doi: 10.1021/ja8065495. [DOI] [PubMed] [Google Scholar]
- 22.Killian CE, Metzler RA, Gong YT, Olson IC, Aizenberg J, Politi Y, Addadi L, Weiner S, Wilt FH, Scholl A, Young A, Coppersmith SN, Gilbert PUPA. The mechanism of calcite co-orientation in the sea urchin tooth. J Am Chem Soc. 2009;131:18404–18409. doi: 10.1021/ja907063z. [DOI] [PubMed] [Google Scholar]
- 23.Metzler RA, Abrecht M, Olabisi RM, Ariosa D, Johnson CJ, Frazer BH, Coppersmith SN, Gilbert PUPA. Architecture of columnar nacre, and implications for its formation mechanism. Phys Rev Lett. 2007;98:268102. doi: 10.1103/PhysRevLett.98.268102. [DOI] [PubMed] [Google Scholar]
- 24.Boese J, Osanna A, Jacobsen C, Kirz J. Carbon edge XANES spectroscopy of amino acids and peptides. J Electron Spectrosc Relat Phenom. 1997;85:9–15. [Google Scholar]
- 25.Gordon ML, Cooper G, Morin C, Araki T, Turci CC, Kaznatcheev K, Hitchcock AP. Inner-shell excitation spectroscopy of the peptide bond: Comparison of the C 1s, N 1s, and O 1s spectra of glycine, glycyl-glycine, and glycyl-glycyl-glycine. J Phys Chem A. 2003;107:6144–6159. [Google Scholar]
- 26.Kaznacheyev K, Osanna A, Jacobsen C, Plashkevych O, Vahtras O, Agren H. Innershell absorption Spectroscopy of amino acids. J Phys Chem A. 2002;106:3153–3168. [Google Scholar]
- 27.Zubavichus Y, Shaporenko A, Grunze M, Zharnikov M. Innershell absorption spectroscopy of amino acids at all relevant absorption edges. J Phys Chem A. 2005;109:6998–7000. doi: 10.1021/jp0535846. [DOI] [PubMed] [Google Scholar]
- 28.Zubavichus Y, Shaporenko A, Grunze M, Zharnikov M. Is X-ray absorption spectroscopy sensitive to the amino acid composition of functional proteins? J Phys Chem B. 2008;112:4478–4480. doi: 10.1021/jp801248n. [DOI] [PubMed] [Google Scholar]
- 29.DelRio FW, Jaye C, Fischer DA, Cook RF. Elastic and adhesive properties of alkanethiol self-assembled monolayers on gold. Appl Phys Lett. 2009;94 doi: 10.1063/1.3111440. [DOI] [Google Scholar]
- 30.Wang J, Morin C, Li L, Hitchcock AP, Scholl A, Doran A. Radiation damage in soft X-ray microscopy. J Electron Spectrosc Relat Phenom. 2009;170:25–36. [Google Scholar]
Associated Data
This section collects any data citations, data availability statements, or supplementary materials included in this article.