

Abstract
Background
Lenalidomide is a thalidomide analogue that may serve as an adjunctive therapy for treatment refractory cutaneous lupus erythematosus (CLE).
Objectives
We evaluate the use of lenalidomide in CLE and describe the skin and circulating leukocyte profile of treatment refractory patients before and after treatment.
Patients/Methods
Five subjects were treated with lenalidomide in an unblinded open-label study. Immunohistochemistry of skin was performed for T-cell markers, glycosaminoglycans and CXCL10, an interferon (IFN)-inducible chemokine, before and after treatment. Immunophenotyping and measurement of IFN-inducible genes from peripheral blood mononuclear cells was also performed before and after treatment.
Results
Four subjects demonstrated clinical improvement of their skin, however one of these responders subsequently developed symptoms of systemic lupus erythematosus. Small changes in rare circulating leukocyte subsets, plasmacytoid dendritic cells and regulatory T-cells, were observed with treatment and may correlate with clinical response. Treatment was associated with increased circulating HLA-DR expression and decreased markers of IFN-mediated pathways, regardless of clinical response.
Limitations
Our results are limited by small sample size and the measurement of rare populations of circulating cell subsets.
Conclusions
Lenalidomide may have utility as therapy for severe, treatment refractory CLE. However, our preliminary data suggest that lenalidomide may activate T-cells and trigger systemic disease in some CLE patients. We also saw a unique histologic and circulating leukocyte phenotype in the nonresponding subject. Further characterization of the skin and circulating leukocyte profile of treatment refractory patients will improve our understanding of CLE.
Introduction
Approximately 10% of patients with cutaneous lupus erythematosus (CLE) are refractory to established therapies, including thalidomide1. CLE has been reported to have the same incidence as systemic lupus erythematosus (SLE), approximately 3 per 100,000, highlighting the need for improved therapies2. Lenalidomide, a thalidomide analogue with more potent T-cell, IL-2 and Interferon (IFN)-γ stimulating effects in vitro compared to thalidomide, is a potential alternative or adjunctive treatment for severe generalized discoid lupus erythematosus (DLE)3. It is an immunomodulatory drug shown to stimulate T-cells, natural killer (NK)-cells and anti-inflammatory cytokines and inhibit tumor necrosis factor alpha (TNF-α) production and angiogenesis4.
The current CLE pathogenesis model implicates IFN-inducible proteins and chemokines in the recruitment and activation of inflammatory cells in the skin5-8. Plasmacytoid dendritic cells (pDCs) accumulate in CLE skin and produce type I IFNs which may initiate the inflammatory cascade8-11. IFN-inducible chemokines, like CXCL9, CXCL10 and CXCL11, are highly expressed around lymphocytes in CLE lesions, supporting a potential role in cell recruitment5, 7, 8. The lymphocytic infiltrate also expresses cutaneous lymphocyte antigen (CLA), a skin-homing receptor 12. CLE lesions have increased glycosaminoglycans (GAG) content and are characterized by low numbers of regulatory T-cells (Tregs).13
There is evidence of B- and T-cell activation in the peripheral blood of patients with DLE and subacute cutaneous lupus erythematosus (SCLE)14-17. In DLE absolute circulating lymphocyte numbers are similar to healthy controls, but SCLE patients have decreased absolute circulating CD4+ and CD8+ T-cells18-20. No difference in circulating Treg counts have been seen in DLE, SCLE or tumid lupus erythematosus (TLE)13. Investigators have observed severe scarring DLE to have increased expression of circulating CCR4+ and CLA+ cells (skin-homing receptors) and decreased CXCR3+ expression, a chemokine receptor associated with IFN-signaling6, 21.
These circulating changes support the growing evidence of systemic alterations in the inflammatory cascade in CLE. Recently we found elevated IFN-inducible genes in blood from patients with DLE and SCLE22. A polymorphism in Interferon regulatory factor 5 (IRF5) in DLE and SCLE has been described23. Additionally, mutations in TREX1, a DNA exonuclease implicated in SLE and Aicardi-Goutieres syndrome, have been reported in a familial form of chilblain lupus, suggesting a shared pathogenesis between these conditions manifesting with elevated serum IFN-α24, 25.
Here we investigate the use of lenalidomide in five patients with CLE. We examined histology, circulating leukocyte subsets and markers of IFN-mediated signaling, in the skin and blood, before and after treatment to better characterize the pathophysiology of this refractory patient subset and gain insight into the mechanism of action of lenalidomide. We also describe one patient who developed SLE during lenalidomide therapy.
Materials and methods
Patients
Five patients were enrolled according to the following inclusion criteria: 1) DLE or SCLE diagnosis, 2) no response to 3 months of hydroxychloroquine and 3) participation in RevAssist®, a distribution program run by the manufacturers of lenalidomide26. Patients with SLE (by ACR criteria), who were pregnant, had thrombocytopenia, lymphopenia, neutropenia or a history of deep venous thrombosis or pulmonary embolism were excluded. Informed consent was obtained. Subjects received 5 mg oral lenalidomide daily during the first six weeks of treatment. Patients were maintained on all baseline medications. The study protocol was approved by the University of Pennsylvania Institutional Review Board.
Skin biopsy collection
A punch biopsy of lesional skin was taken at weeks 0, 2, and 6 of treatment. A biopsy of non-lesional skin was taken at week 0. Half of each biopsy was fixed in formalin and the other half frozen in liquid nitrogen. Week 2 biopsies were refused by subjects 4 and 5.
Assessment of clinical disease activity
Disease activity was assessed using the CLASI (cutaneous lupus area and severity index) activity score27, 28. A partial response reflects a four-point decrease in CLASI activity score (Klein et al. in press). VPW or MR performed all CLASI scoring.
Immunohistochemical staining
Immunohistochemical (IHC) staining was performed on formalin-fixed, paraffin-embedded skin biopsy samples using: monoclonal mouse anti-CD3 (Novacastra, Clone PS1, Newcastle upon Tyne, UK), anti-CD4 (Novacastra, Clone IF6), anti-CD8 (Dako, Clone C8/144B, Glostrup, Denmark), rat anti-CLA (BD Pharmingen, Clone HECA-452, San Jose, California), and polyclonal goat anti-CXCL10/IP-10, (interferon-γ inducible protein ten) (R&D Systems, Minneapolis, MN). Isotype control reactions were performed with mouse IgG1 (Sigma, Clone MOPC 21, St. Louis, MO) for CD4 and CD8, mouse IgG2a (Dako, Clone DAK-G05) for CD3, goat total IgG (R&D systems) for CXCL10, and rat IgM, K isotype (BD Pharmigen, Clone R4-22) for CLA. Indirect IHC staining was performed with Dako LSAB™ system, except for CLA where biotinylated mouse anti-rat IgM (IgG1) (BD Pharmigen, Clone G53-238) was the secondary antibody. Staining was visualized using NovoRed chromogen (Vector Labs, Burlingame, CA) or DAB chromogen (Dako). Hematoxylin and Eosin (H&E) and Hale’s stain were performed using established protocols29.
Immunohistochemical staining quantification
CXCL10 staining was quantified using ImagePro (MediaCybernetics, Bethesda, MD). Percent staining was calculated from six high-power-field (HPF) images (400x). CD3, CD4, CD8, and CLA staining was quantified using the cell counter plugin on ImageJ Software (NIH, Bethesda, MD).
Peripheral blood collection and flow cytometry
Peripheral blood cells were obtained at weeks 0, 2, and 6 of treatment. A complete blood count with differential and immunofluorescence was performed. Monoclonal antibodies were added directly to 150 μl aliquots of whole blood and incubated at room temperature for 20 minutes. Red blood cells were lysed with ammonium chloride lysing buffer (BD Pharm Lyse). Remaining mononuclear cells were washed using wash buffer (Dulbecco’s PBS with 5% fetal calf serum and sodium azide). Cells were fixed in 1% paraformaldehyde (Electron Microscopy Sciences, Hatfield, PA).
The following antibodies were used: FITC-HLA-DR (clone L243), FITC-CLA (clone HECA-452), PE-CD123 (clone 9F5), PE-CD127 (clone hIL-7R-M21), PerCP-CD4 (clone SK3), APC-HLA-DR (clone L243), APC-CD25 (clone M-A251), APC-CD27 (clone L128), PE-Cy5-CD40 (clone 5C3), and PE-Cy7-CD19 (clone SJ25C1) (all BD Pharmigen). APC-Cy5.5 -CD38 (clone HIT2), APC-Alexa Fluor 750-CD3 (clone S4), PE-TR-CD4 (clone S3.5), and PE-Cy5.5-CD5 (clone 5D7) (all Caltag/Invitrogen, Carlsbad, CA). Alexa Fluor 700 -CD33 (clone WM-53) and PE-Cy7-CD11c (clone 2.9) (eBioscience, San Diego, CA). Dead cell exclusion was performed using the Live/Dead Fixable Violet Dead Cell Stain Kit (Invitrogen, Carlsbad, CA). The sample preparation, instrument operation and data analysis was performed by the same operator to control for inter-operator variability. Flow cytometry was performed on the same instrument (Becton Dickinson LSR2 Benchtop Flow Cytometer) to control for machine variability. Data was analyzed using v.8.2 Flow Jo software (Treestar Inc, Eugene, OR).
Type I IFN-inducible gene expression
Five IFN-inducible genes were studied: lymphocyte antigen 6 complex, locus E (LYGE), Hs00158942_m1; 2’,5’-oligoadenylate synthetase 1, 40/46 kd (OAS1), HS00242943_m1; 2’,5’-oligoadenylate synthetase-like (OASL), Hs00388714_m1; myxovirus resistance 1 (MX1), Hs00182073_m1 and interferon-α-inducible protein (clone IFI-15K) (ISG15), Hs00192713_m1 (Applied Biosystems, Foster City, CA). Total RNA was extracted from peripheral blood using RNA Later, Qiagen RNeasy Minikit and Qiashredder Minicolumns (Qiagen, Valencia, CA). Total RNA was reverse transcribed into complementary DNA (Invitrogen First-Strand cDNA Synthesis Kit). RNA was stored at -70°C and cDNA samples stored at -20°C. Gene expression was measured by real time PCR using ABI Prism 7000 sequence detection system and normalized to GAPDH (Taqman assay: Hs99999905_m1) using ABI Prism SDS 7000 software, version 1.0 (Applied Biosystems). Experiments were performed in triplicate in 25 μl of TaqMan Universal PCR Master Mix (Applied Biosystems). Samples were denatured for 2 minutes at 50°C then 10 minutes at 95°C, followed by 40 cycles at 95°C for 15 seconds and combined primer annealing and extension at 60°C for 1 minute. IFN scores were calculated using published methods30.
Statistical analysis
A Wilcoxon signed rank test was performed to evaluate changes in IFN score and IHC staining with treatment.
Results
We present the clinical response to lenalidomide in five subjects and describe the histologic features and circulating leukocyte profile before and after treatment. Expression levels of IFN-inducible genes in blood before and after treatment are shown as a measure of systemic IFN-mediated signaling.
Clinical Response
Age, sex, race/ethnicity, diagnosis and medications are listed for each subject (Table 1). Four subjects demonstrated satisfactory clinical improvement in their skin. The CLASI activity scores at weeks 0, 2 and 6 are shown for each patient. All subjects demonstrated at least a four-point drop from week 0 to 6, consistent with a partial response; however, four subjects had more pronounced changes, with a drop in CLASI activity score of at least 8 points and will be referred to as responders. Subject 2, a female with generalized DLE, had a five-point decrease in her CLASI score, however this was felt to be clinically unsatisfactory and she was withdrawn from the study at week 12. She will be referred to as the nonresponder. Among the responders were three females with DLE (subjects 1, 4 and 5) and one male with a mixed clinical phenotype of SCLE and TLE (subjects 3). Although subject 5 experienced improvement in her skin lesions, she developed new-onset proteinuria and an exacerbation of arthralgias at week 20 prompting withdrawal from the study.
Table 1.
Subject baseline characteristics and clinical outcome
| Subject | Age | Sex | Race/Ethnicity | Diagnosis | Medications | Clinical Outcome | CLASI activity score Week | ||
|---|---|---|---|---|---|---|---|---|---|
| 0 | 2 | 6 | |||||||
| 1 | 47 | F | White/Caucasian non-hispanic | Generalized DLE | Dapsone 25 mg twice daily | Partial response | 20 | 15 | 8 |
| 2 | 35 | F | White/Caucasian non-hispanic | Localized DLE, Hypertrophic LE | Quinacrine 100 daily | Partial response, but unsatisfactory clinical response. The patient was withdrawn at week 12 of the study. | 23 | 21 | 18 |
| Methotrexate 25 mg subcutaneously weekly | |||||||||
| Azathioprine 75 mg three times daily | |||||||||
| Chloroquine 250 mg daily | |||||||||
| 3 | 43 | M | White/Caucasian non-hispanic | SCLE/TLE | Partial response | 22 | 18 | 9 | |
| 4 | 37 | F | White/Caucasian non-hispanic | Localized DLE, SCLE | Prednisone 30 mg daily for weeks 1 and 2, then 20 mg daily for weeks 3-6. | Partial response | 16 | 15 | 8 |
| Mycophenylate Mofetil 500 mg twice daily | |||||||||
| Chloroquine 250 mg daily | |||||||||
| Quinacrine 100 mg daily | |||||||||
| 5 | 42 | F | White/Caucasian non-hispanic | Generalized DLE | Hydroxychloroquine 200 mg twice daily | Partial response | 26 | 18 | 11 |
| Quinacrine 100 mg daily | |||||||||
| Azathioprine 75 mg daily | |||||||||
F, female; M, male; DLE, discoid lupus erythematosus; LE, lupus erythematosus; SCLE, subacute cutaneous lupus erythematosus; and TLE, tumid lupus erythematosus.
A partial response is defined by a decrease in cutaneous lupus area and severity index (CLASI) activity score of four or more points.
Histologic features of severe treatment refractory CLE
Week 0 lesional biopsies showed features of CLE. H&E, CD3, CD4, CD8 and CLA IHC staining from a representative subject, subject 4,at week 0 are shown (Figure 1). Complete absolute counts for cell marker and CD4:CD8 and CLA:CD3 ratios are shown (Table 2). The inflammatory infiltrate was composed of predominantly CD3+ lymphocytes, in accordance with previous findings8-10. The CD3+ infiltrate had 15 - 66% CLA expression (mean ± SEM: 36 ± 8%). Three responders had CD8 predominance and two subjects had CD4 predominance, including the nonresponder and subject 1. GAG levels were high in all subjects at week 0. Representative images from two subjects are shown(Figure 2A and 2B).
Figure 1.
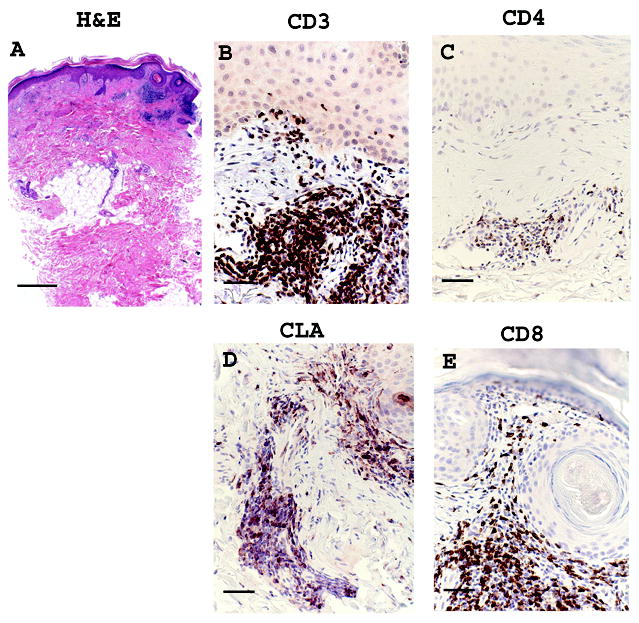
Representative images from a responding subject, subject 4, baseline (week 0) lesional skin. (a) Hematoxylin & Eosin (H&E) stain, (b) CD3 (c) CLA (d) CD4 (e) CD8. Scale bar = 500 μm for H&E, panel (A), and Scale bar = 100 μm for remaining stains, panels (B)-(E).
Table 2.
CD4: CD8 ratio and CLA:CD3 ratio at week 0 and week 6 in lesional skin
| Week 0 | Week 6 | |||||
|---|---|---|---|---|---|---|
| CD4 | CD8 | CD4:CD8 | CD4 | CD8 | CD4:CD8 | |
| Subject 1 | 286 | 139 | 2.1 | 31 | 26 | 1.2 |
| Subject 2 | 144 | 95 | 1.5 | 135 | 90 | 1.5 |
| Subject 3 | 11 | 25 | 0.4 | 28 | 135 | 0.2 |
| Subject 4 | 143 | 194 | 0.7 | 25 | 70 | 0.4 |
| Subject 5 | 40 | 175 | 0.2 | 8 | 28 | 0.3 |
| Average±SEM in all | 125±48 | 126±30 | 1±0.3 | 45±23 | 70±20 | 0.7±0.3 |
| Average±SEM in responders | 120±62 | 133±38 | 0.9±0.4 | 23±5 | 65±26 | 0.5±0.2 |
| CLA | CD3 | CLA:CD3 | CLA | CD3 | CLA:CD3 | |
| Subject 1 | 80 | 534 | 0.1 | 42 | 56 | 0.8 |
| Subject 2 | 100 | 271 | 0.4 | 130 | 319 | 0.4 |
| Subject 3 | 53 | 153 | 0.3 | 66 | 157 | 0.4 |
| Subject 4 | 252 | 875 | 0.3 | 51 | 87 | 0.6 |
| Subject 5 | 214 | 324 | 0.7 | 66 | 237 | 0.3 |
| Average±SEM in all | 140±39 | 431±127 | 0.4±0.1 | 71±15 | 171±48 | 0.5±0.1 |
| Average±SEM in responders | 150±49 | 472±155 | 0.4±0.1 | 56±6 | 134±40 | 0.5±0.1 |
Cells were counted manually using the cell counter plugin on ImageJ software. A high power field representing the area of greatest staining was counted. Similar high power fields from sequential sections were used at each timepoint.
CLA, cutaneous lymphocyte antigen; and SEM, standard error of measurement.
Figure 2.
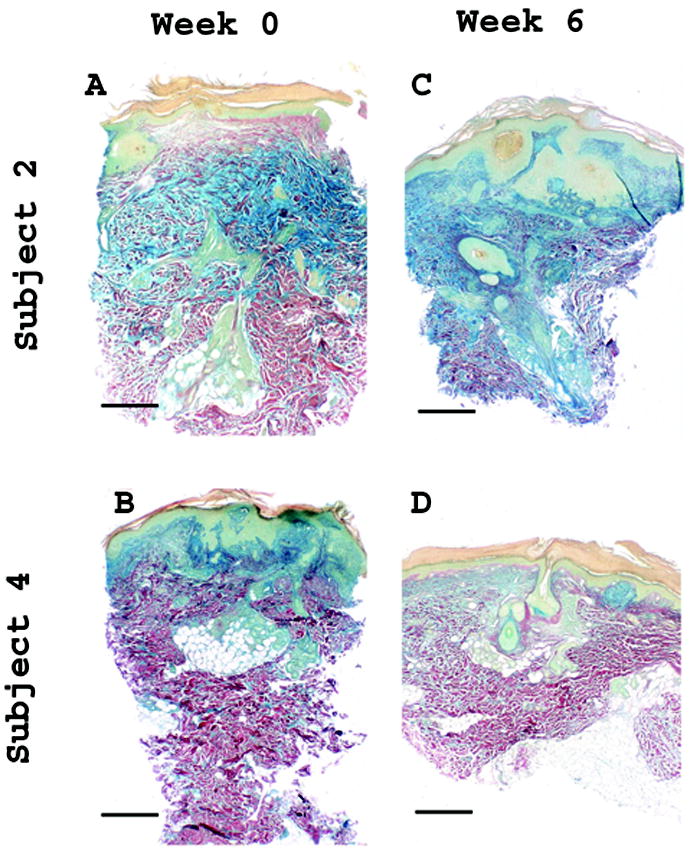
Decrease in Hale’s staining in responding subjects with DLE. Hale’s staining highlights glycosaminoglycan (GAG) content (blue). Images from subject 2, nonresponder, and subject 4, a responder with DLE, before and after treatment are shown. Subjects 1, 4 and 5 had similar decrease in GAG staining at week 6. Week 0, lesional: (A) subject 2, (B) subject 4; and Week 6, lesional: (C) subject 2, (D) subject 4. Scale bar = 500 μm.
CXCL10 expression was seen in lesional biopsies only and was most prominent in basal keratinocytes and around the inflammatory infiltrate. Representative images of week 0 CXCL10 staining in two subjects are shown (Figure 3A and 3E). There were areas of cytoplasmic speckling in basal keratinocytes and lymphocytes(Figure 3B and 3F).
Figure 3.
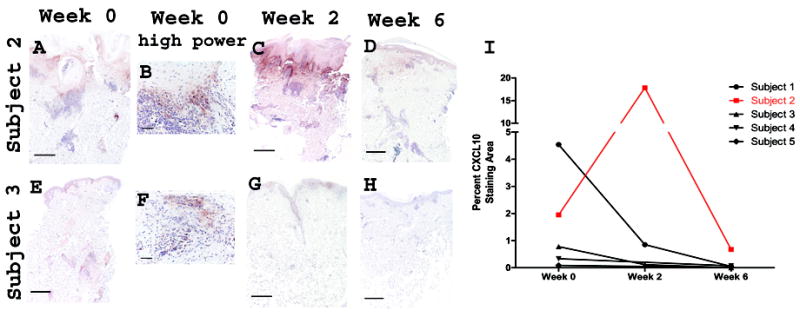
CXCL10 expression in lesional skin decreases in basal keratinocytes and around lymphocytes with lenalidomide treatment. Panels (a-h): Representative images of highest staining for subjects 2 and 3 are shown for lesional skin at week 0, week 2, and week 6. Subject 2: (A) week 0, (B) week 0 high power, (C) week 2, (D) week 6, Subject 3: (E) week 0, (F) week 0 high power, (G) week 2, and (H) week 6. Scale bar = 500 μm, except scale bar = 100 μM for high power. Panel (I) Graphic representation of the change in percent CXCL10 staining area with treatment.
Histologic findings after treatment with lenalidomide
A decrease in absolute numbers of CD3, CD4, CD8 and CLA cells was seen in from week 0 to 6, however the decrease did not reach statistical significance (Table 2). GAGs decreased with treatment in three responding subjects, all with DLE. Representative images are shown from subject 4 and the nonresponder who did not show a decrease in GAGs (Figure 2).
Decreased CXCL10 staining from week 0 to 6 was seen in all subjects, regardless of clinical response. Representative images from the nonresponder, and subject 3 are shown (Figures 3A-3H). Quantification of CXCL10 staining is graphed (Figure 3I). The nonresponder had markedly more CXCL10 staining than responders at week 0 followed by a peak at week 2 and subsequent decrease below week 0 levels at week 6.
Decreased IFN-inducible gene expression (IFN score), irrespective of clinical response
In three subjects with available data the IFN score decreased from week 0 to 2. Pre-lenalidomide scores (week 0) were 29.5 ± 1.4 (mean ± SEM) and post-lenalidomide scores (week 2) were 7.3 ± 2.4 (p=ns). In separate experiments we found a correlation between IFN score and CLASI activity score22. However in the setting of treatment with lenalidomide in this subject pool there was no correlation.
Changes in circulating lymphocyte subsets may correlate with clinical response
We examined the circulating leukocyte profile of the treatment refractory subjects and show baseline values in Table 3. The nonresponder had granulocytopenia and the highest levels of circulating CD4+ and CD8+ memory T-cells (CD45Ra-), CD19+ B-cells and activated CD4+ T-cells (HLA-DR+) at baseline. There was no clear change in circulating CD3+, CD4+, CD8+ or CLA+ T-cell percentages between week 0 and 6. Changes in rare cell subsets implicated in the pathogenesis of CLE appeared to trend with clinical response. Responders had a relative decrease in circulating pDCs compared to the nonresponder (Figure 4A). We also saw an increase in absolute frequencies of circulating Tregs in three responders (Figure 4B). Absolute frequencies of activated CD4+ T-cells increased in four subjects, including the nonresponder (Figure 4c).
Table 3.
Circulating leukocyte profile in severe, treatment refractory CLE
| WBC subsets (tho/μl) | ||||||||
|---|---|---|---|---|---|---|---|---|
| Lymphocytes Nl range (0.8-3.9) | Granulocytes Nl range (1.5-7.8) | Monocytes Nl range (0.2-.95) | ||||||
| Week 0 | Week 6 | Week 0 | Week 6 | Week 0 | Week 6 | |||
| subject 1 | 1.6 | 1.6 | 5.9 | 5.7 | 0.4 | 0.4 | ||
| subject 2 | 2.2 | 1.6 | 0.8 | 1.9 | 0.5 | 0.4 | ||
| subject 3 | 1.5 | 1.2 | 2.7 | 3.5 | 0.3 | 0.3 | ||
| subject 4 | 2.1 | 2.1 | 4.6 | 3.2 | 0.8 | 0.9 | ||
| subject 5 | 1.1 | 0.8 | 3.0 | 3.8 | 0.4 | 0.3 | ||
| Lymphocyte subsets (tho/μl) | ||||||||
| T-cells (CD3+) | B-cells (CD19+) | NK cells (CD3- CD16+ CD56+) | ||||||
| Week 0 | Week 6 | Week 0 | Week 6 | Week 0 | Week 6 | |||
| subject 1 | 1.3 | 1.3 | 0.1 | 0.08 | 0.4 | 0.3 | ||
| subject 2 | 1.3 | 1.0 | 0.3 | 0.2 | 0.6 | 0.4 | ||
| subject 3 | 1.4 | 1.0 | 0.1 | 0.03 | 0.3 | 0.6 | ||
| subject 4 | 1.6 | 1.7 | 0.1 | 0.09 | 1.4 | 1.4 | ||
| subject 5 | 1.0 | 0.7 | 0.02 | 0.01 | 0.4 | 0.1 | ||
| T-cell subsets (tho/μl) | ||||||||
| subsets | CD4+ CD8- | CD8+ CD4- | CD4+ CD8+ | CD4-CD8- | ||||
| Week 0 | Week 6 | Week 0 | Week 6 | Week 0 | Week 6 | Week 0 | Week 6 | |
| subject 1 | 1.0 | 1.0 | 0.2 | 0.2 | <0.01 | 0.01 | 0.02 | 0.03 |
| subject 2 | 0.9 | 0.8 | 0.3 | 0.2 | 0.02 | 0.02 | 0.07 | 0.02 |
| subject 3 | 0.8 | 0.6 | 0.5 | 0.3 | 0.02 | 0.02 | 0.06 | 0.04 |
| subject 4 | 0.9 | 0.9 | 0.6 | 0.6 | 0.01 | 0.02 | 0.09 | 0.07 |
| subject 5 | 0.8 | 0.5 | 0.2 | 0.1 | 0.01 | 0.01 | 0.02 | 0.01 |
| B-cell subsets (tho/μl) | ||||||||
| Transitional (CD19+ CD27-CD38++) | naïve mature (CD19+ CD27-CD38+) | resting memory (CD19+ CD27+ CD38-) | mature activated (CD19+ CD27+ CD38+) | |||||
| Week 0 | Week 6 | Week 0 | Week 6 | Week 0 | Week 6 | Week 0 | Week 6 | |
| subject 1 | <0.01 | <0.01 | 0.08 | 0.06 | <0.01 | <0.01 | 0.02 | 0.01 |
| subject 2 | 0.01 | <0.01 | 0.2 | 0.1 | <0.01 | <0.01 | 0.05 | 0.04 |
| subject 3 | <0.01 | <0.01 | 0.08 | 0.03 | <0.01 | <0.01 | 0.01 | <0.01 |
| subject 4 | <0.01 | <0.01 | 0.07 | 0.05 | 0.01 | <0.01 | 0.02 | 0.03 |
| subject 5 | <0.01 | <0.01 | 0.01 | <0.01 | <0.01 | <0.01 | <0.01 | <0.01 |
| Tregs, activated T-cells and pDCs (cells/μl) | ||||||||
| Treg (CD4+ CD25++ CD127-) | activated CD4+ (CD4+ HLA-DR+ CD25+) | pDCs (CD4-CD33-CD123+ CD11c-) | ||||||
| Week 0 | Week 6 | Week 0 | Week 6 | Week 0 | Week 6 | |||
| subject 1 | 2 | 5 | 7 | 35 | 0.6 | 0.2 | ||
| subject 2 | 3 | 3 | 39 | 65 | 1 | 1 | ||
| subject 3 | 4 | 7 | 16 | 45 | 2 | 0.3 | ||
| subject 4 | 0.5 | 5 | na | 74 | 7 | 1 | ||
| subject 5 | 8 | 19 | 25 | 53 | 4 | 0.7 | ||
| CLA+ T-cells subsets (tho/μl) | ||||||||
| CD4 memory (CD4+ CLA+ CD45RA-) | CD4 naive (CD4+ CLA+ CD45RA+) | CD8 memory (CD8+ CLA+ CD45RA-) | CD8 naive (CD8+ CLA+ CD45RA+) | |||||
| Week 0 | Week 6 | Week 0 | Week 6 | Week 0 | Week 6 | Week 0 | Week 6 | |
| subject 1 | 0.03 | 0.02 | 0.05 | 0.2 | <0.01 | 0.01 | 0.03 | 0.2 |
| subject 2 | 0.03 | 0.03 | 0.05 | 0.1 | 0.01 | 0.01 | 0.02 | 0.09 |
| subject 3 | 0.01 | 0.01 | 0.01 | 0.03 | 0.01 | 0.01 | 0.01 | 0.04 |
| subject 4 | 0.10 | 0.04 | <0.01 | 1.7 | 0.01 | 0.03 | 0.05 | 1.8 |
| subject 5 | 0.02 | 0.01 | 0.7 | 0.7 | 0.02 | 0.01 | 0.2 | 0.6 |
WBC, white blood cell; Nl range, normal range; NK, natural killer; Treg, regulatory T-cell; and CLA, cutaneous lymphocyte antigen.
Figure 4.
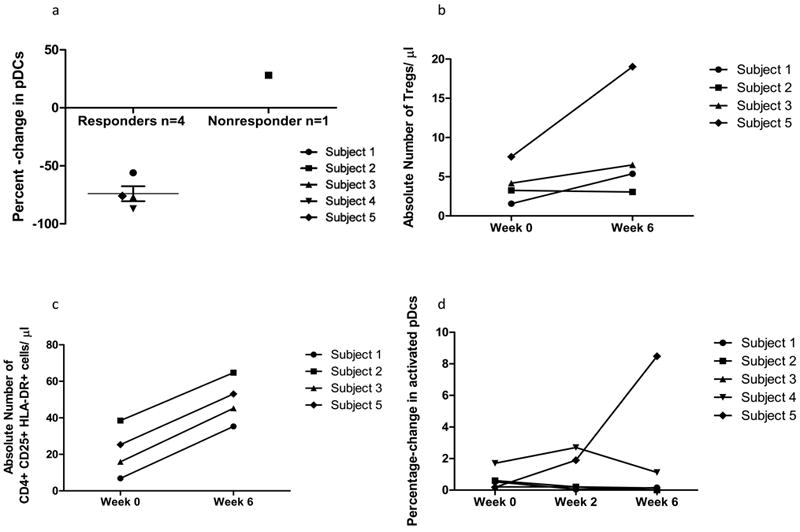
Changes in the circulating leukocyte profile that correlate with clinical response. (A) Percent-change in plasmacytoid dendritic cells (pDCs) (CD4- CD33-CD123+ CD11c-) from baseline to week 6. Subjects who experienced skin improvement had an average 74% decrease in pDC percentage (mean ± SEM: -74% ± 7%) vs. a 28% increase in the nonresponder; (B) Absolute numbers of regulatory T-cell (Treg) (CD4+ CD25++ CD127-) increased from week 0 to week 6 in responders. Subjects who experienced skin improvement had a mean 4.1-fold increase in Treg percentage (mean ± SEM: 4.1-fold increase ± 1.84-fold increase) vs. a 0.13-fold increase in the nonresponder; © Absolute numbers of activated CD4+ T-cells increased (CD3+ CD4+ HLA-DR+ CD25+) from week 0 to week 6. (D) Increase in activated pDCs (CD4- CD33- CD123+ CD11c- CD40+ HLA-DR+) in subject 5. Subject 5 had a robust and unique increase in activated pDCs.
Subject 5 had unique findings of interest in light of her systemic disease flare, including lymphopenia (800 cells/μl) at weeks 2 and 6, and an increase in activated pDCs from week 0 to 6 (Figure 4D).
Discussion
Four of five patients with treatment refractory CLE had a clinically satisfactory response to lenalidomide. Two of the responders (subjects 1 and 3) and the nonresponder previously failed thalidomide therapy. Lesional biopsies showed histologic features of CLE including CD3+ infiltrate and GAG accumulation. Two subjects had a CD4 predominant infiltrate, in keeping with prior reports9, 10. Recent investigation suggests CD4 predominance better characterizes SCLE and TLE, while CD8 predominance characterizes scarring subsets like DLE and lupus profundus7, 21, 31, 32. Two subjects with CD8 predominance had a scarring DLE phenotype and the other had SCLE/TLE overlap. CLA staining of the infiltrate was variable in accordance with previous findings, suggesting a range of CLA+ expression in CLE lesions12.
We saw decreased GAG content in three responding subjects with DLE. We find this interesting given the immunologic activity of GAGs, specifically their ability to stimulate dendritic cells via toll-like receptors33, 34. Further study into the role of these molecules in the pathogenesis of CLE is warranted.
To assess the predominant model of IFN-mediated signaling in CLE pathogenesis, we analyzed CXCL10 expression in the skin and the IFN-inducible gene expression in the peripheral blood before and after treatment. CXCL10 gene expression increases in keratinocytes after stimulation with IFN-α; however, the same response has been seen in apoptotic keratinocytes treated with IFN-γ5, 6, 35. This suggests CXCL10 may also reflect type II IFN-mediated signaling, however, CXCL10 is expressed at significantly higher levels in CLE lesions than in other inflammatory dermatoses, suggesting specificity for CLE pathogenesis5.
All lesional biopsies had significant CXCL10 staining. The nonresponder had the highest levels, peaking to involve greater than 15% of the section at week 2 (Figure 3). However, all subjects had lower CXCL10 staining at week 6 than baseline. Also, the IFN score of three subjects decreased with treatment irrespective of the clinical response.
A small body of literature characterizing the circulating leukocyte phenotype in CLE exists. We add characteristics of severe treatment refractory CLE (Table 3). Prior studies showed increased circulating CLA+ CD4+ and CD8+ T-cells in generalized DLE compared to healthy controls21. Here we observed less circulating CLA+ leukocytes than described using the same antibody clone. Also we noted the nonresponder to have unique baseline findings including granulocytopenia, and higher levels of B cells, and memory and activated T cells. Further study is needed to determine if these findings have prognostic value.
No significant changes in the circulating leukocyte profile was seen with treatment, however rare circulating subsets appeared to trend with clinical response. Responders had a decrease in circulating pDCs and an increase in circulating Tregs from week 0 to 6 (Figure 4A and 4B). Although these represent rare subsets and the changes represent small changes in absolute number, both cell types have been implicated in the pathophysiology of CLE. The decrease in pDCs in responders is interesting given their ability to produce type I IFNs. Prior studies showed normal numbers of circulating Tregs in CLE. Here we show an increase in Tregs with response to treatment. We used CD25++, CD127- as Treg markers leaving the possibility activated T-cells were counted. Lenalidomide has been shown to increase CD4+ Foxp3 cells in patients with multiple myeloma, suggesting a potential drug specific effect36.
Absolute numbers of circulating HLA-DR+ CD4+ T-cells, a rare circulating cell-type in our study, increased in four subjects, including the nonresponder (Figure 4C). A correlation between CLE clinical activity and HLA-DR expression on CD4+ and CD8+ T cells has been described. We believe this correlation requires further investigation in the setting of treatment.
Finally, we saw unique changes in subject 5, the patient whose skin responded but developed systemic symptoms of SLE at week 20 of the study (Figure 4D). This patient had a robust increase in activated pDCs which may correlate with systemic symptoms, as SLE is associated with high levels of serum IFNαwhich activated pDCs produce30. We cannot exclude a predisposition to develop SLE. She was the only subject to report arthralgias at baseline and was lymphopenic at weeks 2 and 6. Lymphopenia has been described as a marker for SLE development in CLE patients37. In light of this event and evidence of cell activation, we caution of the risk of systemic disease activation with lenalidomide.
In summary, lenalidomide reduced CLE activity in four of five subjects. The histology and circulating leukocyte profile of five patients with severe treatment refractory CLE is described, including CD8 predominant infiltrate in three subjects. The nonresponder had high CXCL10 expression in the skin and increased activated circulating CD4+T-cells. Responders with DLE had a decrease in GAG content. Clinical response was also associated with a trend towards increased circulating Tregs and decreased circulating pDCs. In addition, we noted a decrease in IFN-mediated gene expression in the peripheral blood and IFN-inducible chemokine expression in the skin that did not correlate with clinical response. Finally, we documented evidence of cellular activation and caution that lenalidomide may activate T-cells and pDCs, triggering systemic disease in a subset of CLE patients.
The small subject pool limits recommendations on patient selection and monitoring parameters. However patients with signs of systemic disease such as arthralgias may not be candidates. In considering the use of this medication for treatment refractory CLE it would be prudent to monitor for signs and symptoms of SLE, including a CBC with differential to look for cytopenias. Additional study is required to understand the predictive value of more specialized laboratory studies in predicting response to lenalidomide therapy. Further work to identify SLE susceptibility risk factors in CLE patients may be informative in safely selecting patients that would benefit from lenalidomide.
Acknowledgments
This work was supported in part by the Alliance for Lupus Research, a Merit Review Grant from the Department of Veterans Affairs Veterans Health Administration, Office of Research and Development, Biomedical Laboratory Research and Development and by the National Institutes of Health (NIH K24-AR 02207) to VPW.
Funding sources: This study was supported by the Alliance for Lupus Research. Celgene Corporation provided the drug free of charge.
Footnotes
Prior presentation of part of this manuscript at the Society of Investigative Dermatology 2009 annual meeting and American College of Rheumatology 2009 annual meeting
Conflict of Interest: The authors have no conflict of interest to declare.
References
- 1.Moghadam-Kia S, Chilek K, Gaines E, Costner M, Rose ME, Okawa J, et al. Cross-sectional analysis of a collaborative Web-based database for lupus erythematosus-associated skin lesions: prospective enrollment of 114 patients. Arch Dermatol. 2009;145:255–60. doi: 10.1001/archdermatol.2008.594. [DOI] [PMC free article] [PubMed] [Google Scholar]
- 2.Durosaro O, Davis MD, Reed KB, Rohlinger AL. Incidence of cutaneous lupus erythematosus, 1965-2005: a population-based study. Arch Dermatol. 2009;145:249–53. doi: 10.1001/archdermatol.2009.21. [DOI] [PMC free article] [PubMed] [Google Scholar]
- 3.Shah A, Albrecht J, Bonilla-Martinez Z, Okawa J, Rose M, Rosenbach M, et al. Lenalidomide for the treatment of resistant discoid lupus erythematosus. Arch Dermatol. 2009;145:303–6. doi: 10.1001/archdermatol.2009.30. [DOI] [PMC free article] [PubMed] [Google Scholar]
- 4.Kotla V, Goel S, Nischal S, Heuck C, Vivek K, Das B, et al. Mechanism of action of lenalidomide in hematological malignancies. J Hematol Oncol. 2009;2:36. doi: 10.1186/1756-8722-2-36. [DOI] [PMC free article] [PubMed] [Google Scholar]
- 5.Meller S, Winterberg F, Gilliet M, Muller A, Lauceviciute I, Rieker J, et al. Ultraviolet radiation-induced injury, chemokines, and leukocyte recruitment: An amplification cycle triggering cutaneous lupus erythematosus. Arthritis Rheum. 2005;52:1504–16. doi: 10.1002/art.21034. [DOI] [PubMed] [Google Scholar]
- 6.Wenzel J, Worenkamper E, Freutel S, Henze S, Haller O, Bieber T, et al. Enhanced type I interferon signalling promotes Th1-biased inflammation in cutaneous lupus erythematosus. J Pathol. 2005;205:435–42. doi: 10.1002/path.1721. [DOI] [PubMed] [Google Scholar]
- 7.Wenzel J, Zahn S, Mikus S, Wiechert A, Bieber T, Tuting T. The expression pattern of interferon-inducible proteins reflects the characteristic histological distribution of infiltrating immune cells in different cutaneous lupus erythematosus subsets. Br J Dermatol. 2007;157:752–7. doi: 10.1111/j.1365-2133.2007.08137.x. [DOI] [PubMed] [Google Scholar]
- 8.Flier J, Boorsma DM, van Beek PJ, Nieboer C, Stoof TJ, Willemze R, et al. Differential expression of CXCR3 targeting chemokines CXCL10, CXCL9, and CXCL11 in different types of skin inflammation. J Pathol. 2001;194:398–405. doi: 10.1002/1096-9896(200108)194:4<397::aid-path899>3.0.co;2-s. [DOI] [PubMed] [Google Scholar]
- 9.Tebbe B, Mazur L, Stadler R, Orfanos CE. Immunohistochemical analysis of chronic discoid and subacute cutaneous lupus erythematosus--relation to immunopathological mechanisms. Br J Dermatol. 1995;132:25–31. doi: 10.1111/j.1365-2133.1995.tb08620.x. [DOI] [PubMed] [Google Scholar]
- 10.Wenzel J, Uerlich M, Worrenkamper E, Freutel S, Bieber T, Tuting T. Scarring skin lesions of discoid lupus erythematosus are characterized by high numbers of skin-homing cytotoxic lymphocytes associated with strong expression of the type I interferon-induced protein MxA. Br J Dermatol. 2005;153:1011–5. doi: 10.1111/j.1365-2133.2005.06784.x. [DOI] [PubMed] [Google Scholar]
- 11.Farkas L, Beiske K, Lund-Johansen F, Brandtzaeg P, Jahnsen FL. Plasmacytoid dendritic cells (natural interferon- alpha/beta-producing cells) accumulate in cutaneous lupus erythematosus lesions. Am J Pathol. 2001;159:237–43. doi: 10.1016/s0002-9440(10)61689-6. [DOI] [PMC free article] [PubMed] [Google Scholar]
- 12.Magro CM, Dyrsen ME. Cutaneous lymphocyte antigen expression in benign and neoplastic cutaneous B- and T-cell lymphoid infiltrates. J Cutan Pathol. 2008;35:1040–9. doi: 10.1111/j.1600-0560.2007.00971.x. [DOI] [PubMed] [Google Scholar]
- 13.Franz B, Fritzsching B, Riehl A, Oberle N, Klemke CD, Sykora J, et al. Low number of regulatory T cells in skin lesions of patients with cutaneous lupus erythematosus. Arthritis Rheum. 2007;56:1910–20. doi: 10.1002/art.22699. [DOI] [PubMed] [Google Scholar]
- 14.Kind P, Lipsky PE, Sontheimer RD. Circulating T- and B-cell abnormalities in cutaneous lupus erythematosus. J Invest Dermatol. 1986;86:235–9. doi: 10.1111/1523-1747.ep12285191. [DOI] [PubMed] [Google Scholar]
- 15.Wouters CH, Diegenant C, Ceuppens JL, Degreef H, Stevens EA. The circulating lymphocyte profiles in patients with discoid lupus erythematosus and systemic lupus erythematosus suggest a pathogenetic relationship. Br J Dermatol. 2004;150:693–700. doi: 10.1111/j.0007-0963.2004.05883.x. [DOI] [PubMed] [Google Scholar]
- 16.Wenzel J, Henze S, Brahler S, Bieber T, Tuting T. The expression of human leukocyte antigen-DR and CD25 on circulating T cells in cutaneous lupus erythematosus and correlation with disease activity. Exp Dermatol. 2005;14:454–9. doi: 10.1111/j.0906-6705.2005.00301.x. [DOI] [PubMed] [Google Scholar]
- 17.Wangel AG, Johansson E, Ranki A. Polyclonal B-cell activation and increased lymphocyte helper-suppressor ratios in discoid lupus erythematosus. Br J Dermatol. 1984;110:665–9. doi: 10.1111/j.1365-2133.1984.tb04702.x. [DOI] [PubMed] [Google Scholar]
- 18.Gilliam JN, Hurd ER. Comparison of circulating T and B lymphocytes in discoid versus systemic lupus erythematosus. Clin Immunol Immunopathol. 1976;6:149–55. doi: 10.1016/0090-1229(76)90105-7. [DOI] [PubMed] [Google Scholar]
- 19.Wenzel J, Bauer R, Boehm I. Fluorescence-activated cell sorter analysis in patients with cutaneous lupus erythematosus. Arch Dermatol. 1999;135:720–1. doi: 10.1001/archderm.135.6.720. [DOI] [PubMed] [Google Scholar]
- 20.Wenzel J, Bauer R, Bieber T, Boehm I. Discoid and subacute cutaneous lupus erythematosus: detection of differences in peripheral lymphocyte numbers. Acta Derm Venereol. 2000;80:456. doi: 10.1080/000155500300080456. [DOI] [PubMed] [Google Scholar]
- 21.Wenzel J, Henze S, Worenkamper E, Basner-Tschakarjan E, Sokolowska-Wojdylo M, Steitz J, et al. Role of the chemokine receptor CCR4 and its ligand thymus- and activation-regulated chemokine/CCL17 for lymphocyte recruitment in cutaneous lupus erythematosus. J Invest Dermatol. 2005;124:1241–8. doi: 10.1111/j.0022-202X.2005.23755.x. [DOI] [PubMed] [Google Scholar]
- 22.Braunstein IKR, Rosenbach M, Okawa J, Werth VP. The IFN-inducible Gene Signature is Elevated in SCLE and DLE and correlates with the CLASI score. The 73rd Annual Scientific Meeting of the American College of Rheumatology; Philadelphia PA. 2009. [Google Scholar]
- 23.Jarvinen TM, Hellquist A, Koskenmies S, Einarsdottir E, Koskinen LL, Jeskanen L, et al. Tyrosine kinase 2 and interferon regulatory factor 5 polymorphisms are associated with discoid and subacute cutaneous lupus erythematosus. Exp Dermatol. 2009 doi: 10.1111/j.1600-0625.2009.00982.x. [DOI] [PubMed] [Google Scholar]
- 24.Rice G, Newman WG, Dean J, Patrick T, Parmar R, Flintoff K, et al. Heterozygous mutations in TREX1 cause familial chilblain lupus and dominant Aicardi-Goutieres syndrome. Am J Hum Genet. 2007;80:811–5. doi: 10.1086/513443. [DOI] [PMC free article] [PubMed] [Google Scholar]
- 25.Goutieres F, Aicardi J, Barth PG, Lebon P. Aicardi-Goutieres syndrome: an update and results of interferon-alpha studies. Ann Neurol. 1998;44:900–7. doi: 10.1002/ana.410440608. [DOI] [PubMed] [Google Scholar]
- 26.Castaneda CP, Zeldis JB, Freeman J, Quigley C, Brandenburg NA, Bwire R. RevAssist: a comprehensive risk minimization programme for preventing fetal exposure to lenalidomide. Drug Saf. 2008;31:743–52. doi: 10.2165/00002018-200831090-00003. [DOI] [PubMed] [Google Scholar]
- 27.Albrecht J, Taylor L, Berlin JA, Dulay S, Ang G, Fakharzadeh S, et al. The CLASI (Cutaneous Lupus Erythematosus Disease Area and Severity Index): an outcome instrument for cutaneous lupus erythematosus. J Invest Dermatol. 2005;125:889–94. doi: 10.1111/j.0022-202X.2005.23889.x. [DOI] [PMC free article] [PubMed] [Google Scholar]
- 28.Bonilla-Martinez ZL, Albrecht J, Troxel AB, Taylor L, Okawa J, Dulay S, et al. The cutaneous lupus erythematosus disease area and severity index: a responsive instrument to measure activity and damage in patients with cutaneous lupus erythematosus. Arch Dermatol. 2008;144:173–80. doi: 10.1001/archderm.144.2.173. [DOI] [PMC free article] [PubMed] [Google Scholar]
- 29.Lillie R, Fullmer H. Histopathologic Technic and Practical Histochemistry. New York: McGraw-Hill Book Co; 1976. [Google Scholar]
- 30.Feng X, Wu H, Grossman JM, Hanvivadhanakul P, FitzGerald JD, Park GS, et al. Association of increased interferon-inducible gene expression with disease activity and lupus nephritis in patients with systemic lupus erythematosus. Arthritis Rheum. 2006;54:2951–62. doi: 10.1002/art.22044. [DOI] [PubMed] [Google Scholar]
- 31.Alexiades-Armenakas MR, Baldassano M, Bince B, Werth V, Bystryn JC, Kamino H, et al. Tumid lupus erythematosus: criteria for classification with immunohistochemical analysis. Arthritis Rheum. 2003;49:494–500. doi: 10.1002/art.11206. [DOI] [PubMed] [Google Scholar]
- 32.Kuhn A, Sonntag M, Lehmann P, Megahed M, Vestweber D, Ruzicka T. Characterization of the inflammatory infiltrate and expression of endothelial cell adhesion molecules in lupus erythematosus tumidus. Arch Dermatol Res. 2002;294:6–13. doi: 10.1007/s00403-001-0286-7. [DOI] [PubMed] [Google Scholar]
- 33.Tesar BM, Jiang D, Liang J, Palmer SM, Noble PW, Goldstein DR. The Role of Hyaluronan Degradation Products as Innate Alloimmune Agonists. American Journal of Transplantation. 2006;6:2622–35. doi: 10.1111/j.1600-6143.2006.01537.x. [DOI] [PubMed] [Google Scholar]
- 34.Termeer C, Benedix F, Sleeman J, Fieber C, Voith U, Ahrens T, et al. Oligosaccharides of Hyaluronan activate dendritic cells via toll-like receptor 4. J Exp Med. 2002;195:99–111. doi: 10.1084/jem.20001858. [DOI] [PMC free article] [PubMed] [Google Scholar]
- 35.Klunker S, Trautmann A, Akdis M, Verhagen J, Schmid-Grendelmeier P, Blaser K, et al. A second step of chemotaxis after transendothelial migration: keratinocytes undergoing apoptosis release IFN-gamma-inducible protein 10, monokine induced by IFN-gamma, and IFN-gamma-inducible alpha-chemoattractant for T cell chemotaxis toward epidermis in atopic dermatitis. J Immunol. 2003;171:1078–84. doi: 10.4049/jimmunol.171.2.1078. [DOI] [PubMed] [Google Scholar]
- 36.Minnema MC, van der Veer MS, Aarts T, Emmelot M, Mutis T, Lokhorst HM. Lenalidomide alone or in combination with dexamethasone is highly effective in patients with relapsed multiple myeloma following allogeneic stem cell transplantation and increases the frequency of CD4+Foxp3+ T cells. Leukemia. 2009;23:605–7. doi: 10.1038/leu.2008.247. [DOI] [PubMed] [Google Scholar]
- 37.Wenzel J, Bauer R, Uerlich M, Bieber T, Boehm I. The value of lymphocytopenia as a marker of systemic involvement in cutaneous lupus erythematosus. Br J Dermatol. 2002;146:869–71. doi: 10.1046/j.1365-2133.2002.04588.x. [DOI] [PubMed] [Google Scholar]