

SUMMARY
Protein tyrosine phosphatase 1B (PTP1B) is a negative regulator of insulin signaling and a therapeutic target for type 2 diabetes (T2DM). In this study, we have evaluated the role of PTP1B in the development of aging-associated obesity, inflammation and peripheral insulin resistance by assessing metabolic parameters at 3 and 16 months in PTP1B−/− mice maintained on mixed genetic background (C57Bl/6J x 129Sv/J). Whereas fat mass and adipocyte size were increased in wild-type control mice at 16 months, these parameters did not change with aging in PTP1B−/− mice. Increased levels of pro-inflammatory cytokines, crown-like structures and hypoxia-inducible factor (HIF)-1α were observed only in adipose tissue from 16-month old wild-type mice. Similarly, islet hyperplasia and hyperinsulinemia were observed in wild-type mice with aging-associated obesity, but not in PTP1B−/− animals. Leanness in 16-month old PTP-1B−/− mice was associated with increased energy expenditure. Whole body insulin sensitivity decreased in 16-month old control mice; however studies with the hyperinsulinemic-euglycemic clamp revealed that PTP1B-deficiency prevented this obesity-related decreased peripheral insulin sensitivity. At a molecular level, PTP1B expression and enzymatic activity were up-regulated in liver and muscle of 16-month old wild-type mice as were the activation of stress kinases and the expression of p53. Conversely, insulin receptor-mediated Akt/Foxo1 signaling was attenuated in these aged control mice. Collectively, these data implicate PTP1B in the development of inflammation and insulin resistance associated with obesity during aging and suggest that inhibition of this phosphatase by therapeutic strategies might protect against age-dependent T2DM.
Keywords: insulin resistance, type 2 diabetes, obesity, inflammation, PTP1B
INTRODUCTION
Type 2 Diabetes Mellitus (T2DM) is the most common endocrine disorder and occurs when insulin secretion can no longer compensate for insulin resistance in peripheral tissues (Barbieri et al. 2001). Aging is associated with development of insulin resistance, providing a potential explanation for the prevalence of T2DM in older adults (Fink et al. 1983), (Amati et al. 2009). However, studies of the effects of aging on insulin action have been complicated by the inability to discriminate between the influence of age itself and aging-associated changes in body composition.
Although the precise molecular mechanisms underlying insulin resistance are not well defined, obesity is associated with a low-grade systemic inflammation that contributes to defects in the critical nodes of insulin signaling (Taniguchi et al. 2006). Several mechanisms modulate insulin signaling, including down-regulation of the insulin receptor (IR), serine phosphorylation or degradation of IRS proteins and dephosphorylation by specific protein tyrosine phosphatases, notably by protein tyrosine phosphatase (PTP) 1B. This phosphatase is a major negative regulator of insulin and leptin sensitivity, acting by dephosphorylation of IR and leptin receptor-associated Janus kinase 2 (Seely et al. 1996), (Zabolotny et al. 2002). In vivo experiments have demonstrated that PTP1B-deficient (PTP1B−/−) mice exhibit increased insulin sensitivity at 10–14 weeks of age, resistance to weight gain on high-fat diet (HFD) and increased basal metabolic rate (Elchebly et al. 1999), (Klaman et al. 2000). More recent studies have reported that PTP1B re-expression in the liver of PTP1B−/− mice attenuates enhanced insulin sensitivity (Haj et al. 2005). In contrast, liver-specific deletion of PTP1B improves metabolic syndrome (MS) and attenuates diet-induced endoplasmic reticulum (ER) stress (Delibegovic et al. 2009). PTP1B expression is elevated in the liver of mice fed with HFD, concomitant with increased levels of TNFα and CD68, two markers of hepatic inflammation associated with steatosis (Zabolotny et al. 2008). In humans, PTP1B polymorphisms are associated with insulin resistance, obesity, and other characteristics of MS in some populations (Kipfer-Coudreau et al. 2004). These studies reinforce the importance of the development of PTP1B inhibitors as promising drugs for the treatment of T2DM (Kasibhatla et al. 2007).
In the present study, we have investigated the involvement of PTP1B in the deleterious effects of adiposity and metabolic damage in insulin sensitive tissues using wild-type and PTP1B−/− mice maintained on the same mixed genetic background (C57Bl/6J x 129Sv/J) at 3 and 16 months of age.
RESULTS
PTP1B-deficient mice are protected against fat accumulation and peripheral insulin resistance during aging
Insulin resistance in peripheral tissues, frequently associated with an increase in body fat, progressively increases with age (Barbieri et al. 2001), (Tchkonia et al. 2010). Since PTP1B-deficient mice are resistant to HFD-induced obesity (Elchebly et al. 1999), (Klaman et al. 2000), we investigated whether its absence would protect against the adiposity and insulin resistance associated with aging. This study was performed in animals maintained on a normal chow diet for up to 16 months. In both mice and rats, no differences in parameters constituting body composition, including fat mass, have been observed between animals of 16 and 24 months of age (Escriva et al. 2007), (Quinn et al. 2010). Male wild-type mice at 16 months of age (hereafter referred to as 16-month old, obese wild-type mice) displayed significant increases in total body weight, percentage of fat content, fat mass and lean mass as compared to mice at 3 months of age (Fig. 1A). Consistent with this, insulin and glucose tolerance tests revealed impaired insulin sensitivity with moderate glucose intolerance in these 16-month old, obese wild-type mice as compared to 3-month old controls (Fig. 1B). These alterations in 16-month old, obese wild-type mice were prevented in age-matched PTP1B−/− mice (hereafter referred to as 16-month old, nonobese PTP1B−/− mice), except the increase in body weight due to a significant increase in lean mass. Notably, no differences in fat content, insulin sensitivity and glucose tolerance were found between 3 and 16-month old PTP1B−/− mice although body weight was increased at 16 months due to enhanced lean mass.
Figure 1. PTP1B-deficient mice are protected against fat accumulation and insulin resistance during aging.

Metabolic phenotyping of 3m-PTP1B+/+, 3m-PTP1B−/−, 16m-PTP1B+/+ and 16m-PTP1B−/− mice. A. (left panel) Body composition analyzed by dual-energy x-ray absorptiometry (DEXA) scan analysis (n=6 per genotype). (right panel) Body weight, fat content, fat mass and lean mass (n=6 per genotype). B. (left panel) insulin tolerance test (ITT) and (right panel) glucose tolerance test (GTT) (n=20–25 per genotype). Data corresponding to ITT and GTT tests in 3m-PTP1B−/− versus 3m-PTP1B+/+ are in agreement with a previous report (Klaman et al. 2000). C. Hyperinsulinemic-euglycemic clamp and tissue-specific glucose uptake studies (n=6–8 per genotype). *p<0.05, 3m-PTP1B−/− vs. 3m-PTP1B+/+; ●p<0.05, ●●p<0.01 and ●●●p<0.005, 16m-PTP1B+/+ vs. 3m-PTP1B+/+; ▲p<0.05, ▲▲p<0.01 and ▲▲▲p<0.005, 16m-PTP1B−/− vs. 16m-PTP1B+/+; #p<0.05 and ###p<0.005, 16m-PTP1B−/− vs. 3m-PTP1B−/−.
Next, we performed a 2-h hyperinsulinemic-euglycemic clamp combined with intravenous administration of [3-3H] glucose and [1-14C] 2-deoxyglucose in the four groups of mice (Fig. 1C). Although a small but not significant increase was observed in whole body glucose infusion rate and hepatic glucose production (HGP) during the clamp in 3-month old PTP1B−/− mice compared to 3-month old wild-type mice, there was a significant increase in tissue-specific glucose uptake in both white adipose tissue (WAT) and brown adipose tissue (BAT). On the other hand, when 16-month old mice of both genotypes were compared with the corresponding 3-month old animals, glucose infusion rate decreased by 60% in 16-month old, obese wild-type mice whereas this parameter only decreased by 28% in 16-month old, nonobese PTP1B−/− mice. Moreover, the significant decreases observed in glucose uptake in skeletal muscle, WAT and BAT in 16-month old, obese wild-type mice compared to 3-month old controls were not appreciated in 16-month old, nonobese PTP1B−/− mice. Accordingly with these data, while glycogen synthesis decreased and hepatic glucose production (HGP) increased in 16-month old, obese wild-type mice compared to 3-month old wild-type mice, no significant differences were found in these parameters between 3 and 16-month old PTP1B−/− mice.
As it has been reported that PTP1B deficiency improves beta-cell function in IRS2−/− diabetic mice (Kushner et al. 2004), we performed histological analysis of the endocrine pancreas in wild-type and PTP1B−/− mice at 3 and 16 months. As expected for an insulin resistant state, pancreatic sections from 16-month old, obese wild-type mice showed enlarged islets with a 2.5-fold increase in islet area. Moreover, in these mice insulin levels were significantly elevated compared to 3-month old wild-type mice (Fig. 2A, 2B). However, PTP1B expression in pancreas was similar between both age groups of wild-type mice (Fig. 2C). Notably, islet enlargement and hyperinsulinemia were absent in 16-month old, nonobese PTP1B−/− mice (Fig. 2A, 2B). Fed glucose levels were 130 ± 4 mg/dl (3-month old wild-type), 119 ± 3 mg/dl (3-month old PTP1B−/−), 141 ± 5 mg/dl (16-month old, obese wild-type) and 113 ± 4 mg/dl (16-month old, nonobese PTP1B−/−) (p=0.045, 3-month old PTP1B−/− versus 3-month old wild-type; p=0.01, 16-month old, obese wild-type versus 3-month old wild-type; p=0.02 16-month old, nonobese PTP1B−/− versus 16-month old, obese wild-type).
Figure 2. PTP1B deficiency protects against β-cell hyperplasia and hyperinsulinemia during aging.

Analysis of pancreata from 3m-PTP1B+/+, 3m-PTP1B−/−, 16m-PTP1B+/+ and 16m-PTP1B−/− mice. A. (left panel) Representative staining with cresyl violet in pancreas sections (n=4–5 per genotype). (right panel) Islet surface was calculated by mean cross-sectional area of multicelled islets from pancreas (n=45–50 islets per pancreas from 4–5 animals per genotype). B. (left panel) Representative anti-insulin immunostaining in pancreas sections. (right panel) Serum levels of insulin (n=10 per genotype). C. (left panel) Representative anti-PTP1B immunostaining in pancreas sections (n=3 per genotype). (right panel) Ptpn1 mRNA levels determined by real-time PCR (n=5–6 per genotype). ●p<0.05 and ●●●p<0.005, 16m-PTP1B+/+ vs. 3m-PTP1B+/+; ▲p<0.05 and ▲▲▲p<0.005, 16m-PTP1B−/− vs. 16m-PTP1B+/+.
PTP1B-deficiency protects against inflammation and hypoxia in white adipose tissue in age-associated obesity
Since adipose tissue accretion and inflammation may be causatively linked to insulin resistance, we hypothesized that PTP1B might modulate the obesity-induced inflammation associated with aging. Thus, we first assessed pro-inflammatory markers in WAT from the four groups of mice. Histological examination of WAT showed a direct relationship between fat accumulation (Fig. 1A) and adipocyte hypertrophy with the mean adipocyte cross-sectional area being significantly higher in 16-month old, obese wild-type mice compared to age-matched nonobese PTP1B−/− mice (Fig. 3A). Moreover, immunohistochemical analysis of F4/80 revealed clusters of adipose tissue macrophages (ATM) forming crown-like structures exclusively in WAT of 16-month old, obese wild-type mice (Fig. 3A). Quantitative real-time PCR showed significant elevations in the expression of other pro-inflammatory markers such as CD68, CD11c and TNFα in these mice (Fig. 3B). In contrast, PTP1B−/− mice presented smaller increases in these parameters with aging and the levels of the above mentioned pro-inflammatory markers were significantly lower in 16-month old, nonobese PTP1B−/− mice than those of the age-matched obese wild-type mice. Next, we investigated whether our observations at the local tissue level were also reflected in serum levels of pro-inflammatory cytokines and adipokines. As shown in Fig. 3C, serum TNFα increased with aging in both genotypes of mice. Of note, the levels of serum TNFα were significantly higher in 16-month old, obese wild type mice as compared to age-matched nonobese PTP1B−/− mice. However, serum levels of IL6 or resistin were similar between all the groups of mice. Adiponectin levels were higher in 3-month old PTP1B−/− mice as compared to the age matched wild-type controls, but no differences in this cytokine were detected between obese, wild-type and nonobese, PTP1B−/− mice at 16 months. Serum leptin levels increased with aging in wild-type mice in proportion to adiposity. However, consistent with the lower adiposity observed in 16-month old, nonobese PTP1B−/− mice, levels of leptin were significantly lower in these mice as compared to age-matched wild-type mice. Serum triglycerides (TG) were significantly elevated in 16-month old, obese wild-type mice as compared to 3-month old wild type control but the levels in 16-month old, nonobese PTP1B−/− mice were equivalent to their corresponding young animals (Fig. 3D).
Figure 3. PTP1B-deficiency protects against inflammation and hypoxia in white adipose tissue in age-associated obesity.

Analysis of WAT pads from 3m-PTP1B+/+, 3m-PTP1B−/−, 16m-PTP1B+/+ and 16m-PTP1B−/− mice. A. (left panel) Representative immunostaining with F4/80 in WAT sections (n=7–8 per genotype). (right panel) Adipocyte surface was calculated by mean cross-sectional area of adipocytes from epididymal WAT (n=25 adipocytes per WAT pad from 6 animals per genotype). B. F4/80, Cd68, Tnf and Cd11c mRNA levels determined by real-time PCR (n=9 per genotype). C. Serum levels of the indicated cytokines (n=8–12 per genotype). D. Serum levels of TG (n=8 per genotype). E. Western blot analysis of WAT pad extracts with the indicated antibodies (n=6–8 per genotype). *p<0.05, 3m-PTP1B−/− vs. 3m-PTP1B+/+; ●p<0.05, ●●p<0.01 and ●●●p<0.005, 16m-PTP1B+/+ vs. 3m-PTP1B+/+; ▲p<0.05 and ▲▲▲p<0.005, 16m-PTP1B−/− vs. 16m-PTP1B+/+; #p<0.05, 16m-PTP1B−/− vs. 3m-PTP1B−/−.
Recently, increased expression of p53 in WAT has been reported to be involved in the development of diet-induced obesity and insulin resistance (Minamino et al. 2009). Interestingly, a significant up-regulation of p53 was detected in WAT from 16-month old, obese wild-type mice but not in 16-month old, nonobese PTP1B−/− mice (Fig. 3E). Moreover, the expression of FasL and Bid, two pro-apoptotic mediators of the death receptor signaling implicated in the pro-inflammatory response (Wueest et al. 2010), was increased in WAT from 16-month old, obese wild-type mice as compared to age-matched mice lacking PTP1B. Finally, enhanced expression of HIF1α in WAT of 16-month old, obese wild-type mice suggested the presence of microvascular hypoxia which was not observed in 16-month old, nonobese PTP1B−/− mice.
PTP1B deficiency protects against obesity-associated activation of stress kinases and steatosis in the liver during aging
Since adipose tissue inflammation has been linked to histopathological changes in the liver that reflect steatosis (Cancello et al. 2006), we next addressed the possibility that loss of PTP1B, by reducing the inflammation in WAT, ameliorates the development of fatty liver during aging-associated obesity. Histological examination of liver sections revealed higher lipid accumulation in 16-month old obese, wild-type mice as compared to nonobese PTP1B-deficient mice of the same age (Fig. 4A). This was associated with decreased hepatic TG in 16-month old, nonobese PTP1B−/− mice (Figure 4B). In agreement with these data, expression levels of genes involved in fatty acid synthesis such as Fasn and Srebf1 markedly increased in the liver of 16-month, obese wild-type mice but up-regulation of these markers was absent in 16-month, nonobese PTP1B-deficient mice that did not develop hepatic steatosis with aging (Fig. 4C).
Figure 4. PTP1B deficiency protects against obesity-associated activation of stress kinases and steatosis in the liver during aging.

Analysis of livers from 3m-PTP1B+/+, 3m-PTP1B−/−, 16m-PTP1B+/+ and 16m-PTP1B−/− mice. A. Representative staining with Hematoxylin & Eosin and Oil red O in liver sections (n=6 per genotype). B. Hepatic TG content (n=6 per genotype). C. Fasn and Srebf1 mRNA levels determined by real-time PCR (n=8 per genotype). D. Western blot analysis of liver extracts with the indicated antibodies (n=6–8 per genotype). ●p<0.05 and ●●p<0.01, 16m-PTP1B+/+ vs. 3m-PTP1B+/+; ▲p<0.05 and ▲▲▲p<0.005, 16m-PTP1B−/− vs. 16m-PTP1B+/+.
To explore whether this obesity-dependent lipid accumulation during aging may be related to the activation of stress kinases, we measured the phosphorylation of JNK1/2, its substrate c-Jun and p38 MAPK kinase. The results depicted in Fig. 4D demonstrate increased activation of these stress kinases in livers from 16-month old, obese wild-type mice compared with 3-month old wild-type controls. Activation of these stress kinases was not detected in 16-month old mice lacking PTP1B that did not develop obesity during aging. Moreover, phosphorylation of IRS1 ser307, which is related to the negative feed-back loop of JNK-mediated signaling (Sabio et al. 2009), was increased only in the livers of 16-month old, obese wild-type mice. Conversely, no differences in the phosphorylation of the ER stress kinases PERK and eIF2α were observed between the livers of both genotypes of mice at 16 months (results not shown), indicating that JNK is likely to mediate the serine phosphorylation of IRS1 during age-associated obesity.
Aged PTP1B-deficient mice are protected against hepatic insulin resistance
Various lines of evidence demonstrate that chronic activation of pro-inflammatory pathways within insulin-sensitive cells can lead to the deregulation of insulin signaling (Schenk et al. 2008). Consistent with this notion, insulin-induced tyrosine phosphorylation of the IRβ chain and total (anti-phosphoTyr-associated) PI 3-kinase activity were decreased in livers from 16-month, obese wild-type mice as compared to mice at 3 months (Figures 5A and S1). However, in 16-month old, nonobese PTP1B−/− mice activation of IR and PI 3-kinase-mediated insulin signaling was comparable to the response of these mice at 3 months of age. Downstream of PI 3-kinase, the phosphorylation of Akt at the catalytic (Thr 308) and hydrophobic (Ser 473) sites was markedly reduced in the livers of 16-month old, obese wild-type mice but not in age-matched PTP1B−/− mice as compared with the corresponding controls at 3 months. Likewise, the ability of insulin to stimulate the phosphorylation of Foxo1 was enhanced in 16-month old, nonobese mice lacking PTP1B. Since we have previously reported enhanced insulin signaling in PTP1B-deficient hepatocytes from 3-month old mice compared to wild-type controls (Gonzalez-Rodriguez et al. 2007), we analyzed this response in primary hepatocytes from 16-month old, obese wild-type mice and nonobese mice lacking PTP1B. As a control we prepared primary hepatocytes from 3-month old mice of both genotypes. Figures 5B and S1 reveal that the aging-associated attenuation of insulin-mediated phosphorylation of Akt and Foxo1 in hepatocytes does not occur in hepatic cells lacking PTP1B.
Figure 5. PTP1B deficiency recovers insulin signaling in liver and muscle from 16-month old mice. A.
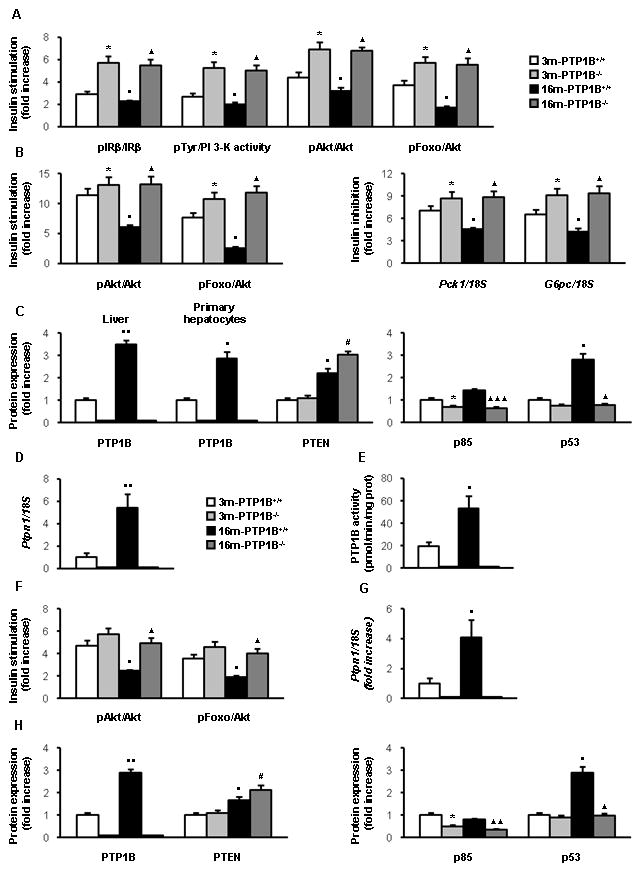
Analysis of insulin response and its signaling pathways in liver from 3m-PTP1B+/+, 3m-PTP1B−/−, 16m-PTP1B+/+ and 16m-PTP1B−/− mice. Quantification of western blot analysis of liver extracts (n=8 per genotype) performed with the indicated antibodies. Quantification of anti-pTyr- associated PI3K activity in liver extracts (n=8 per genotype) (see Fig. S1). B. (left panel) Quantification of western blot analysis of insulin signaling in primary hepatocytes (3 mice per genotype). (right panel) Quantification of the insulin effect on the inhibition of cAMP/Dex-stimulated Pck1 and G6pc mRNA by northern blot analysis in primary hepatocytes (3 mice per genotype). Increased insulin signaling in liver and hepatocytes of 3m-PTP1B−/− compared to 3m-PTP1B+/+ agrees with previous reported data (Haj et al. 2005) (Gonzalez-Rodriguez et al. 2007). C. Quantification of western blot analysis of liver extracts (n=8 per genotype) with the indicated antibodies. PTP1B expression was also analyzed in primary hepatocytes (3 mice per genotype). D. Ptpn1 mRNA levels determined by real-time PCR from livers (n=12 per genotype). E. PTP1B enzymatic activity in liver extracts (n=5 per genotype). F. Analysis of insulin response and its signaling pathways in skeletal muscle from 3m-PTP1B+/+, 3m-PTP1B−/−, 16m-PTP1B+/+ and 16m-PTP1B−/− mice. Quantification of western blot analysis of skeletal muscle extracts with the indicated antibodies (n=6 per genotype). G. Ptpn1 mRNA levels determined by real-time PCR from skeletal muscle (n=12 per genotype). H. Quantification of western blot analysis of skeletal muscle extracts with the indicated antibodies. *p<0.05, 3m-PTP1B−/− vs. 3m-PTP1B+/+; ●p<0.05 and ●●p<0.01, 16m-PTP1B+/+ vs. 3m-PTP1B+/+; ▲p<0.05, ▲▲p<0.01 and ▲▲▲p<0.005, 16m-PTP1B−/− vs. 16m-PTP1B+/+. #p<0.05, 16m-PTP1B−/− vs. 3m-PTP1B−/−.
Next, we investigated possible differences in the ability of insulin to inhibit transcription of Pck1 and G6pc in primary hepatocytes from 16-month old wild-type and PTP1B−/− mice. As shown in the northern blot analysis depicted in Figures 5B and S1, the down-regulation of Pck1 and G6pc mRNAs by insulin was significantly reduced in hepatocytes from 16-month old, obese wild-type mice as compared to the corresponding 3-month old controls. In contrast, the inhibitory effect of insulin on Pck1 and G6pc mRNAs was preserved in hepatocytes from 16-month old, nonobese PTP1B−/− mice.
Differential expression of negative modulators of insulin signaling in the liver of 16-month old, obese wild-type and nonobese PTP1B-deficient mice
We assessed the possibility that the striking differences in insulin signaling between 16-month old obese, wild-type mice and nonobese, PTP1B-deficient mice could reflect differential expression of critical negative modulators of the early steps of insulin signaling. PTP1B was a logical candidate given its ability to directly dephosphorylate the IR (Salmeen et al. 2000). Consistent with its role in regulating insulin sensitivity, PTP1B protein and mRNA levels were significantly up-regulated in the livers of 16-month old, obese wild-type mice compared to mice at 3 months (Fig. 5C, 5D, S1). PTP1B protein levels were also up-regulated in primary hepatocytes from 16-month old, obese wild-type mice as compared to hepatocytes from 3-month control mice (Fig. 5C, S1). Importantly, PTP1B activity was augmented in liver extracts from 16-month old, obese wild-type mice compared with the phosphatase activity of 3-month old mice (Fig. 5E). Regarding other phosphatases that negatively modulate insulin signaling, expression of the phosphatidylinositol phosphatase PTEN was up-regulated in both wild-type and PTP1B−/− mice with aging as compared to 3-month old control mice (Fig. 5C, S1) mice whereas no differences were found in the expression of the tyrosine phosphatase SHP2 (results not shown).
Elevated expression of p85α regulatory subunit of PI 3-kinase induces competition with p85α-p110 dimmers, thereby inhibiting insulin signaling (Mauvais-Jarvis et al. 2002). Thus, p85α constitutes a critical node in the insulin signaling cascade. Levels of p85α were significantly lower in liver extracts from PTP1B−/− mice than those of wild-type mice at both ages. Finally, the expression of p53 was up-regulated in the liver of 16-month old, obese wild-type mice compared to control mice at 3 months but this effect was absent in age-matched nonobese PTP1B−/− mice (Fig 5C, S1).
Elevated expression of negative modulators of insulin signaling in skeletal muscle from 16-month old, obese wild-type mice; protection by PTP1B deficiency
Since we have demonstrated that PTP1B deficiency has beneficial effects on insulin resistance in 16-month old mice (Fig. 1C), the effect of PTP1B-deficiency in insulin signaling in skeletal muscle was evaluated. Insulin-induced Akt/Foxo1 phosphorylation was markedly attenuated in skeletal muscle from 16-month old, obese wild-type mice as compared to mice at 3 months, but was normal in 16-month old, nonobese PTP1B−/− animals (Fig. 5F, S2). Similar to our observations in liver, both mRNA and protein levels of PTP1B increased in skeletal muscle of 16-month old, obese wild-type mice (Fig. 5G, 5H, S2). PTEN was also up-regulated in skeletal muscle of obese wild-type and nonobese PTP1B−/− mice at 16 months as compared to the 3-month old mice of both genotypes (Fig. 5H, S2) whereas no differences were found in the expression of SHP2 (results not shown). Finally, PTP1B deficiency prevented the age-related increase of p53, as well as decreased levels of p85α-PI 3-kinase regulatory subunit in skeletal muscle of 16-month old mice (Fig. 5H, S2).
Effect of PTP1B deficiency on energy expenditure in 16-month-old mice
To determine the cause of decreased adiposity and resistance to age-associated obesity in PTP1B−/− mice, we examined food intake and energy expenditure parameters. No significant differences were found in daily food intake between PTP1B−/− and wild-type animals although there was a trend towards a decrease in PTP1B-deficient mice at both ages (Fig. 6A). These data suggested that energy expenditure (EE) may be increased in 16-month old, nonobese PTP1B−/− mice. Thus, we performed indirect calorimetry to assess EE and substrate oxidation. Oxygen consumption (VO2) was elevated in 16-month old, nonobese PTP1B−/− mice as compared to age matched obese wild-type mice during light and dark cycles albeit significant differences between both genotypes at 3 months were found only in the dark cycle. EE was also increased in 16-month old, nonobese PTP1B-deficient mice compared to obese wild-type mice at the same age during light and dark periods and, similarly, the corresponding values of 3-month old PTP1B−/− mice were statistically significant from the 3-month old wild-type mice only in the dark period. Of note, no differences between genotypes and age were noted in respiratory quotient (RQ) indicating that PTP1B-deficiency does not alter fuel selection between fatty acids and carbohydrate during aging.
Figure 6. Effect of PTP1B deficiency on energy expenditure in 16-month old mice.

Analysis of energy expenditure parameters of 3m-PTP1B+/+, 3m-PTP1B−/−, 16m-PTP1B+/+ and 16m-PTP1B−/− mice A. Daily food intake (n=10 per genotype). RQ, VO2 and EE determined by indirect calorimetry (n=4 per genotype). Increased EE in 3m-PTP1B−/− compared to 3m-PTP1B+/+ agrees with previous data (Klaman et al. 2000). B. Ucp2, Pgc1a, Pgc1b, Ppara and Cpt1a mRNA levels determined by real-time PCR from livers (n=8 per genotype). C. Ucp3, Pgc1a, Pgc1b, Ppara and Cpt1b mRNA levels determined by real-time PCR from skeletal muscles (n=8 per genotype). *p<0.05, 3m-PTP1B−/− vs. 3m-PTP1B+/+; ▲p<0.05, 16m-PTP1B−/− vs. 16m-PTP1B+/+.
Finally, we determined differences in expression levels of genes involved in fatty acid oxidation. In liver (Fig. 6B), there was a significant increase in Ucp2 and Pgc1a levels in mice lacking PTP1B as compared to the wild-type controls at 3 and 16 months. In skeletal muscle, Ucp3 and Pgc1b were increased in 16-month old, nonobese PTP1B−/− mice as compared to the obese wild-type mice of the same age (Fig. 6C).
DISCUSSION
The development of insulin resistance that occurs with aging has been attributed to the increased prevalence of risk factors such as sedentary life-style that leads to obesity (Lechleitner 2008). Since life span is actually extended in Western countries, therapeutic interventions are needed to reduce morbidity and improve quality of life in an elderly population. The present study has demonstrated that deficiency of PTP1B ameliorates peripheral insulin resistance, adiposity, inflammation, hyperleptinemia, hyperinsulinemia and islet hyperplasia in mice at 16 months of age, implicating this enzyme as a key player in the development of obesity-associated metabolic alterations during aging. Importantly, the leanness of 16-month old PTP1B−/− mice is associated with increased whole-body energy expenditure and fatty acid oxidation but not with a reduction of daily food intake.
The molecular mechanisms underlying the association of obesity, insulin resistance and chronic low-grade inflammation during aging are of critical importance for the development of new drugs to treat metabolic diseases in an elderly population. Our data show that fat mass is increased in 16-month old wild-type mice; moreover, we observed enhanced adipocyte hypertrophy, crown-like structures, pro-apoptotic and pro-inflammatory markers in WAT of these mice. Increased expression of pro-inflammatory genes in WAT and up-regulation of PTP1B have been described in mice fed for 20 weeks with HFD. This has been attributed to a TNFα-mediated increase of PTP1B transcription via nuclear factor κB (NFκB) activation (Zabolotny et al. 2008). However, in the present study we did not observe differences in the expression of PTP1B between WAT of 3 and 16-month old wild-type mice maintained on a chow diet (results not shown), although TNFα levels were increased at 16 months of age. This suggests that the pro-inflammatory phenotype of WAT in 16-month old, obese wild-type mice occurs without an elevation of PTP1B. By contrast, mRNA, protein levels and activity of PTP1B were elevated in liver and muscle of wild-type mice at 16 months compared to 3-month old animals, perhaps owing to elevated levels of circulating TNFα. These findings imply that PTP1B expression increases with obesity during aging in a tissue-specific manner. Consistent with this, we have reported that PTP1B plays a prominent role in mediating the deleterious effects of TNFα in skeletal muscle (Nieto-Vazquez et al. 2007). Therefore, the differential effects of age-related obesity on PTP1B expression in these tissues may suggest that WAT PTP1B might not increase in obesity due to compensatory adaptations. Nevertheless, PTP1B deficiency protects from WAT accumulation during aging, thereby preventing the expression and secretion of pro-inflammatory adipokines including TNFα which are associated with pathological changes in peripheral tissues. In agreement with these data, insulin responsiveness of WAT, as assessed by stimulation of glucose transport during the hyperinsulinemic-euglycaemic clamp, is higher in 16-month old, nonobese PTP1B−/− mice as compared to age-matched obese wild-type animals. These results differ from published data (Ruffolo et al. 2007) showing the lack of improvement of insulin signaling in adipocytes from 16-week old PTP1B−/− mice. This was due to increased basal S6K1 activity which leads to IRS1 serine phosphorylation and disruption of PI 3-kinase activation, thereby limiting the effects of insulin on fatty acid uptake and lipolysis (Um et al. 2004). The age of the study animals might account for the differences obtained between this study (Ruffolo et al. 2007) and our present data. Our results demonstrate that the enhanced insulin sensitivity of WAT from 16-month old PTP1B−/− mice correlates with protection against inflammation and apoptotic-like features. Of note, PTP1B deficiency also conferred protection against the decrease of glucose uptake in BAT, suggesting its involvement in modulating insulin actions during age-related obesity in both types of fat.
The development of hypoxia in WAT has been described in genetic models of obesity in rodents (Ye et al. 2007), (Rausch et al. 2008). In vitro, overexpression of HIF1α impairs insulin signaling in 3T3L1 and human adipocytes (Regazzetti et al. 2010). In light of these data, our study suggests that fat accumulation during aging is associated with increased expression of HIF1α which is prevented by PTP1B deficiency. Since hypoxia increases oxidative stress which, in turn, attracts macrophages and exacerbates inflammation (Rausch et al. 2008), inhibition of PTP1B might provide therapeutic benefit for insulin resistance and obesity.
Recent evidence suggests a potential relationship between cellular aging signals in adipose tissue and metabolic disorders. In this regard, Minamino et al. (Minamino et al. 2009) have shown that excess caloric intake promotes senescence-like changes in adipose tissue of young mice including increased oxidative stress and the expression of the tumor suppressor p53. Indeed, our results demonstrate clearly that p53 protein levels increase in WAT, liver and skeletal muscle of 16-month old wild-type mice but not in mice lacking PTP1B. Given that PTP1B-deficent mice do not develop obesity with age, our findings suggest that preservation of normal p53 expression in insulin sensitive tissues is related to their lean phenotype.
Elevation in circulating fatty acids and pro-inflammatory adipokines which originate from WAT reduces insulin sensitivity in liver and skeletal muscle (Olefsky 2008). However, the molecular mechanisms underlying this deleterious cross-talk are currently not well understood. Adipose tissue inflammation has been correlated with hepatic steatosis in humans (Cancello et al. 2006). In our study, the presence of obesity-induced inflammatory milieu was manifested by accumulation of TG and marked increases in JNK, c-Jun and p38 MAPK phosphorylation in livers of 16-month wild-type mice. Activation of these stress kinases has been described in primary hepatocytes stimulated with palmitate (Akazawa et al. 2010) or TNFα (Gonzalez-Rodriguez et al. 2009) and negatively modulates insulin signaling (Aguirre et al. 2000). Consequently, in the liver of 16-month old, obese wild-type mice, hepatic insulin action, including inhibition of gluconeogenic genes Pck1 and G6pc, was impaired. As stated above, PTP1B expression and activity were elevated in the livers and primary hepatocytes of 16-month old, obese wild-type mice, most likely owing to elevated inflammation. Thus, in these mice, the negative cross-talk on insulin signaling elicited by JNK on IRSs proteins and by PTP1B on the IR might synergize to induce hepatic insulin resistance. Ablation of PTP1B is associated with reduced activation of stress kinases, decreased lipogenic gene expression and fatty liver and recovery of hepatic insulin sensitization. Likewise, in skeletal muscle obesity-mediated impairment of insulin signaling during aging was reverted in PTP1B-deficient mice. Collectively our results demonstrated that the obesity-related inflammation and insulin resistance which generate a negative endocrine cross-talk between WAT and peripheral tissues during aging (Olefsky 2008), (Olefsky & Glass 2010) are prevented by inhibition of PTP1B. Moreover, our observations suggest that the positive effects of PTP1B deficiency on inflammation and insulin resistance are due to the prevention of obesity through increased energy expenditure which may reflect the enhanced sensitivity to leptin in the hypothalamus of these mice (Klaman et al. 2000). We observed a small decline of glucose infusion rate during the clamp study in 16-month versus 3-month old PTP1B-deficient mice, suggesting an effect of aging, independent of obesity, on whole body insulin sensitivity. However, none of the tissue-specific measures of insulin action (glucose uptake in skeletal muscle and fat) were significantly different between the two PTP1B-deficient age groups of mice. On the other hand, since PTP1B is a critical negative modulator of the insulin signaling cascade, a direct role of PTP1B on insulin signaling pathways in the liver, skeletal muscle and brain should also not be excluded.
EXPERIMENTAL PROCEDURES
Reagents
Fetal serum (FS) and culture media were obtained from Invitrogen. Insulin for cell culture (I-0516) was from Sigma Aldrich. Human regular insulin for animal experiments (Actrapid, 775502) was purchased from Novo Nordisk. Protein A-agarose was from Roche Applied Science. [γ32P]-ATP (3000 Ci/mmol), [α32P]-dCTP (3000 Ci/mmol) and cDNA labeling kit were from GE Healthcare.
Antibodies
Anti-phospho-Foxo1 (Ser 256) (#9461), anti-phospho-Akt (Thr308) (#2965), anti-Akt (#9272), anti-phospho JNK (Thr183/Tyr185) (#4668), anti-phospho-c-Jun (Ser73) (#9164), anti-phospho p38 MAPK (Thr180/Tyr182) (#9211) and anti-p38 MAPK (#9212) antibodies were from Cell Signaling Technology. Anti-Bid (Ref. AF860) antibody was from R&D Systems. Anti-FasL (Ref. 610410) and Anti-HIF1α (Ref. 610959) antibodies were from BD Biosciences PharMingen (San Diego, CA). The anti-phospho-Akt (Ser473) (sc-7985), anti-PTEN A2B1 (sc-7974), anti-IR β (sc-711), anti-phospho-IR β (Tyr1162/Tyr1163) (sc-25103-R), anti-JNK (sc-571), anti-c-Jun (sc-45) and anti-phospho-Tyr for immunoprecipitations (Py20, sc-508) antibodies were from Santa Cruz Biotechnology. The anti-IRS1 (06-248), anti-p85α (06-195), anti-PTP1B (07-088), anti-phospho-IRS1 (Ser307) (07-247), anti-phospho-Tyr (clone 4G10, 05-321) and anti-SHP2 (06-118), antibodies were obtained from Upstate (Millipore). The anti-p53 antibody (Ref. OP03) was from Calbiochem or Cell Signalling (#2524). The anti-β-actin antibody (A-5441) was from Sigma-Aldrich.
Animals
Wild-type (PTP1B+/+) and PTP1B-deficient (PTP1B−/−) mice were obtained from Abbot Laboratories as previously described (Klaman et al. 2000), (Nieto-Vazquez et al. 2007), (Gonzalez-Rodriguez et al. 2010). 3-month old PTP1B+/+ (3m-PTP1B+/+), 3-month old PTP1B−/− (3m-PTP1B−/−), 16-month old PTP1B+/+ (16m-PTP1B+/+) and 16-month old PTP1B−/− mice (16m-PTP1B−/−) were used throughout this study. Mice were maintained on the same mixed genetic background (C57Bl/6J x 129Sv/J), fed a standard chow diet ad libitum and had free access to drinking water. All animal experimentation was conducted in accordance with accepted standards of animal care.
Metabolic measurements
For measuring fed and fasted (20–24 h fast) glucose levels, blood was obtained from the tail vein and glucose concentrations were measured with an Accu-Check Aviva glucometer (Roche). Intraperitoneal glucose tolerance tests (GTT) were performed on mice fasted for 20–24 h and injected with 2 g D-glucose/kg. Blood glucose was measured at 30, 60, 90 and 120 min after injection. Intraperitoneal insulin tolerance tests (ITT) were performed on 4 h fasted mice injected with 0.75 U/kg human regular insulin and blood glucose was measured at 15, 30, 45, 60 and 120 min after injection. Animals were subjected to DEXA scan analysis in fed conditions to avoid weight loss induced by overnight fasting. Animals were weighed and sedated under isoflurane anesthesia and scanned in toto using a small animal DEXA scanner (pDEXA, Norland Stratec Medizintechinik GmbH, Birkenfeld, Germany). This study was performed at the NMR Unit (Complutense University, Spain). Fat and lean mass were measured on anesthetized mice using an EchoMRI-100 analyzer (Echo Medical Systems, Houston, TX). Data were analyzed by the software supplied by the manufacturer.
Hyperinsulinemic-euglycemic clamp
This study was performed at the UMass Mouse Phenotyping Center and approved by UMass Medical School IACUC. After an overnight fast, a 2-hr hyperinsulinemic-euglycemic clamp was conducted in awake mice with a continuous insulin infusion rate of 2.5 mU/kg/min (Kim et al. 2004). Basal and insulin-stimulated whole-body glucose turnover were estimated using a continuous infusion of [3-3H] glucose (PerkinElmer, Boston, MA) for 2 h before the clamps (0.05 μCi/min) and throughout the clamps (0.1 μCi/min), respectively. Whole-body glycogen synthesis is calculated as the difference between whole-body glucose turnover and glycolysis. To estimate insulin-stimulated glucose uptake in individual tissues, 2-deoxy-D-[1-14C] glucose (2-[14C] DG; PerkinElmer) was administered as a bolus (10 μCi) at 75 min after the start of the clamps. At the end of the clamp, tissues (gastrocnemius, white and brown adipose and liver) were taken for biochemical analysis.
Indirect calorimetry
Indirect calorimetry was performed following standard methods using Oxylet System metabolic chambers (Panlab Harvard Apparatus) at the Phenotyping Unit (IIS Aragon, Spain). Mice were in the measurement cages 12 hr previous to data recording. Room temperature was 23°C and light/dark cycles were of 12 h. Volume of consumed O2 (VO2) and eliminated CO2 (VCO2) were recorded every 24 min. Respiratory Quotient (RQ) was calculated as: RQ=VCO2/VO2. Energy Expenditure (EE) was calculated as: EE= (3.815+(1.232xRQ)) x VO2 x 1.44). Daily body weight and food intake were manually measured.
Insulin signaling studies
4-h fasted mice were intraperitoneally injected with PBS or 0.75 U/kg of human regular insulin and killed 15 min later. Then, peripheral tissues (liver, muscle –gastrocnemius- and epididymal white adipose tissue (WAT)) were removed and total protein extracts were prepared as previously described (Gonzalez-Rodriguez et al. 2010).
Primary culture of adult hepatocytes
Hepatocytes were isolated from non-fasting male mice by perfusion with collagenase as described (Benveniste et al. 1998), (Gonzalez-Rodriguez et al. 2010). Cells were plated in 60-mm dishes (Falcon, BD biosciences) and cultured in William’s E medium supplemented with 20 ng/ml EGF, 100 U/ml penicillin, 100 μg/ml streptomycin and 10% FS for 48 h. Cells were serum starved for 4–6 h and further stimulated with 1 or 10 nM insulin for 10 min.
RNA extraction from primary hepatocytes and northern blot analysis
Primary hepatocytes were cultured in serum-free medium for 4–6 h and further stimulated with dex/cAMP (0.5 mM dibutyril cAMP plus 1 μM dexamethasone) in the absence or presence of insulin (10 nM) for 6 h. At the end of the culture time, RNA was isolated and submitted to Northern blot analysis. Total RNA was isolated from primary hepatocytes with Trizol (Invitrogen) and submitted to northern blot analysis as previously described (Valverde et al. 2003), (Gonzalez-Rodriguez et al. 2010). Blots were hybridized with cDNA probes for Pck1 and G6pc. Membranes were subjected to autoradiography and relative quantification of the hybridization signals was performed by densitometric scanning of the autoradiograms.
Analysis of serum cytokines and hormones
Serum analysis was performed as described (Banno et al. 2010). Serum IL6 and TNFα were measured using the Multiplex Kit (Linco, Millipore) following manual instructions. Serum insulin, leptin, resistin and adiponectin were determined by ELISA (Linco, Millipore) following manual instructions.
Determination of triglyceride (TG) levels
TG levels were determined in plasma and liver extracts by enzymatic methods with specific kits from Biosystems (Barcelona, Spain).
Preparation of tissue extracts, immunoprecipitation, PI 3-kinase activity and western blot
All these methods have been previously described (Valverde et al. 1997).
PTP1B phosphatase activity
PTP1B phosphatase activity was determined by measuring phosphate release using a synthetic monophosphotyrosyl-containing peptide and the malachite green assay (Millipore) as previously described (Gonzalez-Rodriguez et al. 2010).
Quantitative real-time PCR analysis and primer sequence
Total RNA extraction from islets was performed with an RNAspin kit (HealthCare) and from liver, muscle and epididymal fat pads with Trizol (Invitrogen). Total RNA was reverse transcribed using a SuperScript™ III First-Strand Synthesis System for qPCR following manufacturer’s indications (Invitrogen). qPCR was performed with an ABI 7900 sequence detector using the SyBr Green method and d(N)6 random hexamer with the primers indicated. The primers used in the real time RT–PCR were the following:
Tnf, Fw 5′CATCTTCTCAAAATTCGAGTGA3′ and Rv 5′TGGGAGTAGACAAGGTACAAC3′
F4/80, Fw 5′CTTTGGCTATGGGCTTCCAGTC3′ and Rv 5′GCAAGGAGGACAGAGTTTATCGTG3′
Cd68, Fw 5′CAAGGTCCAGGGAGGTTGTG3′ and Rv 5′CCAAAGGTAAGCTGTCCATAAGGA3′
Cd11c, Fw 5′GCCCAGGGATATGTTCACAGC3′ and Rv 5′ACACAGTGTGCTCCAGTATGA3′
Fasn, Fw 5 ′GCCCAGACAGAGAAGAGGCA3 ′ and Rv 5′CTGACTCGGGCAACTTCCC3′
Serbf1, Fw 5′TAGAGCATATCCCCCAGGTG3′ and Rv 5′GGTACGGGCCACAAGAAGTA3′
Ucp2, Fw 5′GATCTCATCACTTTCCCTCTGGATA3′ and Rv 5′CCCTTGACTCTCCCCTTGG3′
Ucp3, Fw 5′ACTCCAGCGTCGCCATCAGGATTCT3′ and Rv 5′TAAACAGGTGAGACTCCAGCAACTT3′
Pgc1a, Fw 5′AAGTGTGGAACTCTCTGGAACTG3′ and Rv 5′GGGTTATCTTGGTTGGCTTTATG3′
Pgc1b, Fw 5 ′ GCTCTGACGCTCTGAAGGAC3 ′ and Rv 5 ′ AAGGGCTTGGGCAATCCTC3′
Ppara, Fw 5′AGAGCCCCATCTGTCCTCTC3′ and Rv 5′ ACTGGTAGTCTGCAAAACCAAA3′
Cpt1a, Fw 5′TCAATCGGACCCTAGACACC3′ and Rv 5′ CTTTCGACCCGAGAAGACCT3′
Cpt1b, Fw 5′CAAGTCATGGTGGGCAACTA3′ and Rv 5′GCTGCTTGCACATTTGTGTT3′
18s, Fw 5 ′AGTCCCTGCCCTTTGTACACA3 ′ and Rv 5 ′ GCCTCACTAAACCATCCAATCG3′
Primer-probe sets for mouse Ptpn1 was purchased as predesigned TaqMan gene expression assays and run as per the manufacturer’s instructions (Applied Biosystems).
Islet morphometry, immunohistochemistry and immunofluorescence
Pancreata were fixed with 4% paraformaldehyde and cryoprotected in PBS containing 30% sucrose. Cryostat sections (10 μm) were cut and kept at −80 °C until used. Sections were brought to room temperature, permeabilized with methanol for 2 min at −20 °C and stained with cresyl-violet. Islets area was measured by acquiring images at 40X from adjacent nonoverlapping images of sections using a Nikon Eclipse 90i microscope. Islets area was analyzed with the Image J software. For insulin immunostaining, sections were treated with 5% normal goat serum and incubated with a guinea pig anti-human insulin antibody (Linco Research, St. Charles, MO). Immunodetection was carried out with a goat anti-guinea pig fluorescence-tagged antibody. Images were taken using a Leica TCS SP5 confocal microscope. PTP1B staining was performed as previously described in (Gonzalez-Rodriguez et al. 2010). The protocol for islet isolation is detailed in (Hennige et al. 2003).
Liver histology
Samples of liver were fixed with 4% paraformaldehyde and cryoprotected in PBS containing 30% sucrose. Cryostat sections (10 μm) were cut and kept at −80 °C until used. Liver sections were stained with Hematoxylin & Eosin and Oil red O.
Statistical analysis
The data are presented as the mean ± SEM. Statistical analysis was carried out with SPSS (v.12) software. The statistical significance was estimated with a multivariate analysis of variance (ANOVA) or 2-tailed-Student’s t test in hyperinsulinemic-euglycemic clamp studies. Statistical significance was considered at p<0.05.
Supplementary Material
Acknowledgments
This work was supported by grants from Ministerio de Ciencia e Innovación (Spain) SAF2009-08114 and (to A.M.V.), BFU2008-04901-C03-02 and 03 (to M.R and J.M.C., respectively), BFU2008-01283 (to M.V) and Centro de Investigación Biomedica en Red de Diabetes y Enfermedades Metabólicas Asociadas (CIBERDEM) (Instituto Salud Carlos III). CBMSO is recipient of institutional aid from Ramon Areces Foundation. We also acknowledge grants NIH-R01 DK080756, ADA 7-07-RA-80 and NIH U24-DK093000 (to J.K.K.) and UMass Mouse Phenotyping Center supported by UMass Diabetes and Endocrinology Research Center Grant (DK32520). We would like to thank S. Kinicki and L.Li for assisting in the clamp study and D. Burks (CIPF, Spain) for critical reading of the manuscript and english editing. A.G.-R., A.F.-P and M.M. hold postdoctoral contracts from CIBERDEM.
Footnotes
No potential conflicts of interest relevant to this article were reported.
AUTHOR CONTRIBUTIONS
A.G-R. researched, analyzed and discussed data and wrote manuscript, J.A.M-G. researched data and analyzed data, M.M. researched and analyzed data, A.F-P. researched and analyzed data, Y.J.L researched data, H.J.K researched data, J.K.K analyzed and discussed data and reviewed/edited manuscript, E.R. researched data, J.M.C researched, analyzed and discussed data and reviewed/edited manuscript, M.R. analyzed and discussed data and reviewed/edited manuscript, M.V. analyzed and discussed data and reviewed/edited manuscript, C.M.R reviewed manuscript, A.M.V. designed the study, researched, analyzed and discussed data and wrote manuscript.
References
- Aguirre V, Uchida T, Yenush L, Davis R, White MF. The c-Jun NH(2)-terminal kinase promotes insulin resistance during association with insulin receptor substrate-1 and phosphorylation of Ser(307) J Biol Chem. 2000;275:9047–9054. doi: 10.1074/jbc.275.12.9047. [DOI] [PubMed] [Google Scholar]
- Akazawa Y, Cazanave S, Mott JL, Elmi N, Bronk SF, Kohno S, Charlton MR, Gores GJ. Palmitoleate attenuates palmitate-induced Bim and PUMA up-regulation and hepatocyte lipoapoptosis. J Hepatol. 2010;52:586–593. doi: 10.1016/j.jhep.2010.01.003. [DOI] [PMC free article] [PubMed] [Google Scholar]
- Amati F, Dube JJ, Coen PM, Stefanovic-Racic M, Toledo FG, Goodpaster BH. Physical inactivity and obesity underlie the insulin resistance of aging. Diabetes Care. 2009;32:1547–1549. doi: 10.2337/dc09-0267. [DOI] [PMC free article] [PubMed] [Google Scholar]
- Banno R, Zimmer D, De Jonghe BC, Atienza M, Rak K, Yang W, Bence KK. PTP1B and SHP2 in POMC neurons reciprocally regulate energy balance in mice. J Clin Invest. 2010;120:720–734. doi: 10.1172/JCI39620. [DOI] [PMC free article] [PubMed] [Google Scholar]
- Barbieri M, Rizzo MR, Manzella D, Paolisso G. Age-related insulin resistance: is it an obligatory finding? The lesson from healthy centenarians. Diabetes Metab Res Rev. 2001;17:19–26. doi: 10.1002/dmrr.178. [DOI] [PubMed] [Google Scholar]
- Benveniste RJ, Thor S, Thomas JB, Taghert PH. Cell type-specific regulation of the Drosophila FMRF-NH2 neuropeptide gene by Apterous, a LIM homeodomain transcription factor. Development. 1998;125:4757–4765. doi: 10.1242/dev.125.23.4757. [DOI] [PubMed] [Google Scholar]
- Cancello R, Tordjman J, Poitou C, Guilhem G, Bouillot JL, Hugol D, Coussieu C, Basdevant A, Bar Hen A, Bedossa P, Guerre-Millo M, Clement K. Increased infiltration of macrophages in omental adipose tissue is associated with marked hepatic lesions in morbid human obesity. Diabetes. 2006;55:1554–1561. doi: 10.2337/db06-0133. [DOI] [PubMed] [Google Scholar]
- Delibegovic M, Zimmer D, Kauffman C, Rak K, Hong EG, Cho YR, Kim JK, Kahn BB, Neel BG, Bence KK. Liver-specific deletion of protein-tyrosine phosphatase 1B (PTP1B) improves metabolic syndrome and attenuates diet-induced endoplasmic reticulum stress. Diabetes. 2009;58:590–599. doi: 10.2337/db08-0913. [DOI] [PMC free article] [PubMed] [Google Scholar]
- Elchebly M, Payette P, Michaliszyn E, Cromlish W, Collins S, Loy AL, Normandin D, Cheng A, Himms-Hagen J, Chan CC, Ramachandran C, Gresser MJ, Tremblay ML, Kennedy BP. Increased insulin sensitivity and obesity resistance in mice lacking the protein tyrosine phosphatase-1B gene. Science. 1999;283:1544–1548. doi: 10.1126/science.283.5407.1544. [DOI] [PubMed] [Google Scholar]
- Escriva F, Gavete ML, Fermin Y, Perez C, Gallardo N, Alvarez C, Andres A, Ros M, Carrascosa JM. Effect of age and moderate food restriction on insulin sensitivity in Wistar rats: role of adiposity. J Endocrinol. 2007;194:131–141. doi: 10.1677/joe.1.07043. [DOI] [PubMed] [Google Scholar]
- Fink RI, Kolterman OG, Griffin J, Olefsky JM. Mechanisms of insulin resistance in aging. J Clin Invest. 1983;71:1523–1535. doi: 10.1172/JCI110908. [DOI] [PMC free article] [PubMed] [Google Scholar]
- Gonzalez-Rodriguez A, Alba J, Zimmerman V, Kozma SC, Valverde AM. S6K1 deficiency protects against apoptosis in hepatocytes. Hepatology. 2009;50:216–229. doi: 10.1002/hep.22915. [DOI] [PMC free article] [PubMed] [Google Scholar]
- Gonzalez-Rodriguez A, Clampit JE, Escribano O, Benito M, Rondinone CM, Valverde AM. Developmental switch from prolonged insulin action to increased insulin sensitivity in protein tyrosine phosphatase 1B-deficient hepatocytes. Endocrinology. 2007;148:594–608. doi: 10.1210/en.2006-0644. [DOI] [PubMed] [Google Scholar]
- Gonzalez-Rodriguez A, Mas Gutierrez JA, Sanz-Gonzalez S, Ros M, Burks DJ, Valverde AM. Inhibition of PTP1B restores IRS1-mediated hepatic insulin signaling in IRS2-deficient mice. Diabetes. 2010;59:588–599. doi: 10.2337/db09-0796. [DOI] [PMC free article] [PubMed] [Google Scholar]
- Haj FG, Zabolotny JM, Kim YB, Kahn BB, Neel BG. Liver-specific protein-tyrosine phosphatase 1B (PTP1B) re-expression alters glucose homeostasis of PTP1B−/− mice. J Biol Chem. 2005;280:15038–15046. doi: 10.1074/jbc.M413240200. [DOI] [PubMed] [Google Scholar]
- Hennige AM, Burks DJ, Ozcan U, Kulkarni RN, Ye J, Park S, Schubert M, Fisher TL, Dow MA, Leshan R, Zakaria M, Mossa-Basha M, White MF. Upregulation of insulin receptor substrate-2 in pancreatic beta cells prevents diabetes. J Clin Invest. 2003;112:1521–1532. doi: 10.1172/JCI18581. [DOI] [PMC free article] [PubMed] [Google Scholar]
- Kasibhatla B, Wos J, Peters KG. Targeting protein tyrosine phosphatase to enhance insulin action for the potential treatment of diabetes. Curr Opin Investig Drugs. 2007;8:805–813. [PubMed] [Google Scholar]
- Kim HJ, Higashimori T, Park SY, Choi H, Dong J, Kim YJ, Noh HL, Cho YR, Cline G, Kim YB, Kim JK. Differential effects of interleukin-6 and -10 on skeletal muscle and liver insulin action in vivo. Diabetes. 2004;53:1060–1067. doi: 10.2337/diabetes.53.4.1060. [DOI] [PubMed] [Google Scholar]
- Kipfer-Coudreau S, Eberle D, Sahbatou M, Bonhomme A, Guy-Grand B, Froguel P, Galan P, Basdevant A, Clement K. Single nucleotide polymorphisms of protein tyrosine phosphatase 1B gene are associated with obesity in morbidly obese French subjects. Diabetologia. 2004;47:1278–1284. doi: 10.1007/s00125-004-1432-5. [DOI] [PubMed] [Google Scholar]
- Klaman LD, Boss O, Peroni OD, Kim JK, Martino JL, Zabolotny JM, Moghal N, Lubkin M, Kim YB, Sharpe AH, Stricker-Krongrad A, Shulman GI, Neel BG, Kahn BB. Increased energy expenditure, decreased adiposity, and tissue-specific insulin sensitivity in protein-tyrosine phosphatase 1B-deficient mice. Mol Cell Biol. 2000;20:5479–5489. doi: 10.1128/mcb.20.15.5479-5489.2000. [DOI] [PMC free article] [PubMed] [Google Scholar]
- Kushner JA, Haj FG, Klaman LD, Dow MA, Kahn BB, Neel BG, White MF. Islet-sparing effects of protein tyrosine phosphatase-1b deficiency delays onset of diabetes in IRS2 knockout mice. Diabetes. 2004;53:61–66. doi: 10.2337/diabetes.53.1.61. [DOI] [PubMed] [Google Scholar]
- Lechleitner M. Obesity and the metabolic syndrome in the elderly--a mini-review. Gerontology. 2008;54:253–259. doi: 10.1159/000161734. [DOI] [PubMed] [Google Scholar]
- Mauvais-Jarvis F, Ueki K, Fruman DA, Hirshman MF, Sakamoto K, Goodyear LJ, Iannacone M, Accili D, Cantley LC, Kahn CR. Reduced expression of the murine p85alpha subunit of phosphoinositide 3-kinase improves insulin signaling and ameliorates diabetes. J Clin Invest. 2002;109:141–149. doi: 10.1172/JCI13305. [DOI] [PMC free article] [PubMed] [Google Scholar]
- Minamino T, Orimo M, Shimizu I, Kunieda T, Yokoyama M, Ito T, Nojima A, Nabetani A, Oike Y, Matsubara H, Ishikawa F, Komuro I. A crucial role for adipose tissue p53 in the regulation of insulin resistance. Nat Med. 2009;15:1082–1087. doi: 10.1038/nm.2014. [DOI] [PubMed] [Google Scholar]
- Nieto-Vazquez I, Fernandez-Veledo S, de Alvaro C, Rondinone CM, Valverde AM, Lorenzo M. Protein-tyrosine phosphatase 1B-deficient myocytes show increased insulin sensitivity and protection against tumor necrosis factor-alpha-induced insulin resistance. Diabetes. 2007;56:404–413. doi: 10.2337/db06-0989. [DOI] [PubMed] [Google Scholar]
- Olefsky JM. Fat talks, liver and muscle listen. Cell. 2008;134:914–916. doi: 10.1016/j.cell.2008.09.001. [DOI] [PubMed] [Google Scholar]
- Olefsky JM, Glass CK. Macrophages, inflammation, and insulin resistance. Annu Rev Physiol. 2010;72:219–246. doi: 10.1146/annurev-physiol-021909-135846. [DOI] [PubMed] [Google Scholar]
- Quinn LS, Anderson BG, Strait-Bodey L, Wolden-Hanson T. Serum and muscle interleukin-15 levels decrease in aging mice: correlation with declines in soluble interleukin-15 receptor alpha expression. Exp Gerontol. 2010;45:106–112. doi: 10.1016/j.exger.2009.10.012. [DOI] [PMC free article] [PubMed] [Google Scholar]
- Rausch ME, Weisberg S, Vardhana P, Tortoriello DV. Obesity in C57BL/6J mice is characterized by adipose tissue hypoxia and cytotoxic T-cell infiltration. Int J Obes (Lond) 2008;32:451–463. doi: 10.1038/sj.ijo.0803744. [DOI] [PubMed] [Google Scholar]
- Regazzetti C, Bost F, Le Marchand-Brustel Y, Tanti JF, Giorgetti-Peraldi S. Insulin induces REDD1 expression through hypoxia-inducible factor 1 activation in adipocytes. J Biol Chem. 2010;285:5157–5164. doi: 10.1074/jbc.M109.047688. [DOI] [PMC free article] [PubMed] [Google Scholar]
- Ruffolo SC, Forsell PK, Yuan X, Desmarais S, Himms-Hagen J, Cromlish W, Wong KK, Kennedy BP. Basal activation of p70S6K results in adipose-specific insulin resistance in protein-tyrosine phosphatase 1B −/− mice. J Biol Chem. 2007;282:30423–30433. doi: 10.1074/jbc.M700697200. [DOI] [PubMed] [Google Scholar]
- Sabio G, Cavanagh-Kyros J, Ko HJ, Jung DY, Gray S, Jun JY, Barrett T, Mora A, Kim JK, Davis RJ. Prevention of steatosis by hepatic JNK1. Cell Metab. 2009;10:491–498. doi: 10.1016/j.cmet.2009.09.007. [DOI] [PMC free article] [PubMed] [Google Scholar]
- Salmeen A, Andersen JN, Myers MP, Tonks NK, Barford D. Molecular basis for the dephosphorylation of the activation segment of the insulin receptor by protein tyrosine phosphatase 1B. Mol Cell. 2000;6:1401–1412. doi: 10.1016/s1097-2765(00)00137-4. [DOI] [PubMed] [Google Scholar]
- Schenk S, Saberi M, Olefsky JM. Insulin sensitivity: modulation by nutrients and inflammation. J Clin Invest. 2008;118:2992–3002. doi: 10.1172/JCI34260. [DOI] [PMC free article] [PubMed] [Google Scholar]
- Seely BL, Staubs PA, Reichart DR, Berhanu P, Milarski KL, Saltiel AR, Kusari J, Olefsky JM. Protein tyrosine phosphatase 1B interacts with the activated insulin receptor. Diabetes. 1996;45:1379–1385. doi: 10.2337/diab.45.10.1379. [DOI] [PubMed] [Google Scholar]
- Taniguchi CM, Emanuelli B, Kahn CR. Critical nodes in signalling pathways: insights into insulin action. Nat Rev Mol Cell Biol. 2006;7:85–96. doi: 10.1038/nrm1837. [DOI] [PubMed] [Google Scholar]
- Tchkonia T, Morbeck DE, Von Zglinicki T, Van Deursen J, Lustgarten J, Scrable H, Khosla S, Jensen MD, Kirkland JL. Fat tissue, aging, and cellular senescence. Aging Cell. 2010;9:667–684. doi: 10.1111/j.1474-9726.2010.00608.x. [DOI] [PMC free article] [PubMed] [Google Scholar]
- Um SH, Frigerio F, Watanabe M, Picard F, Joaquin M, Sticker M, Fumagalli S, Allegrini PR, Kozma SC, Auwerx J, Thomas G. Absence of S6K1 protects against age- and diet-induced obesity while enhancing insulin sensitivity. Nature. 2004;431:200–205. doi: 10.1038/nature02866. [DOI] [PubMed] [Google Scholar]
- Valverde AM, Burks DJ, Fabregat I, Fisher TL, Carretero J, White MF, Benito M. Molecular mechanisms of insulin resistance in IRS-2-deficient hepatocytes. Diabetes. 2003;52:2239–2248. doi: 10.2337/diabetes.52.9.2239. [DOI] [PubMed] [Google Scholar]
- Valverde AM, Lorenzo M, Navarro P, Benito M. Phosphatidylinositol 3-kinase is a requirement for insulin-like growth factor I-induced differentiation, but not for mitogenesis, in fetal brown adipocytes. Mol Endocrinol. 1997;11:595–607. doi: 10.1210/mend.11.5.9924. [DOI] [PubMed] [Google Scholar]
- Wueest S, Rapold RA, Schumann DM, Rytka JM, Schildknecht A, Nov O, Chervonsky AV, Rudich A, Schoenle EJ, Donath MY, Konrad D. Deletion of Fas in adipocytes relieves adipose tissue inflammation and hepatic manifestations of obesity in mice. J Clin Invest. 2010;120:191–202. doi: 10.1172/JCI38388. [DOI] [PMC free article] [PubMed] [Google Scholar]
- Ye J, Gao Z, Yin J, He Q. Hypoxia is a potential risk factor for chronic inflammation and adiponectin reduction in adipose tissue of ob/ob and dietary obese mice. Am J Physiol Endocrinol Metab. 2007;293:E1118–1128. doi: 10.1152/ajpendo.00435.2007. [DOI] [PubMed] [Google Scholar]
- Zabolotny JM, Bence-Hanulec KK, Stricker-Krongrad A, Haj F, Wang Y, Minokoshi Y, Kim YB, Elmquist JK, Tartaglia LA, Kahn BB, Neel BG. PTP1B regulates leptin signal transduction in vivo. Dev Cell. 2002;2:489–495. doi: 10.1016/s1534-5807(02)00148-x. [DOI] [PubMed] [Google Scholar]
- Zabolotny JM, Kim YB, Welsh LA, Kershaw EE, Neel BG, Kahn BB. Protein-tyrosine phosphatase 1B expression is induced by inflammation in vivo. J Biol Chem. 2008;283:14230–14241. doi: 10.1074/jbc.M800061200. [DOI] [PMC free article] [PubMed] [Google Scholar]
Associated Data
This section collects any data citations, data availability statements, or supplementary materials included in this article.