

Abstract
This functional magnetic resonance imaging study compared the neural activation patterns of 18 high-functioning individuals with autism and 18 IQ-matched neurotypical control participants as they learned to perform a social judgment task. Participants learned to identify liars among pairs of computer-animated avatars uttering the same sentence but with different facial and vocal expressions, namely those that have previously been associated with lying versus truth-telling. Despite showing a behavioral learning effect similar to the control group, the autism group did not show the same pattern of decreased activation in cortical association areas as they learned the task. Furthermore, the autism group showed a significantly smaller increase in interregion synchronization of activation (functional connectivity) with learning than did the control group. Finally, the autism group had decreased structural connectivity as measured by corpus callosum size, and this measure was reliably related to functional connectivity measures. The findings suggest that cortical underconnectivity in autism may constrain the ability of the brain to rapidly adapt during learning.
Keywords: autism, functional connectivity, functional magnetic resonance imaging, learning, social cognition
Introduction
Although high-functioning autism and other autism spectrum disorders (ASDs) are often associated with atypical social processing, of equal importance are the learning processes through which social processing is established. Impaired learning in autism has been reported in a number of behavioral studies in a variety of tasks, including procedural learning (Mostofsky et al. 2000) and perceptual learning (Plaisted et al. 1998). Moreover, functional brain imaging studies of autism have found systematic differences in neural functioning that could plausibly underpin differences in the learning process. In particular, the underconnectivity theory of autism (Just et al. 2004, 2007), which posits a reduced communication bandwidth (rate of information transfer) between frontal and posterior cortical areas, may also account for learning differences in autism. The underconnectivity theory arose from and is supported by observations of decreased synchronization of activation (functional connectivity) among anterior and posterior cortical and subcortical areas, as measured by functional magnetic resonance imaging (fMRI), in a wide variety of tasks, including sentence comprehension (Just et al. 2004; Kana et al. 2006), executive functioning (Just et al. 2007), theory of mind processing and self-related mentalization (Mason et al. 2008; Kana et al. 2009; Lombardo et al. 2010), working memory (Koshino et al. 2005, 2008), face processing (Kleinhans et al. 2008; Koshino et al. 2008; Wicker et al. 2008), response inhibition (Kana et al. 2007; Solomon et al. 2009; Agam et al. 2010), complex visuospatial processing (Kana et al. 2006; Damarla et al. 2010), and even simple motor tasks (Mostofsky et al. 2009).
The underconnectivity theory is also supported by evidence of disrupted structural connectivity in autism as measured by an abnormal distribution of white matter (Courchesne et al. 2001; Herbert et al. 2004), decreased corpus callosum size (Chung et al. 2004; Frazier and Hardan 2009), and microstructural deficits in frontal areas measured with diffusion-weighted imaging (e.g., Barnea-Goraly et al. 2004; Alexander et al. 2007; Keller et al. 2007; Sundaram et al. 2008) or by postmortem histological examination (e.g., Zikopoulos and Barbas 2010).
In neurotypical individuals, one of the neural signatures of a cortical system “learning” (demonstrating enhanced performance with repetition) is a systematic increase in functional connectivity among some of the key areas involved in the task performance (Büchel et al. 1999; Toni et al. 2002). To date, the implications of cortical underconnectivity in autism for such learning have not been investigated. Here, we examined the neural activation patterns and functional connectivity in individuals with autism while they learned a novel task. If normal learning in a task is dependent on unimpaired frontal–posterior cortical communication, then one might expect to observe neural differences between participants with autism and control participants during the learning process.
In many neuroimaging studies of learning in neurotypical participants, neural indices of learning, manifested in changes in the pattern of brain activation, have been related to behavioral measures of increased learning (for a review, see Kelly and Garavan 2005). One such brain change with learning is a decrease in activation in association areas over time. As people become more proficient at a task, brain activation typically decreases in a large set of association areas related to the task (e.g., Haier et al. 1992). Thus, these brain centers appear to become more neurally efficient, in that the task can be performed appropriately with less neural activity. A second manifestation of learning is an increase in subcortical participation. As participants become faster at performing a task, they show increased activation in subcortical areas (e.g., Salimpoor et al. 2010). With increased learning, some of the neural control of the processing may shift from cortical to subcortical areas, which may use different procedures to execute the processes. A third neural adaptation during learning is repetition suppression, whereby repeated exposure to a set of stimuli evokes decreased activation in sensory areas. In basic visual and auditory processing tasks, as repeated trials of an identical stimulus are presented, the neural response in visual and auditory processing areas decreases (e.g., Desimone 1996; for a review, see Henson 2003). A repetition suppression effect does not necessarily imply a change in strategy, or even in learning as we typically think of it, but may simply reflect a physiological adaptation or habituation. To summarize, the neurotypical brain activation response to learning and repeated exposure typically consists of an activation decrease in association areas, a decrease in basic sensory processing areas, and an increase in subcortical areas.
As noted above, another type of neural index of learning concerns a change in the synchronization of activation (functional connectivity) among brain areas. Several studies have reported that while the amount of activation in particular areas decreases over time with learning, the degree of synchronization of the activation among cortical areas increases with learning (Büchel et al. 1999; Toni et al. 2002), and furthermore, that these changes in functional connectivity are correlated with changes in task performance during the course of learning. This suggests that the communication or coordination among the processes occurring in different areas becomes more effective with learning.
Several studies have examined the neural patterns associated with learning in autism. For example, Müller et al. (2004) found that participants with autism and neurotypical participants both showed reaction time improvements as they learned a motor sequence, but brain imaging analyses revealed that while the control group showed the typical pattern of decreasing activation in association areas with learning (specifically in premotor and parietal regions), the autism group instead showed a distinct pattern of increased activation in the premotor area as learning increased. In a facial affect recognition task, Bölte et al. (2006) found increased cortical activation in participants with autism who completed training relative to participants with autism who did not complete training. Such findings suggest an atypical pattern of increased activation in association areas with learning in autism rather than the decrease in these areas usually found in neurotypical participants.
Studies have also examined repetition suppression and subcortical participation in learning in ASD. For example, children with ASD failed to show the same increase in activation with time in the striatum and left temporoparietal cortex that neurotypical children showed during extended exposure to auditory artificial languages (Scott-Van Zeeland, McNealy, et al. 2010). In a neutral face processing task, while individuals with ASD showed typical repetition suppression in the fusiform gyrus, they showed decreased repetition suppression in the amygdala relative to neurotypical participants (Kleinhans et al. 2009). These findings suggest that individuals with autism do not show the typical patterns of repetition suppression in the amygdala and increases in subcortical participation over repeated exposure to stimuli.
No studies to date have explored changes in the amount of activation and the degree of synchronization of activation associated with learning a complex social task in autism. Taken together, the studies above provide some evidence of an atypical pattern of activation changes in response to learning in autism. Previous research has shown atypical brain activation and synchronization in social tasks in autism (Pelphrey et al. 2004; Kana et al. 2009), which could arise as a result of a different neural organization of learning in participants with autism. Moreover, the underconnectivity theory suggests that decreased functional connectivity in autism could impair learning or result in an atypical neural pattern of synchronization following learning. Furthermore, properties of the corpus callosum have been linked with learning ability (Koch et al. 2010), suggesting that reduced corpus callosum size in autism (Chung et al. 2004; for a recent meta-analysis, see Frazier and Hardan 2009), or other white matter abnormalities that are correlated with reduced corpus callosum size, may also predict impaired learning in autism. Decreased corpus callosum size has also been found in individuals with learning disabilities, such as attention-deficit hyperactivity disorder (Semrud-Clikeman et al. 1994), further suggesting the importance of the corpus callosum and other white matter structures in learning.
The aim of the current study was to examine the neural basis of social learning processes in autism. As described above, previous research with neurotypical participants has found that brain adaptations in learning include 1) decreased activation in association areas, 2) decreased activation in basic sensory processing areas, 3) increased activation in subcortical areas, and 4) increased functional connectivity. Because learning is neurally implemented at least in part as a network process (Büchel et al. 1999), impaired frontal–posterior cortical communication among brain areas in autism may affect the learning process, such that the pattern of neural change with learning may be altered. Specifically, we hypothesized that individuals with autism would show smaller decreases in activation in association areas and sensory areas and smaller increases in activation in subcortical areas than neurotypical participants. Furthermore, because functional connectivity has been found to be impaired in autism during normal task processing, we hypothesized that participants with autism would show a smaller increase in synchronization with learning than the neurotypical participants. Finally, we hypothesized that functional connectivity impairments in autism would be associated with structural connectivity deficits; therefore, corpus callosum measurements were performed and used as a general index of anatomical connectivity in the brain.
To examine the neural changes during social learning processes in autism, we developed a novel dynamic social task that required participants to learn cues associated with lying. Participants with autism and neurotypical matched controls were shown 2 videos depicting an avatar uttering a sentence to the viewer, with one of the videos containing mendacity cues and the other not. The uttered sentence was a potentially deceptive statement, such as giving an excuse for excluding the listener from a social engagement. The untrue videos were identical to their matched true videos, except for the presence of 8 auditory and visual cues to deception that are most commonly displayed when an individual is lying versus telling the truth (DePaulo et al. 2003). Participants were asked to decide which avatar was the liar and which was the truth-teller. Prior research has suggested that untrained neurotypical individuals cannot consistently identify liars (Ekman and O’Sullivan 1991), presenting an opportunity for a social learning effect to occur in both groups after training. Explicit feedback about accuracy was presented to the participants after each response during the training phase. Behavioral performance and brain activation and synchronization were measured before, during, and after feedback training on this complex social task.
Materials and Methods
Participants
Eighteen high-functioning individuals with autism and 18 neurotypical control participants were included in the analyses. Participants were matched on age and IQ and had full-scale and verbal IQ scores of 75 or above (see Table 1). Among the 18 participants in the autism group, 2 were female and 2 were left-handed. In the control group, one participant was female and 2 were left-handed.
Table 1.
Demographic information for autism and control groups
| Autism | Control | t value | P | ||
| Age (years) | Mean ± SD | 22.4 ± 9.6 | 22.4 ± 4.5 | 0.02 | ns |
| Verbal IQ | Mean ± SD | 106.2 ± 14.9 | 110.1 ± 6.2 | 1.02 | ns |
| Full-scale IQ | Mean ± SD | 106.2 ± 11.9 | 111.2 ± 6.4 | 1.57 | ns |
| Handedness | Right: left | 16: 2 | 16: 2 | ||
| Gender | Male: female | 16: 2 | 17: 1 | ||
| ADOS Communication | Mean ± SD | 5.2 ± 1.3 | |||
| ADOS Social | Mean ± SD | 10.0 ± 2.0 | |||
| ADOS Total | Mean ± SD | 15.2 ± 2.7 |
Note: ADOS, Autism Diagnostic Observation Schedule; SD, standard deviation.
The diagnosis of autism was established using 2 structured research diagnostic instruments, the Autism Diagnostic Interview-Revised (Lord et al. 1994) and the Autism Diagnostic Observation Schedule (Lord et al. 2001) and confirmed by expert clinical opinion. Potential participants with autism were excluded if they had an identifiable cause for their autism, such as fragile-X syndrome, tuberous sclerosis, or fetal cytomegalovirus infection. Potential control and autism participants were also excluded if there was evidence of birth asphyxia, head injury, or a seizure disorder. Exclusionary criteria were based on neurologic history and examination, chromosomal analysis, or metabolic testing if indicated.
The control participants were community volunteers recruited to match the autism participants on age, full-scale IQ, gender, race, and socioeconomic status of family of origin, as measured by the Hollingshead (1957) method. Potential control participants were screened by questionnaire, telephone, face-to-face interview, and observation during screening psychometric tests. Exclusionary criteria, evaluated through these procedures, included current or past psychiatric and neurologic disorders, birth injury, developmental delay, school problems, acquired brain injury, learning disabilities, substance abuse, and medical disorders with implications for the central nervous system or those requiring regular medication. Potential control participants were also screened to exclude those with a family history (in parents, siblings, and offspring) of autism, developmental cognitive disorders, affective disorders, anxiety disorders, schizophrenia, obsessive compulsive disorder, substance abuse, or other neurologic or psychiatric disorders thought to have a genetic component.
Handedness was determined with the Lateral Dominance Examination from the Halstead-Reitan Neuropsychological Test Battery (Reitan 1985). The brain activation data from these left-handers were clearly similar to those of right-handers from their respective groups, and therefore, the data were not separated by handedness. Each participant signed an informed consent that had been approved by the University of Pittsburgh and Carnegie Mellon University Institutional Review Boards.
Materials and Procedure
This experiment compared participants with and without autism while they attempted to differentiate between liars and truth-tellers in pairs of computer-animated videos. Each video consisted of an avatar uttering a short statement that could be either truthful or a lie. The videos were created in pairs, with each pair consisting of a unique avatar and spoken utterance. Within each pair, the facial and speech characteristics of the avatar differed such that the characteristics of one of the avatars matched those qualities found to be commonly exhibited by people who are lying (DePaulo et al. 2003). The lying avatars exhibited dilated pupils, a raised chin, an unsmiling mouth, increased blinking, reduced head motion, higher voice pitch, a higher rate of speech, and 1–2 extra pauses in the utterance. The truth-telling avatar in each pair was identical to the liar except the avatar did not exhibit the 8 lying-related characteristics. Figure 1 shows freeze frames from a truth video and a lie video from 1 avatar/utterance, and the video clips can be found in the Supplementary Material.
Figure 1.
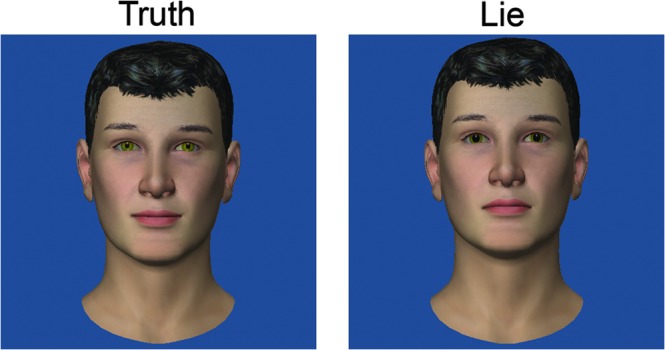
Frames from a truth video and a lie video in one stimulus pair. The visual deception cues in the lie video include dilated pupils, a raised chin, and no smiling.
Each utterance was potentially interpretable as either a lie or a truth in a situation likely to occur in everyday life. Each participant watched 36 videos. In these videos, 18 of the utterances involved a potential monetary gain for the avatar, 9 involved a potential gain of time or effort, and 9 involved the avoidance of social interaction with the listener. Examples of all 3 types of utterances are shown in Table 2. The analyses were collapsed over the different types of utterances after no systematic differences were observed in preliminary analyses.
Table 2.
Examples of the utterance stimuli
| Monetary: | Can I borrow 50 dollars? I’ll pay you back next week. |
| Social time/effort: | Could you take my shift on Saturday night? I have a family obligation. |
| Social avoidance: | I’d ask you to sit at the table with me, but I’m expecting a friend. |
The videos were created in AVI format using LifeStudio (http://www.lifemi.com/. Last accessed 15 June 2011). The videos ranged in duration from 3900 to 6700 ms (but were almost identical for the matched pair of lie and truth versions). The utterances were synthesized as WAV files using Goldwave (http://www.goldwave.com/. Last accessed 15 June 2011). LifeStudio was then used to implement lip-syncing in the avatar.
The task of the participants was to watch each pair of videos and to choose which video contained the liar. The order of the lie and truth videos within each pair was randomized. After the first video in each trial (labeled with the letter “A” on screen) was presented, there was a rest of 7000 ms with only an asterisk appearing on the screen, followed by the second video displaying the same avatar and utterance but in the complementary truth mode (and labeled “B”). After video B, text appeared reading, “Which person is lying?,” and the participant had 4000 ms to press 1 of 2 handheld mouse buttons (one in each hand) to signal an A or B response (left-hand always signaled A). There then followed a 7000-ms rest period before the next pair of videos. The onset of each video was synchronized with the beginning of a time repetition (TR), and the presentation of each video constituted a separate event in the experimental design.
The study had 3 phases: a pretest, a training phase (the only one in which feedback was provided), and a posttest, each consisting of 12 pairs of videos. If the participant answered correctly during the training phase, the message “That’s right!” or “You’re correct!” was displayed. If they answered incorrectly, the message displayed the correct description, such as “A was lying” or “B was lying.” Before each phase, the display indicated whether or not feedback would be provided for that phase. The experiment was an event-related design so that each video could be analyzed separately. Four 24-s baseline fixation periods, including one at the beginning of the experiment and one after each of the 3 phases, were distributed throughout the session. During the fixation periods, participants focused on a centered asterisk without performing any task.
Prior to testing in the scanner, participants were familiarized with the task using 2 pairs of videos that were not presented again during the fMRI study. Familiarization also entailed the use of a scanner simulator to acclimate the participants to the scanning atmosphere and to attain motion quality standards.
Neuroimaging Acquisition
The data were collected using a 3-T Siemens Allegra Scanner (Siemens, Erlangen, Germany) at the Brain Imaging Research Center of Carnegie Mellon University and the University of Pittsburgh. The fMRI data were acquired with a gradient echo, echo-planar pulse sequence with TR = 1000 ms, time echo (TE) = 30 ms, and a 60° flip angle. Seventeen adjacent oblique-axial slices were acquired in an interleaved sequence; each slice was 5-mm thick with a gap of 1 mm between slices (the choice of slice thickness and short TR was intended to optimize the measurement of the synchronization of the activation across regions while maximizing sensitivity to activation in large [10 mm] regions of interest [ROIs]). The acquisition matrix was 64 × 64 with 3.125 × 3.125 × 5-mm voxels. A 160-slice axial 3D magnetization prepared rapid gradient echo volume scan with TR = 200 ms, TE = 3.34 ms, flip angle = 7°, field of view = 256 cm, and a 256 × 256 matrix size was acquired for each participant to be used in segmenting the corpus callosum into anatomically predefined regions.
Behavioral Analyses
The error rates and reaction times recorded by the experimental software were submitted to 2 (group) × 3 (training phase) mixed analyses of variance (ANOVAs). Reaction time outliers (RT greater or less than 3 standard deviation from the participant’s mean) were removed; however, their frequency was low (autism M = 0.67; control M = 0.39) and did not differ between groups (t34 = 1.52, P = 0.14).
fMRI Analyses—Distribution of Activation
To compare the participating groups in terms of the distribution of activation, the data were analyzed using SPM2. Images were corrected for slice acquisition timing, motion-corrected, normalized to the Montreal Neurological Institute (MNI) template, resampled to 2 × 2 × 2-mm voxels and smoothed with an 8-mm Gaussian kernel to decrease spatial noise. Statistical analysis was performed on individual and group data by using the general linear model and Gaussian random field theory as implemented in SPM2 (Friston et al. 1995). Group analyses were performed using a random-effects model. Statistical maps were superimposed on normalized T1-weighted images. An uncorrected height threshold of P < 0.005 and an extent threshold of six 8-mm3 voxels were used.
Contrasts were computed on the brain activation data to compare the activation during the pretest with that of the posttest. Training activation was intermediate between that of the pretest and posttest conditions and is not reported.
fMRI Analyses—Functional Connectivity
The functional connectivity was computed separately for each participant as a correlation between the average time course of signal intensity of all the activated voxels in each member of a pair of ROIs. Twenty-five functional ROIs were defined to encompass the main clusters of activation in the group activation map for each group in the Pretest-Fixation contrast. Labels for the following 25 ROIs were assigned with reference to the parcellation of the MNI single-subject T1-weighted data set carried out by Tzourio-Mazoyer et al. (2002): medial frontal gyrus, superior medial frontal gyrus, supplementary motor area, right superior parietal lobule, calcarine sulcus, and 10 bilateral ROIS, namely precentral gyrus, inferior frontal gyrus, superior temporal gyrus, temporal pole, fusiform gyrus, inferior occipital gyrus, superior occipital gyrus, lingual gyrus, amygdala, and hippocampus. For each of these ROIs, one or more spheres (with radii ranging from 5 to 15 mm) were defined to best capture the clusters of activation in the Pretest-Fixation within-group contrast separately for each group. Each sphere was initially centered on the local maxima of a cluster of activation, but in some cases adjusted a few millimeters to better encompass the entire cluster or to stay within the bounds of the gray matter. The ROIs used in the analysis were each the union of the 2 or more spheres defined for the 2 groups. Supplementary Table 1 lists the centroids for each group for each ROI in MNI coordinates. The activation time course extracted for each participant over the activated voxels within the ROI originated from the normalized and smoothed images, which were high-pass filtered and had the linear trend removed. Participants who did not have 12 or more activated voxels in a given ROI were excluded from further functional connectivity analyses involving that ROI in order to ensure that the correlations were based on stable estimates of the time course of the signal. There were no significant differences between groups in the number of activated voxels in any ROI for the pretest and the training phase. In the posttest, only 4 ROIs (left inferior frontal gyrus, medial frontal gyrus, right fusiform gyrus, and right inferior occipital gyrus) had significantly more activated voxels in the autism group than the control group (P < 0.05), and there were no ROIs in which the control group showed more activated voxels. Functional connectivity was computed on the images belonging to the pretest, training, and posttest conditions and not during the baseline condition, so it reflected the synchronization between the activation in 2 areas while the participant was actually performing the task. Thus, correlations of activation among regions are not influenced by changes in the magnitude of blood oxygen level–dependent (BOLD) signal changes between rest and task performance but only by synchronous fluctuations of signal during task performance. Fisher’s r to z transformation was applied to the correlation coefficients for each participant to ensure normality of the distributions prior to averaging and statistical comparison of the 2 groups.
Functional connectivity was measured for each participant in each group separately for the pretest, training, and posttest conditions for all 300 possible pairings of the 25 functional ROIs. A 2 (group) × 3 (training phase) mixed ANOVA was conducted to assess overall differences in the means of these 300 ROI pair connectivities. To test the prediction that frontal–posterior connections would show significant underconnectivity in autism (Just et al. 2004, 2007; Kana et al. 2006, 2007), a 2 (group) × 3 (training phase) mixed ANOVA was also conducted using only the 98 ROI pairs that existed between the 7 frontal ROIs and the 14 posterior ROIs (parietal, temporal, and occipital ROIs). To demonstrate that any emerging functional connectivity results would not be dependent on the specific choice of activation measures, the analyses were repeated using the time courses of 3 alternative activation measures, with methods and results reported in the Supplementary Material. One such measure used the activation level of only the peak-activated voxel within the functional ROI. A second measure used the average activation of activated voxels in anatomically defined ROIs. A third measure was similar to the one reported in the paper but excluded the 6-s interval that included the rise of the hemodynamic response to the onset of the videos.
Corpus Callosum Morphometry
The cross-sectional area of the midsagittal slice of the corpus callosum was measured using the parcellation scheme described by Witelson (1989). The 7 subregions of the corpus callosum include the rostrum, genu, rostral body, anterior midbody, posterior midbody, isthmus, and splenium. The corpus callosum size was normalized by dividing it by the total gray and white matter volume (total cerebral volume) for each participant. The gray matter, white matter, and cerebrospinal fluid volumes were measured for each subject by segmenting the T1-weighted structural brain image into 3 masks. The segmentation was performed by SPM2 routines. The outer contour of the corpus callosum was manually traced (with an interrater reliability of 0.87), and then interior segmentation, area, and length computations were performed by image processing software.
Corpus callosum measurements were compared for 17 of the 18 participants with autism and all 18 controls; one member of the autism group requested to be removed from the scanner after functional scans but before the structural scans. T-tests were run to compare the 2 groups for each of the 7 corpus callosum subregions. These analyses were motivated by previous findings of reduced white matter volumes and midsagittal area measurements in the corpus callosum in autism (Chung et al. 2004; Frazier and Hardan 2009). Decreases in corpus callosum size, and reliable relationships between this anatomical index of white matter integrity and functional connectivity or behavior, have been reported in several previous studies (Kana et al. 2006, 2009; Just et al. 2007; Mason et al. 2008). Given that no previous study has reported larger corpus callosum size in autism, one-tailed P values are reported here.
Results
Overview
The autism group and the control group both learned to accurately perform the lie detection task. The autism group showed a similar activation pattern from the pretest to the posttest, whereas the control group showed a large reduction in activation. The autism group had significantly lower functional connectivity across all pairs and, specifically, across frontal–posterior pairs, than did the control group, across training phases. Both groups showed an increase in functional connectivity from the pretest to the posttest across all ROI pairs and, specifically, for frontal–posterior pairs, but the autism group showed a significantly smaller increase than the control group. Corpus callosum measurements revealed somewhat smaller areas of the rostrum, anterior midbody, and posterior midbody than the control group. In the autism group only, the size of the posterior midbody section was reliably correlated with functional connectivity in frontal–parietal pairs.
Behavioral Results
The 2 groups performed similarly throughout the experiment, with both groups improving from pretest to training and from pretest to posttest. The autism group and the control group showed similar error rates (F1,34 = 0.1, P = 0.79) and reaction times (F1,34 = 0.02, P = 0.88) throughout the task, as shown in Table 3. Participants made reliably more errors in the pretest than in the training phase (F1,34 = 14.0, P = 0.001) or the posttest (F1,34 = 14.9, P = 0.001). There was also a trend toward more errors in the training phase than the posttest (F1,34 = 3.3, P = 0.08). There was no interaction between group and phase for error rates (F2,68 = 0.5, P = 0.60). A similar pattern occurred in reaction times: participants responded reliably more slowly in the pretest than in the training phase (F1,34 = 11.5, P = 0.002) or the posttest (F1,34 = 19.2, P = 0.0001). Participants also responded more slowly in the training phase than the posttest (F1,34 = 4.3, P = 0.05). Furthermore, there was an interaction between group and phase (across all 3 phases) in reaction times (F2,68 = 3.1, P = 0.05). This interaction was significant when comparing the reaction times in the pretest and posttest (F1,34 = 4.3, P = 0.05), suggesting that the control participants showed a greater improvement in reaction times from the pretest to the posttest than did the participants with autism. There was also a marginal interaction between group and phase for the comparison of reaction times in the pretest and training phase (F1,34 = 3.2, P = 0.08). The mean error rates and response times are shown in Table 3.
Table 3.
Error rates and response times for both groups
| Error rate (%) | Response time (ms) | ||||||
| Pretest (%) | Training (%) | Posttest (%) | Pretest | Training | Posttest | ||
| Autism | Mean (standard error) | 32.9 | 22.9 | 15.3 | 1065 | 978 | 924 |
| 6.1 | 4.0 | 4.3 | 114 | 106 | 108 | ||
| Control | Mean (standard error) | 38.0 | 19.9 | 17.1 | 1235 | 955 | 839 |
| 5.6 | 4.6 | 4.0 | 132 | 72 | 89 | ||
Group Differences in Brain Activation
Throughout the experiment, the 2 groups showed similar locations of activation while viewing videos, including bilateral superior and middle temporal gyrus, bilateral inferior frontal gyrus, bilateral inferior occipital gyrus, and superior medial frontal gyrus, as shown in Figure 2. There was little difference between the 2 groups in the distribution of the activation in the pretest. The areas of activation for each group in the main condition contrasts are shown in Table 4.
Figure 2.

Within-group contrasts showing regions that were active during the pretest and posttest as compared with fixation. The t-maps are thresholded at P < 0.001 with an extent threshold of 6 voxels.
Table 4.
Areas of activation for the within-group contrasts of pretest with fixation, posttest with fixation, and pretest with posttest, as well as the between-group contrast for pretest with posttest
| Location of peak activation | Cluster size | t34 | MNI coordinates | ||
| x | y | z | |||
| Autism group: pretest-fixation | |||||
| Bilateral middle and superior temporal, inferior frontal, middle and inferior occipital, cerebellum, calcarine, lingual, fusiform, precentral; R inferior temporal, middle frontal, hippocampus, insula | 41 241 | 21.4 | 60 | −18 | 0 |
| Bilateral superior medial and superior frontal, supplementary motor area | 2930 | 6.73 | 4 | 8 | 72 |
| R inferior and superior parietal, angular | 173 | 3.05 | 42 | −54 | 56 |
| R precuneus | 33 | 2.79 | 8 | −62 | 40 |
| L inferior parietal | 16 | 2.68 | −30 | −58 | 50 |
| L pallidum, putamen | 16 | 2.6 | −16 | 8 | 2 |
| Control group: pretest-fixation | |||||
| Bilateral middle and superior temporal, inferior frontal, middle and inferior occipital, precentral, calcarine, lingual, fusiform, cerebellum, insula, thalamus; R inferior temporal, middle frontal | 48 191 | 16.9 | 54 | −14 | −4 |
| Bilateral supplementary motor area, superior medial and superior frontal; R middle cingulate | 2569 | 7.9 | −6 | 18 | 50 |
| L caudate, putamen, pallidum | 85 | 3.05 | −12 | 10 | 6 |
| Autism group: posttest-fixation | |||||
| Bilateral middle and superior temporal, inferior frontal, calcarine, middle and inferior occipital, cerebellum, lingual, angular, fusiform, hippocampus, precentral; R middle frontal, inferior temporal | 43 284 | 14.1 | −52 | −42 | 8 |
| Bilateral superior medial and superior frontal, supplementary motor area | 2896 | 6.08 | 8 | 12 | 70 |
| Bilateral precuneus, posterior cingulate | 855 | 5.01 | 2 | −62 | 40 |
| L putamen, pallidum, caudate | 269 | 3.46 | −20 | 0 | 10 |
| R postcentral, inferior and superior parietal, precentral | 74 | 3.41 | 50 | −24 | 62 |
| Control group: posttest-fixation | |||||
| L middle and superior temporal, supramarginal, heschl, inferior frontal, inferior parietal, superior temporal pole, angular | 6046 | 10.1 | −58 | −26 | −2 |
| Bilateral calcarine, lingual, cerebellum, inferior, middle, and superior occipital, fusiform; R cuneus | 7704 | 9.14 | 2 | −96 | −8 |
| R superior, middle, and inferior temporal, inferior and middle frontal, superior temporal pole, supramarginal, heschl, hippocampus | 7628 | 9.11 | 50 | −34 | 0 |
| R precentral, middle frontal | 192 | 5.82 | 50 | 6 | 52 |
| Bilateral supplementary motor area; L superior medial and superior frontal | 255 | 5.07 | −6 | 18 | 52 |
| L precentral, inferior and middle frontal | 890 | 5.01 | −50 | 0 | 52 |
| L superior medial frontal | 134 | 4.8 | −6 | 42 | 44 |
| L caudate, anterior and middle cingulate | 41 | 4.68 | −8 | 10 | 22 |
| R inferior parietal | 57 | 4.17 | 54 | −50 | 54 |
| L hippocampus, thalamus, lingual | 95 | 3.35 | −22 | −28 | −4 |
| L putamen | 21 | 3.08 | −22 | 4 | 6 |
| R angular | 10 | 2.92 | 38 | −58 | 38 |
| Autism group: pretest-posttest | |||||
| L cerebellum | 7 | 9.44 | −8 | −28 | −22 |
| Control group: pretest-posttest | |||||
| Bilateral middle and superior temporal, middle and inferior occipital, precentral, inferior frontal, fusiform, lingual, cerebellum, supplementary motor area, insula; R inferior temporal, superior parietal, superior occipital, supramarginal | 51 426 | 13.9 | −48 | −2 | 44 |
| L superior and inferior parietal, precuneus | 658 | 6.71 | −26 | −54 | 54 |
| R supramarginal, inferior and superior parietal, postcentral | 134 | 4.29 | 60 | −28 | 50 |
| Bilateral anterior cingulate, olfactory; R medial frontal | 81 | 3.29 | 0 | 26 | −2 |
| L inferior parietal, supramarginal | 26 | 2.88 | −58 | −30 | 44 |
| R superior medial frontal | 8 | 2.71 | 8 | 50 | 38 |
| Control group-autism group: pretest-posttest | |||||
| R precentral, inferior and middle frontal | 363 | 6.96 | 58 | 12 | 36 |
| L middle and inferior occipital, lingual, fusiform, cerebellum, inferior and middle temporal, vermis | 3311 | 5.62 | −48 | −78 | −12 |
| L precentral, postcentral, inferior frontal | 676 | 5.08 | −50 | −2 | 46 |
| R middle and inferior occipital, inferior and middle temporal, fusiform, cerebellum | 1081 | 4.85 | 48 | −78 | −14 |
| R supramarginal, inferior parietal, postcentral | 109 | 4.75 | 58 | −28 | 50 |
| R fusiform, lingual, cerebellum | 440 | 4.58 | 32 | −56 | −10 |
| R middle temporal, middle occipital, angular | 226 | 4.51 | 44 | −68 | 20 |
| L superior and middle frontal, precentral | 282 | 4.48 | −26 | −2 | 54 |
| L precuneus, superior parietal | 108 | 4.46 | −12 | −56 | 44 |
| L inferior parietal, supramarginal, postcentral | 436 | 4.31 | −56 | −30 | 44 |
| R middle and superior temporal, middle and superior temporal pole | 118 | 4.24 | 48 | 0 | −22 |
| R inferior and superior parietal, angular | 146 | 4.04 | 30 | −60 | 56 |
| R lingual, calcarine | 129 | 3.97 | 12 | −82 | −8 |
| L superior and inferior parietal | 86 | 3.95 | −24 | −50 | 50 |
| R precentral, postcentral | 90 | 3.75 | 38 | −16 | 56 |
| L supplementary motor area, paracentral | 25 | 3.64 | −12 | −20 | 56 |
| L middle temporal | 43 | 3.61 | −58 | −58 | 0 |
| L supplementary motor area | 10 | 3.59 | −8 | 18 | 68 |
| L precuneus, cuneus | 41 | 3.59 | −14 | −54 | 18 |
| R angular, superior and middle occipital | 44 | 3.53 | 34 | −66 | 40 |
| L inferior frontal | 18 | 3.52 | −60 | 18 | 8 |
| R inferior frontal | 37 | 3.51 | 56 | 26 | −4 |
| R precuneus, superior parietal | 57 | 3.5 | 12 | −52 | 48 |
| L inferior frontal | 22 | 3.5 | −34 | 22 | 26 |
| L inferior frontal | 26 | 3.48 | −50 | 6 | 4 |
| R insula, inferior frontal | 52 | 3.4 | 30 | 24 | −2 |
| L superior temporal pole | 19 | 3.39 | −58 | 10 | −6 |
| L middle temporal | 15 | 3.36 | −66 | −32 | −8 |
| L parahippocampal, hippocampus | 18 | 3.36 | −10 | −4 | −16 |
| R superior frontal | 45 | 3.35 | 26 | −8 | 64 |
| L inferior and superior parietal, middle occipital | 12 | 3.34 | −28 | −82 | 44 |
| L middle and superior frontal | 7 | 3.23 | −20 | 44 | 20 |
| L middle occipital, inferior parietal | 20 | 3.2 | −32 | −70 | 36 |
| R cerebellum | 11 | 3.19 | 36 | −76 | −22 |
| L supramarginal, postcentral | 6 | 3.18 | −54 | −22 | 16 |
Note: L, left; R, right. The threshold for significant activation was P < 0.05 for a spatial extent of at least 6 voxels, corrected for multiple comparisons with false discovery rate. Region labels apply to the entire extent of the cluster. T values and MNI coordinates are for the peak activated voxel in each cluster only.
The main group activation difference was in the change in the activation from the pretest to the posttest (which were separated by the training). The participants with autism showed very little decrease in brain activation from the pretest to the posttest, unlike the control participants, who showed a large reduction in activation from the pretest to the posttest, as shown in Figure 3. The areas of activation for this between-group comparison are shown in Table 4 (no other between-group comparisons had reliable areas of activation at this threshold level). The autism group showed only small reductions in activation, mainly in sensory areas, including bilateral superior temporal gyrus, bilateral inferior frontal gyrus, bilateral fusiform gyrus, and bilateral inferior occipital gyrus. Controls, on the other hand, showed greatly reduced activation in many areas involved in the task, including bilateral precentral gyrus; bilateral inferior frontal gyrus; bilateral superior, middle, and inferior temporal gyri; bilateral middle and inferior occipital gyri; bilateral fusiform gyrus; supplementary motor area; bilateral superior parietal lobule; bilateral supramarginal gyrus; left temporal pole; and right middle cingulate gyrus. The location of the training effect (decreases in activation from pretest to posttest) in each group is shown in Figure 4.
Figure 3.

Between-group contrasts showing regions that displayed greater activation for the pretest than the posttest. The t-maps are thresholded at P < 0.005 with an extent threshold of 6 voxels.
Figure 4.

Within-group contrasts showing regions that displayed greater activation for the pretest than the posttest. The t-maps are thresholded at P < 0.001 with an extent threshold of 6 voxels.
There were also several brain areas that were more activated in the posttest than the pretest. The control group showed increased activation during the posttest in the left superior frontal gyrus, the hippocampus, the caudate, and the putamen. The hippocampus and other medial temporal structures play a role in learning and recalling stimulus–response associations and have been shown to increase in activation while reaction time decreased to repeated stimuli (Salimpoor et al. 2010). In contrast, the autism group did not show an activation increase in the hippocampus and caudate but instead showed an increase in several association areas involved in the task, including bilateral precentral gyrus, left superior and middle frontal gyrus, and bilateral angular gyrus, as well as bilateral putamen. Figure 5 shows the areas in which activation was greater for the posttest than the pretest in both groups.
Figure 5.

Within-group contrasts showing regions that displayed greater activation for the posttest than the pretest. The t-maps are thresholded at P < 0.001 with an extent threshold of 6 voxels.
Functional Connectivity
The functional connectivity (simple Pearson correlation between pairs of areas’ averaged BOLD signal time courses during task performance) across all pairs of ROIs showed significantly lower functional connectivity in autism (autism mean = 0.55; control mean = 0.65; F1,34 = 7.6, P = 0.01), confirming reduced functional connectivity in autism relevant to a complex social judgment task. There was also a reliable main effect of training phase (F2,68 = 509.7, P < 0.0001): both the autism group and the control group showed a significant increase in functional connectivity over the course of the experiment as the participants were learning how to perform the task, indicating that functional connectivity provides a sensitive index of learning in this task. Importantly, however, there was also a robust group by training phase interaction (F2,68 = 50.9, P < 0.0001). This interaction reflects the finding that while both groups showed an increase in functional connectivity from the pretest to the posttest, this increase was significantly smaller in the autism group, as shown in Figure 6. Thus, the findings from this complex social judgment task provide evidence of lower task-relevant functional connectivity in autism, confirm that whole-brain functional connectivity increases with learning regardless of diagnosis and also demonstrate that functional connectivity increases less among those diagnosed with high-functioning autism.
Figure 6.

Average functional connectivity across all ROI pairs for the 3 training phases.
In order to test the prediction that the autism group would have lower functional connectivity specifically in frontal–posterior pairs, the above analysis was repeated on the subset of the 98 pairs between frontal ROIs and posterior ROIs (temporal, parietal, and occipital). The functional connectivity between frontal and posterior regions was significantly lower in the autism group (autism mean = 0.50; control mean = 0.60; F1,34 = 5.3, P = 0.03). The functional connectivity in frontal–posterior connections also increased reliably from the pretest to the training phase and to the posttest across both groups (F2,68 = 583.6, P < 0.0001), and there was a significant interaction between training phase and group, which also occurred across all pairs (F2,68 = 39.0, P < 0.0001). This again indicates that despite similar behavioral learning effects, the group with autism displayed lower frontal–posterior functional connectivity related to task performance overall and a smaller increase, relative to neurotypical participants, in frontal–posterior connectivity with repeated experience with the task.
When the above analyses were repeated on functional connectivity values based on activated voxels within anatomical ROIs, the same pattern of results emerged. The same pattern also emerged when the analyses were repeated when the first 6 s of the activation time course (in the functional ROIs) following stimulus onset were excluded. When the analyses were repeated on functional connectivity values based on the peak activated voxel within each functional ROI, the interaction effect and effect of training phase remained, while the group effect lost significance. The results of these analyses are reported in more detail in the Supplementary Material.
Corpus Callosum Morphometry
To investigate a possible anatomical basis of reduced functional connectivity in autism, the size of the corpus callosum was measured and used as a general index of structural connectivity. The corpus callosum size for each segment (normalized by total brain volume) was compared between the 2 groups. The autism group had a reliably smaller rostrum (t33 = 2.23, P = 0.02) and anterior midbody (t33 = 2.02, P = 0.03) than did the control group. The autism group also had a smaller posterior midbody than did the control group (t33 = 1.85, P = 0.04). However, the differences above were no longer reliable after correcting for multiple comparisons. The remaining segments showed no significant difference between groups.
Relation between Functional Connectivity and Corpus Callosum Size
The relation between the functional connectivity of an individual during the posttest and the size of their corpus callosum segments in both groups was also examined. In the autism group, the size of the posterior midbody was correlated with the average functional connectivity of frontal–parietal pairs (r = 0.63, P = 0.01). The control group did not show this correlation (r = −0.09). Figure 7 shows the positive correlation of posterior midbody size and frontal–parietal functional connectivity in the autism group, with no discernable pattern in the control group. If corpus callosum size is interpreted as an index of structural connectivity, this finding suggests that there is a correlation between functional connectivity and structural connectivity.
Figure 7.

Scatterplots of frontal–parietal functional connectivity and normalized posterior midbody scores in the autism group (A) and the control group (B).
Discussion
Despite showing a behavioral improvement from the pretest to the posttest that was similar to the control group, the autism group showed a different pattern of neural change during learning. Both groups increased in accuracy and decreased in reaction time on the lie detection task, with the control group showing a greater decrease in reaction time than the autism group. However, the autism group showed only very small decreases in activation in association areas as they learned the task and in fact showed an increase in activation in a number of association areas, whereas the control group showed a large decrease in many association areas as they learned. Although both groups showed similar decreases in activation in sensory-perceptual areas, the group with autism did not show the increases in activation in the hippocampus and caudate found in the control group. A learning effect was also seen in the functional connectivity (correlations between activation time courses in distinct regions) across all pairs in both groups: the functional connectivity throughout the brain increased as participants learned the task. Nevertheless, the autism group’s increase in functional connectivity was less than the increase of the control group. Thus, although the 2 groups showed a similar behavioral pattern of learning, the control group showed clear evidence of increased neural efficiency, while the autism group did not. We discuss each of these findings in more detail below.
Behavioral Pattern of Learning
The behavioral results revealed that participants in both groups improved at the lie detection task from the pretest to the posttest, showing lower error rates and shorter reaction times. Furthermore, the majority of this improvement occurred between the pretest and the training phase, suggesting that the participants learned to improve their performance either before the training phase or during the very early trials of the training phase. Therefore, the behavioral improvement most likely reflects incremental perceptual learning by the participants as they saw many trials of the video stimuli. The feedback trials may not have been necessary for the participants to learn the lie detection task. Thus, both groups improved their performance at this task mainly through incremental perceptual learning as they performed the early trials in the pretest and training phases. These behavioral findings alone provide important new data about the ability of individuals with high-functioning autism to detect and use social cues to improve performance on a complex social judgment task.
Learning Effects in Association Areas
During learning, the autism group did not show the same pattern of decreased activation throughout the network of areas involved in the lie detection task as did the control group. This network consisted of higher order areas involved in performing various facets of the task, including short-term memory (superior parietal lobe), language processing (inferior frontal gyrus and superior temporal gyrus), and motor planning (supplementary motor area). As the control group became more proficient at the task, they appeared to reduce the use of nonessential processes in these areas involved in higher level cognition. This decrease in activation is consistent with previous findings of increasing neural efficiency in neurotypical individuals as they receive more practice (for a review, see Kelly and Garavan 2005). The autism participants, however, did not show evidence of such increased neural efficiency. In fact, the autism group showed an increase in activation in a subset of these areas, including bilateral precentral gyrus, left superior and middle frontal gyrus, and bilateral angular gyrus. This suggests that while the participants with autism learned how to do the task, their brains did not streamline the neurally based higher order processes underlying their performance and instead recruited additional association areas.
The decrease in activation in neurotypical participants in this task may in part reflect changes at the level of improved communication between brain areas. The individuals with autism may have shown less decrease in activation because their communication between brain areas is impaired, an interpretation consistent with the underconnectivity theory of autism (Just et al. 2004, 2007). This perspective is supported by the present finding of reduced functional connectivity in the autism participants, as well as the reduced structural connectivity indicated by the consistent trend in this study and others of reduced corpus callosum size in autism (see meta-analysis by Frazier and Hardan 2009).
Another possibility is that activation changes in the neurotypical group were brought about by a change in strategy. For example, at first the neurotypical participants may have tried to encode and remember as many cues from the videos as possible, each of which may or may not have signaled deception. However, as the participants learned which specific cues were informative, they may have performed the posttest while encoding only a minimally sufficient set of cues. Any single cue from the set of 8 informative cues would be sufficient to detect the liar. Thus, the decrease in cortical activation in neurotypical individuals may reflect the use of a more economical strategy in the posttest. This interpretation is consistent with the finding of increased activation in the left superior frontal gyrus in the control group during the posttest, which may reflect more strategic control. The postulated impaired connectivity of the autism group may have limited their ability to develop a more economical strategy. The decreased functional connectivity throughout the brain in the autism group may reflect diminished communication between distinct areas. Such impaired communication may have limited the ability of the executive system to exert control over the posterior areas involved in this task. Thus, the autism group may not have been able to restrict their attention to only a minimal set of cues and may instead have learned to attend to more cues in the posttest. This interpretation is consistent with the findings that the autism participants in fact showed increased activation in several cortical areas during the posttest, including the precentral gyrus, angular gyrus, and superior and middle frontal gyri. These areas may have been involved in encoding and keeping track of several cues from the videos. Thus, unlike the control group, the autism group may have been unable to implement a more economical way to perform this task due to decreased communication between frontal and posterior areas.
Learning Effects in Sensory Processing Areas
Both the control group and the autism group showed a decrease in activation in sensory processing areas, including primary auditory cortex and visual processing areas in the fusiform gyrus and the occipital lobe. This decrease is similar to a repetition suppression effect, which is an activation decrease in sensory areas upon repeated exposure to identical or qualitatively similar stimuli (Desimone 1996; Henson 2003). Repetition suppression effects have also previously been found in the inferior frontal gyrus (Lustig and Buckner 2004), as occurred in the present study for both groups. Despite the fact that the individuals with autism failed to show an activation decrease in higher order association areas, they did show a basic repetition suppression-like response to the complex visual and auditory stimuli in sensory-perceptual areas. This response in the sensory regions is consistent with previous findings of unimpaired functional connectivity between posterior regions in autism (Villalobos et al. 2005; Koshino et al. 2008). Thus, the inability of the autism group to neurally adapt with practice is limited to higher order areas involved in this complex social task, and the adaptation in sensory areas appears to be relatively unimpaired.
Learning Effects in Subcortical Areas
The control group alone showed an increase in activation with learning in the hippocampus, which may reflect a reliance on learned stimulus–response associations. Salimpoor et al. (2010) found that activation increases in the hippocampus and other structures were positively correlated with reaction time improvement in a mathematical cognition task. Thus, activation increases in these areas may suggest that, in addition to using a strategy that encodes fewer cues, the control participants may have learned a direct association between the appropriate response and the presence of a specific cue. This may have further allowed the elimination of other cognitive processes that were previously necessary to perform the task. In contrast, the autism group did not show an increase with learning in hippocampal activation, raising the possibility that they did not learn an association between a specific cue in the stimuli and the appropriate response. Nevertheless, this account is somewhat speculative, and further research is necessary to determine why the individuals with autism did not show as much increased activation in the hippocampus with learning as the control group. Despite some evidence of increased volumes of the striatum in autism (Hollander et al. 2005), a structure involved in learning (Packard and Knowlton 2002), there were no reliable differences between the way the autism group and the control group showed increased activation with learning in the striatum (in either one or both of its component parts: the caudate and putamen).
Increased Functional Connectivity after Learning
Both the autism group and the control group showed increased functional connectivity (across all pairs) as they became more proficient at the lie detection task, reflecting increased synchronization across the areas activated in this task. This suggests that participating brain areas became better coordinated as they continuously functioned together on repeated trials of the task. Increases in functional connectivity have been previously observed when neurotypical participants learned locations of objects (Büchel et al. 1999) and visuomotor associations (Toni et al. 2002). It is not surprising that there were much higher increases in functional connectivity in the control group, as the activation results have suggested that only the control group eliminated nonessential processes after learning, possibly due to more economical strategy use and reliance on learned associations. The reliable functional connectivity increase in autism suggests that sheer practice might improve interregional coordination and hence increase functional connectivity in this population, at least for some of the brain regions central to a cognitive processing task.
Functional and Structural Connectivity Group Differences
Many of the individual findings in this study lend support to the theory that autism is characterized by compromised connectivity or bandwidth. These findings include decreased functional connectivity in the autism group, as well as a trend of decreased structural connectivity as indexed by corpus callosum size. Furthermore, in the autism group alone the posterior midbody size (within the corpus callosum) was correlated with frontal–parietal functional connectivity, suggesting that the functional connectivity is constrained by white matter properties in autism. Similar evidence of a relationship between corpus callosum size and functional connectivity in autism has been shown previously, specifically in the posterior midbody area (Kana et al. 2006), as well as in other segments of the corpus callosum (Cherkassky et al. 2006; Just et al. 2007; Mason et al. 2008). The findings of this study lend further support to the underconnectivity theory of autism, extending its application to a social learning task.
There are some boundary conditions in which the underconnectivity theory may not apply without further understanding of the phenomena at issue. One example concerns the application of the theory to electroencephalography (EEG) data, where measures of EEG coherence across electrodes (the counterpart of functional connectivity) are lower in autism in some frequency bands but are higher in other bands (Murias et al. 2007). So extending the theory to EEG measures awaits a better understanding of how a cortical communication bandwidth limitation may affect different frequencies differently. Another boundary condition concerns frequency bands in fMRI data that are not clearly related to cognitive processes. A number of fMRI studies of ASD have measured what they refer to as “intrinsic” functional connectivity by partialling out task-related effects from the data and filtering out the cognitively driven higher frequency signals from the time course, prior to calculating the functional connectivity. Although some of these studies of low-frequency, intrinsic functional connectivity report reduced frontal–posterior functional connectivity in ASD (e.g., Villalobos et al. 2005; Jones et al. 2010), others have found predominantly increased intrinsic functional connectivity in ASD between cortical and subcortical regions (e.g., Mizuno et al. 2006; Turner et al. 2006) or between frontal and posterior cortical regions (e.g., Noonan et al. 2009). Without understanding how those frequency bands of fMRI data that are not clearly related to cognitive processes might be affected by a cortical communication bandwidth limitation, it is difficult to know how to apply the theory to such data. Another area for further investigation concerns underconnectivity in children with ASD; the only published study examining functional connectivity in children (8–12 year olds) with ASD showed a trend for functional underconnectivity between the main frontal activation and other areas (Lee et al. 2009), consistent with the theory. Finally, the theory will inevitably have to be refined as diffusion-weighted imaging techniques reveal increasing detail about differences in white matter tract attributes in autism, such as geometric and diffusion properties of specific tracts. Studies such as Sundaram et al. (2008) and Kumar et al. (2010) report numerous disturbed attributes of white matter tracts as well as numerous attributes that show no difference. Thus “underconnectivity” is a much simplified description of a multifaceted disturbance of a complex anatomical structure.
It should be noted that functional underconnectivity occurs not only in autism but also in other disorders. Altered functional connectivity has been reported in schizophrenia (Meyer-Lindenberg et al. 2001), attention-deficit hyperactivity disorder (Castellanos et al. 2008; Konrad and Eickhoff 2010), epilepsy (Waites et al. 2006), bipolar disorder (Wang et al. 2009), disruptive behavior disorder (Marsh et al. 2008), and dyslexia (Pugh et al. 2000). Further research is clearly warranted to identify the distinguishing patterns of connectivity disturbances among different disorders and the mechanisms underlying each.
The findings reported in this study reveal impaired learning-related functional connectivity in autism. This underconnectivity may reflect a reduced communication bandwidth in autism, resulting in slower less effective communication between cortical areas. In this complex social decision-learning task, this reduced communication may restrict strategic control over the posterior areas involved in performing the task, limiting the ability of the individuals with autism to eliminate nonessential processes with practice. In this manner, underconnectivity in autism may have led to abnormal plasticity with learning. This is the first application of the underconnectivity theory to a learning paradigm.
Implications of the Current Findings for Autism
A somewhat surprising result was that individuals with autism became behaviorally more proficient at a complex social judgment task with feedback training despite not showing most of the neural changes with learning that the control participants showed. The autism group did not show decreased activation in higher order association areas; they did not show an increase in hippocampus activation; and, they showed a smaller increase in functional connectivity than the control group. However, not all of the brain responses during learning were abnormal in the autism group. The individuals with autism showed a typical repetition suppression-like response in primary sensory areas. The failure of the autism group to exhibit the normal neural signs of adaptation during learning may be attributable to impaired frontal–posterior cortical connectivity in autism. Although cause and effect are difficult to disentangle in a complex dynamic system such as the brain, there is a plausible causal account. Genetic factors may affect the anatomical connectivity in autism (Geschwind and Levitt 2007) with the physiological, functional, and behavioral consequences following. This account has interesting implications for autism, especially in the context of a social task, such as lie detection. Many social cognition processes are proficient and automatic in neurotypical individuals (Bargh and Williams 2006), whereas many of these same processes are impaired and under strategic control in individuals with autism. It is possible that the abnormal neural response during social learning as exemplified by this task impairs the ability to learn social tasks more complex than the lie detection task, which could ultimately be performed successfully through a stimulus–response learning paradigm. This account may explain some of the characteristic social deficits of the disorder, as well as other types of complex processing deficits in autism that require frontal participation.
The implications of these findings may be limited to high-functioning adults with autism. More research is needed to determine if these findings extend to adults with autism with below average IQ or to children with autism. Future studies that collect eye gaze data may be able to determine if any of the activation differences between groups reported here are related to atypical patterns of facial scanning known to occur in autism (e.g., Klin et al. 2002). Furthermore, the feedback used during training only provided explicit information about the correctness of responses and was not designed to be rewarding for the participants. Reward processing has obvious implications for learning, and studies of reward processing in autism have shown atypical neural responses to both monetary and social rewards in areas such as the ventral striatum, prefrontal cortex, and the anterior cingulate (Schmitz et al. 2008; Scott-Van Zeeland, Dapretto, et al. 2010).
Conclusions
This set of findings suggests that frontal–posterior underconnectivity in autism may hinder the emergence of more economical strategies during the learning of a novel task. The abnormal brain adaptations during the learning of a social task in autism may be related to the social deficits that characterize autism.
Supplementary Material
Supplementary material can be found at: http://carcin.oxfordjournals.org/
Funding
Autism Centers of Excellence Grant (HD055748) from the National Institute of Child Health and Human Development; National Institute of Mental Health (Training Grant T32MH019983-11 to S.E.S.); National Institute of Deafness and Other Communication Disorders (K23 DC006691 to D.L.W.).
Supplementary Material
Acknowledgments
We appreciate the assistance of current and former members of the center for help in conducting the experiments. In particular, we would like to thank Stacey Becker for her assistance with the data collection, Sarah Berson for her assistance with creating the stimuli, Rajesh Kana for his aid in designing the study, and Chantel Prat and Rob Mason for their comments on earlier versions of the manuscript. We also wish to thank the participants and their families for their time and commitment to this research. Conflict of Interest: None declared.
References
- Agam Y, Joseph RM, Barton JJ, Manoach DS. Reduced cognitive control of response inhibition by the anterior cingulate cortex in autism spectrum disorders. Neuroimage. 2010;52:336–347. doi: 10.1016/j.neuroimage.2010.04.010. [DOI] [PMC free article] [PubMed] [Google Scholar]
- Alexander AL, Lee JE, Lazar M, Boudos R, DuBray MB, Oakes TR, Miller JN, Lu J, Jeong EK, McMahon WM, et al. Diffusion tensor imaging of the corpus callosum in Autism. Neuroimage. 2007;34:61–73. doi: 10.1016/j.neuroimage.2006.08.032. [DOI] [PubMed] [Google Scholar]
- Bargh JA, Williams EL. The automaticity of social life. Curr Dir Psychol Sci. 2006;15:1–4. doi: 10.1111/j.0963-7214.2006.00395.x. [DOI] [PMC free article] [PubMed] [Google Scholar]
- Barnea-Goraly N, Kwon H, Menon V, Eliez S, Lotspeich L, Reiss AL. White matter structure in autism: preliminary evidence from diffusion tensor imaging. Biol Psychiatry. 2004;55:323–326. doi: 10.1016/j.biopsych.2003.10.022. [DOI] [PubMed] [Google Scholar]
- Bölte S, Hubl D, Feineis-Matthews S, Prvulovic D, Dierks T, Poustka F. Facial affect recognition training in autism: can we animate the fusiform gyrus? Behav Neurosci. 2006;120:211–216. doi: 10.1037/0735-7044.120.1.211. [DOI] [PubMed] [Google Scholar]
- Büchel C, Coull JT, Friston KJ. The predictive value of changes in effective connectivity for human learning. Science. 1999;283:1538–1541. doi: 10.1126/science.283.5407.1538. [DOI] [PubMed] [Google Scholar]
- Castellanos FX, Margulies DS, Kelly C, Uddin LQ, Ghaffari M, Kirsch A, Shaw D, Shehzad Z, Di Martino A, Biswal B, et al. Cingulate-precuneus interactions: a new locus of dysfunction in adult attention-deficit/hyperactivity disorder. Biol Psychiatry. 2008;63:332–337. doi: 10.1016/j.biopsych.2007.06.025. [DOI] [PMC free article] [PubMed] [Google Scholar]
- Cherkassky VL, Kana RK, Keller TA, Just MA. Functional connectivity in a baseline resting-state network in autism. Neuroreport. 2006;17:1687–1690. doi: 10.1097/01.wnr.0000239956.45448.4c. [DOI] [PubMed] [Google Scholar]
- Chung MK, Dalton KM, Alexander AL, Davidson RJ. Less white matter concentration in autism: 2D voxel-based morphometry. Neuroimage. 2004;23:242–251. doi: 10.1016/j.neuroimage.2004.04.037. [DOI] [PubMed] [Google Scholar]
- Courchesne E, Karns CM, Davis HR, Ziccardi R, Carper RA, Tigue ZD, Chisum HJ, Moses P, Pierce K, Lord C, et al. Unusual brain growth patterns in early life in patients with autistic disorder: an MRI study. Neurology. 2001;57:245–254. doi: 10.1212/wnl.57.2.245. [DOI] [PubMed] [Google Scholar]
- Damarla SR, Keller TA, Kana RK, Cherkassky VL, Williams DL, Minshew NJ, Just MA. Cortical underconnectivity coupled with preserved visuospatial cognition in autism: evidence from an fMRI study of an embedded figures task. Autism Res. 2010;3:273–279. doi: 10.1002/aur.153. [DOI] [PMC free article] [PubMed] [Google Scholar]
- DePaulo BM, Lindsay JJ, Malone BE, Muhlenbruck L, Charlton K, Cooper H. Cues to deception. Psychol Bull. 2003;129:74–118. doi: 10.1037/0033-2909.129.1.74. [DOI] [PubMed] [Google Scholar]
- Desimone R. Neural mechanisms for visual memory and their role in attention. Proc Natl Acad Sci U S A. 1996;93:13494–13499. doi: 10.1073/pnas.93.24.13494. [DOI] [PMC free article] [PubMed] [Google Scholar]
- Ekman P, O'Sullivan M. Who can catch a liar? Am Psychol. 1991;46:913–920. doi: 10.1037//0003-066x.46.9.913. [DOI] [PubMed] [Google Scholar]
- Frazier TW, Hardan AY. A meta-analysis of the corpus callosum in autism. Biol Psychiatry. 2009;66:935–941. doi: 10.1016/j.biopsych.2009.07.022. [DOI] [PMC free article] [PubMed] [Google Scholar]
- Friston KJ, Holmes AP, Worsley KJ, Poline J-B, Frith CD, Frackowiak RSJ. Statistical parametric maps in functional imaging: a general linear approach. Hum Brain Mapp. 1995;2:189–210. [Google Scholar]
- Geschwind DH, Levitt P. Autism spectrum disorders: developmental disconnection syndromes. Curr Opin Neurobiol. 2007;17:103–111. doi: 10.1016/j.conb.2007.01.009. [DOI] [PubMed] [Google Scholar]
- Haier RJ, Siegel BV, Jr., MacLachlan A, Soderling E, Lottenberg S, Buchsbaum MS. Regional glucose metabolic changes after learning a complex visuospatial/motor task: a positron emission tomographic study. Brain Res. 1992;570:134–143. doi: 10.1016/0006-8993(92)90573-r. [DOI] [PubMed] [Google Scholar]
- Henson RN. Neuroimaging studies of priming. Prog Neurobiol. 2003;70:53–81. doi: 10.1016/s0301-0082(03)00086-8. [DOI] [PubMed] [Google Scholar]
- Herbert MR, Ziegler DA, Makris N, Filipek PA, Kemper TL, Normandin JJ, Sanders HA, Kennedy DN, Caviness VS., Jr Localization of white matter volume increase in autism and developmental language disorder. Ann Neurol. 2004;55:530–540. doi: 10.1002/ana.20032. [DOI] [PubMed] [Google Scholar]
- Hollander E, Anagnostou E, Chaplin W, Esposito K, Haznedar MM, Licalzi E, Wasserman S, Soorya L, Buchsbaum M. Striatal volume on magnetic resonance imaging and repetitive behaviors in autism. Biol Psychiatry. 2005;58:226–232. doi: 10.1016/j.biopsych.2005.03.040. [DOI] [PubMed] [Google Scholar]
- Hollingshead AB. Two-factor index of social position. New Haven (CT): Yale University, Department of Sociology; 1957. [Google Scholar]
- Jones TB, Bandettini PA, Kenworthy L, Case LK, Milleville SC, Martin A, Birn RM. Sources of group differences in functional connectivity: an investigation applied to autism spectrum disorder. Neuroimage. 2010;49:401–414. doi: 10.1016/j.neuroimage.2009.07.051. [DOI] [PMC free article] [PubMed] [Google Scholar]
- Just MA, Cherkassky VL, Keller TA, Kana RK, Minshew NJ. Functional and anatomical cortical underconnectivity in autism: evidence from an FMRI study of an executive function task and corpus callosum morphometry. Cereb Cortex. 2007;17:951–961. doi: 10.1093/cercor/bhl006. [DOI] [PMC free article] [PubMed] [Google Scholar]
- Just MA, Cherkassky VL, Keller TA, Minshew NJ. Cortical activation and synchronization during sentence comprehension in high-functioning autism: evidence of underconnectivity. Brain. 2004;127:1811–1821. doi: 10.1093/brain/awh199. [DOI] [PubMed] [Google Scholar]
- Kana RK, Keller TA, Cherkassky VL, Minshew NJ, Just MA. Sentence comprehension in autism: thinking in pictures with decreased functional connectivity. Brain. 2006;129:2484–2493. doi: 10.1093/brain/awl164. [DOI] [PMC free article] [PubMed] [Google Scholar]
- Kana RK, Keller TA, Cherkassky VL, Minshew NJ, Just MA. Atypical frontal-posterior synchronization of Theory of Mind regions in autism during mental state attribution. Soc Neurosci. 2009;4:135–152. doi: 10.1080/17470910802198510. [DOI] [PMC free article] [PubMed] [Google Scholar]
- Kana RK, Keller TA, Minshew NJ, Just MA. Inhibitory control in high-functioning autism: decreased activation and underconnectivity in inhibition networks. Biol Psychiatry. 2007;62:198–206. doi: 10.1016/j.biopsych.2006.08.004. [DOI] [PMC free article] [PubMed] [Google Scholar]
- Keller TA, Kana RK, Just MA. A developmental study of the structural integrity of white matter in autism. Neuroreport. 2007;18:23–27. doi: 10.1097/01.wnr.0000239965.21685.99. [DOI] [PubMed] [Google Scholar]
- Kelly AM, Garavan H. Human functional neuroimaging of brain changes associated with practice. Cereb Cortex. 2005;15:1089–1102. doi: 10.1093/cercor/bhi005. [DOI] [PubMed] [Google Scholar]
- Kleinhans NM, Johnson LC, Richards T, Mahurin R, Greenson J, Dawson G, Aylward E. Reduced neural habituation in the amygdala and social impairments in autism spectrum disorders. Am J Psychiatry. 2009;166:467–475. doi: 10.1176/appi.ajp.2008.07101681. [DOI] [PubMed] [Google Scholar]
- Kleinhans NM, Richards T, Sterling L, Stegbauer KC, Mahurin R, Johnson LC, Greenson J, Dawson G, Aylward E. Abnormal functional connectivity in autism spectrum disorders during face processing. Brain. 2008;131:1000–1012. doi: 10.1093/brain/awm334. [DOI] [PubMed] [Google Scholar]
- Klin A, Jones W, Schultz R, Volkmar F, Cohen D. Visual fixation patterns during viewing of naturalistic social situations as predictors of social competence in individuals with autism. Arch Gen Psychiatry. 2002;59:809–816. doi: 10.1001/archpsyc.59.9.809. [DOI] [PubMed] [Google Scholar]
- Koch K, Wagner G, Dahnke R, Schachtzabel C, Gullmar D, Reichenbach JR, Schlosser RG. Structure-function relationships in the context of reinforcement-related learning: a combined diffusion tensor imaging-functional magnetic resonance imaging study. Neuroscience. 2010;168:190–199. doi: 10.1016/j.neuroscience.2010.03.026. [DOI] [PubMed] [Google Scholar]
- Konrad K, Eickhoff SB. Is the ADHD brain wired differently? A review on structural and functional connectivity in attention deficit hyperactivity disorder. Hum Brain Mapp. 2010;31:904–916. doi: 10.1002/hbm.21058. [DOI] [PMC free article] [PubMed] [Google Scholar]
- Koshino H, Carpenter PA, Minshew NJ, Cherkassky VL, Keller TA, Just MA. Functional connectivity in an fMRI working memory task in high-functioning autism. Neuroimage. 2005;24:810–821. doi: 10.1016/j.neuroimage.2004.09.028. [DOI] [PubMed] [Google Scholar]
- Koshino H, Kana RK, Keller TA, Cherkassky VL, Minshew NJ, Just MA. fMRI investigation of working memory for faces in autism: visual coding and underconnectivity with frontal areas. Cereb Cortex. 2008;18:289–300. doi: 10.1093/cercor/bhm054. [DOI] [PMC free article] [PubMed] [Google Scholar]
- Kumar A, Sundaram SK, Sivaswamy L, Behen ME, Makki MI, Ager J, Janisse J, Chugani HT, Chugani DC. Alterations in frontal lobe tracts and corpus callosum in young children with autism spectrum disorder. Cereb Cortex. 2010;20:2103–2113. doi: 10.1093/cercor/bhp278. [DOI] [PubMed] [Google Scholar]
- Lee PS, Yerys BE, Della Rosa A, Foss-Feig J, Barnes KA, James JD, VanMeter J, Vaidya CJ, Gaillard WD, Kenworthy LE. Functional connectivity of the inferior frontal cortex changes with age in children with autism spectrum disorders: a fcMRI study of response inhibition. Cereb Cortex. 2009;19:1787–1794. doi: 10.1093/cercor/bhn209. [DOI] [PMC free article] [PubMed] [Google Scholar]
- Lombardo MV, Chakrabarti B, Bullmore ET, Sadek SA, Pasco G, Wheelwright SJ, Suckling J, Baron-Cohen S. Atypical neural self-representation in autism. Brain. 2010;133:611–624. doi: 10.1093/brain/awp306. [DOI] [PubMed] [Google Scholar]
- Lord C, Rutter M, DiLavore P, Risi S. Autism diagnostic observation schedule. Los Angeles (CA): Western Psychological Services; 2001. [Google Scholar]
- Lord C, Rutter M, LeCouteur A. Autism Diagnostic Interview-Revised: a revised version of a diagnostic interview for caregivers of individuals with possible pervasive developmental disorders. J Autism Dev Disord. 1994;24:659–685. doi: 10.1007/BF02172145. [DOI] [PubMed] [Google Scholar]
- Lustig C, Buckner RL. Preserved neural correlates of priming in old age and dementia. Neuron. 2004;42:865–875. doi: 10.1016/j.neuron.2004.04.002. [DOI] [PubMed] [Google Scholar]
- Marsh AA, Finger EC, Mitchell DG, Reid ME, Sims C, Kosson DS, Towbin KE, Leibenluft E, Pine DS, Blair RJ. Reduced amygdala response to fearful expressions in children and adolescents with callous-unemotional traits and disruptive behavior disorders. Am J Psychiatry. 2008;165:712–720. doi: 10.1176/appi.ajp.2007.07071145. [DOI] [PubMed] [Google Scholar]
- Mason RA, Williams DL, Kana RK, Minshew N, Just MA. Theory of Mind disruption and recruitment of the right hemisphere during narrative comprehension in autism. Neuropsychologia. 2008;46:269–280. doi: 10.1016/j.neuropsychologia.2007.07.018. [DOI] [PMC free article] [PubMed] [Google Scholar]
- Meyer-Lindenberg A, Poline JB, Kohn PD, Holt JL, Egan MF, Weinberger DR, Berman KF. Evidence for abnormal cortical functional connectivity during working memory in schizophrenia. Am J Psychiatry. 2001;158:1809–1817. doi: 10.1176/appi.ajp.158.11.1809. [DOI] [PubMed] [Google Scholar]
- Mizuno A, Villalobos ME, Davies MM, Dahl BC, Müller RA. Partially enhanced thalamocortical functional connectivity in autism. Brain Res. 2006;1104:160–174. doi: 10.1016/j.brainres.2006.05.064. [DOI] [PubMed] [Google Scholar]
- Mostofsky SH, Goldberg MC, Landa RJ, Denckla MB. Evidence for a deficit in procedural learning in children and adolescents with autism: implications for cerebellar contribution. J Int Neuropsychol Soc. 2000;6:752–759. doi: 10.1017/s1355617700677020. [DOI] [PubMed] [Google Scholar]
- Mostofsky SH, Powell SK, Simmonds DJ, Goldberg MC, Caffo B, Pekar JJ. Decreased connectivity and cerebellar activity in autism during motor task performance. Brain. 2009;132:2413–2425. doi: 10.1093/brain/awp088. [DOI] [PMC free article] [PubMed] [Google Scholar]
- Müller RA, Cauich C, Rubio MA, Mizuno A, Courchesne E. Abnormal activity patterns in premotor cortex during sequence learning in autistic patients. Biol Psychiatry. 2004;56:323–332. doi: 10.1016/j.biopsych.2004.06.007. [DOI] [PubMed] [Google Scholar]
- Murias M, Webb SJ, Greenson J, Dawson G. Resting state cortical connectivity reflected in EEG coherence in individuals with autism. Biol Psychiatry. 2007;62:270–273. doi: 10.1016/j.biopsych.2006.11.012. [DOI] [PMC free article] [PubMed] [Google Scholar]
- Noonan SK, Haist F, Muller RA. Aberrant functional connectivity in autism: evidence from low-frequency BOLD signal fluctuations. Brain Res. 2009;1262:48–63. doi: 10.1016/j.brainres.2008.12.076. [DOI] [PMC free article] [PubMed] [Google Scholar]
- Packard MG, Knowlton BJ. Learning and memory functions of the basal ganglia. Annu Rev Neurosci. 2002;25:563–593. doi: 10.1146/annurev.neuro.25.112701.142937. [DOI] [PubMed] [Google Scholar]
- Pelphrey K, Adolphs R, Morris JP. Neuroanatomical substrates of social cognition dysfunction in autism. Ment Retard Dev Disabil Res Rev. 2004;10:259–271. doi: 10.1002/mrdd.20040. [DOI] [PubMed] [Google Scholar]
- Plaisted K, O'Riordan M, Baron-Cohen S. Enhanced discrimination of novel, highly similar stimuli by adults with autism during a perceptual learning task. J Child Psychol Psychiatry. 1998;39:765–775. [PubMed] [Google Scholar]
- Pugh KR, Mencl WE, Shaywitz BA, Shaywitz SE, Fulbright RK, Constable RT, Skudlarski P, Marchione KE, Jenner AR, Fletcher JM, et al. The angular gyrus in developmental dyslexia: task-specific differences in functional connectivity within posterior cortex. Psychol Sci. 2000;11:51–56. doi: 10.1111/1467-9280.00214. [DOI] [PubMed] [Google Scholar]
- Reitan RM. Halstead-Reitan neuropsychological test battery. Tucson (AZ): Reitan Neuropsychological Laboratories, University of Arizona; 1985. [Google Scholar]
- Salimpoor VN, Chang C, Menon V. Neural basis of repetition priming during mathematical cognition: repetition suppression or repetition enhancement? J Cogn Neurosci. 2010;22:790–805. doi: 10.1162/jocn.2009.21234. [DOI] [PMC free article] [PubMed] [Google Scholar]
- Schmitz N, Rubia K, van Amelsvoort T, Daly E, Smith A, Murphy DG. Neural correlates of reward in autism. Br J Psychiatry. 2008;192:19–24. doi: 10.1192/bjp.bp.107.036921. [DOI] [PubMed] [Google Scholar]
- Scott-Van Zeeland AA, Dapretto M, Ghahremani DG, Poldrack RA, Bookheimer SY. Reward processing in autism. Autism Res. 2010;3:53–67. doi: 10.1002/aur.122. [DOI] [PMC free article] [PubMed] [Google Scholar]
- Scott-Van Zeeland AA, McNealy K, Wang AT, Sigman M, Bookheimer SY, Dapretto M. No neural evidence of statistical learning during exposure to artificial languages in children with autism spectrum disorders. Biol Psychiatry. 2010;68:345–351. doi: 10.1016/j.biopsych.2010.01.011. [DOI] [PMC free article] [PubMed] [Google Scholar]
- Semrud-Clikeman M, Filipek PA, Biederman J, Steingard R, Kennedy D, Renshaw P, Bekken K. Attention-deficit hyperactivity disorder: magnetic resonance imaging morphometric analysis of the corpus callosum. J Am Acad Child Adolesc Psychiatry. 1994;33:875–881. doi: 10.1097/00004583-199407000-00014. [DOI] [PubMed] [Google Scholar]
- Solomon M, Ozonoff SJ, Ursu S, Ravizza S, Cummings N, Ly S, Carter CS. The neural substrates of cognitive control deficits in autism spectrum disorders. Neuropsychologia. 2009;47:2515–2526. doi: 10.1016/j.neuropsychologia.2009.04.019. [DOI] [PMC free article] [PubMed] [Google Scholar]
- Sundaram SK, Kumar A, Makki MI, Behen ME, Chugani HT, Chugani DC. Diffusion tensor imaging of frontal lobe in autism spectrum disorder. Cereb Cortex. 2008;18:2659–2665. doi: 10.1093/cercor/bhn031. [DOI] [PMC free article] [PubMed] [Google Scholar]
- Toni I, Rowe J, Stephan KE, Passingham RE. Changes of cortico-striatal effective connectivity during visuomotor learning. Cereb Cortex. 2002;12:1040–1047. doi: 10.1093/cercor/12.10.1040. [DOI] [PubMed] [Google Scholar]
- Turner KC, Frost L, Linsenbardt D, McIlroy JR, Müller RA. Atypically diffuse functional connectivity between caudate nuclei and cerebral cortex in autism. Behav Brain Funct. 2006;2:34. doi: 10.1186/1744-9081-2-34. [DOI] [PMC free article] [PubMed] [Google Scholar]
- Tzourio-Mazoyer N, Landeau B, Papathanassiou D, Crivello F, Etard O, Delcroix N, Mazoyer B, Joliot M. Automated anatomical labeling of activations in SPM using a macroscopic anatomical parcellation of the MNI MRI single-subject brain. Neuroimage. 2002;15:273–289. doi: 10.1006/nimg.2001.0978. [DOI] [PubMed] [Google Scholar]
- Villalobos ME, Mizuno A, Dahl BC, Kemmotsu N, Müller RA. Reduced functional connectivity between V1 and inferior frontal cortex associated with visuomotor performance in autism. Neuroimage. 2005;25:916–925. doi: 10.1016/j.neuroimage.2004.12.022. [DOI] [PMC free article] [PubMed] [Google Scholar]
- Waites AB, Briellmann RS, Saling MM, Abbott DF, Jackson GD. Functional connectivity networks are disrupted in left temporal lobe epilepsy. Ann Neurol. 2006;59:335–343. doi: 10.1002/ana.20733. [DOI] [PubMed] [Google Scholar]
- Wang F, Kalmar JH, He Y, Jackowski M, Chepenik LG, Edmiston EE, Tie K, Gong G, Shah MP, Jones M, et al. Functional and structural connectivity between the perigenual anterior cingulate and amygdala in bipolar disorder. Biol Psychiatry. 2009;66:516–521. doi: 10.1016/j.biopsych.2009.03.023. [DOI] [PMC free article] [PubMed] [Google Scholar]
- Wicker B, Fonlupt P, Hubert B, Tardif C, Gepner B, Deruelle C. Abnormal cerebral effective connectivity during explicit emotional processing in adults with autism spectrum disorder. Soc Cogn Affect Neurosci. 2008;3:135–143. doi: 10.1093/scan/nsn007. [DOI] [PMC free article] [PubMed] [Google Scholar]
- Witelson SF. Hand and sex differences in the isthmus and genu of the human corpus callosum: a postmortem morphological study. Brain. 1989;112:799–835. doi: 10.1093/brain/112.3.799. [DOI] [PubMed] [Google Scholar]
- Zikopoulos B, Barbas H. Changes in prefrontal axons may disrupt the network in autism. J Neurosci. 2010;30:14595–14609. doi: 10.1523/JNEUROSCI.2257-10.2010. [DOI] [PMC free article] [PubMed] [Google Scholar]
Associated Data
This section collects any data citations, data availability statements, or supplementary materials included in this article.