Abstract
To this day, computer models for stromatolite formation have made substantial use of the Kardar–Parisi–Zhang (KPZ) equation. Oddly enough, these studies yielded mutually exclusive conclusions about the biotic or abiotic origin of such structures. We show in this paper that, at our current state of knowledge, a purely biotic origin for stromatolites can neither be proved nor disproved by means of a KPZ-based model. What can be shown, however, is that whatever their (biotic or abiotic) origin might be, some morphologies found in actual stromatolite structures (e.g. overhangs) cannot be formed as a consequence of a process modelled exclusively in terms of the KPZ equation and acting over sufficiently large times. This suggests the need to search for alternative mathematical approaches to model these structures, some of which are discussed in this paper.
Keywords: pattern formation, stromatolites, Kardar–Parisi–Zhang equation, origin of life
1. Introduction
The detection of the oldest remnants of life on the Earth is an important scientific problem. Indeed, it is crucial to set the timing of life in the only planet where matter is known to have self-organized to yield complex shapes and behaviour. The search for remnants of the earliest life is conducted along four different paths, namely: (i) the identification of carbonaceous decorated microstructures displaying shapes characteristic of primitive life and unable to form solely by mineral precipitation [1,2]; (ii) the search for reduced carbon or sulphur with an isotopic signature characteristic of life [3,4]; (iii) the detection of organic molecules that may be exclusively derived from biochemical degradation of once living organisms [5,6]; and (iv) the study of sedimentary structures, named stromatolites [7–10] that are thought to be built by microbial communities. Each of these approaches meets considerable difficulties [11,12]. For instance, very old microstructures with complex shapes are not easily distinguished, neither morphologically nor chemically, from self-ordered mineral assemblies [13]. On the other hand, the isotopic signatures of carbon compounds formed by purely mineral reactions such as Fischer–Tropp cycles are very similar to those appearing in biological reactions [14]. To this day, the so-called molecular fossils are the most solid evidence for life, but the technology available for their recognition can only be applied when the geological context is well-known and therefore the singenicity of the fossils can be assured [15,16]. All these concerns and limitations have made the laminated, accretionary structures called stromatolites important pieces in the search for life's infancy [17,18]. Indeed, as some stromatolites are thought to date back as far as about 3.5 Ga [9,19–22], their possible biotic origin would have deep consequences for our current views on how, and when, life started on the Earth.
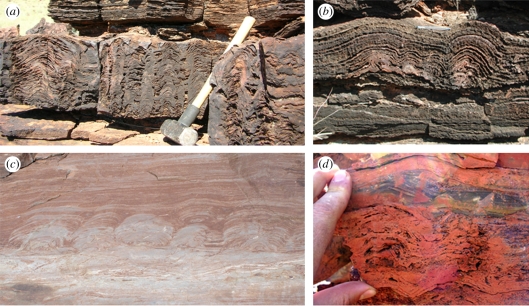
The relevance of stromatolites in the context of the search for life's origin originates in their complex shape and structure, which in modern extant examples is, undoubtedly, the result of a cooperative microbiological behaviour [23–27]. They appear as sedimentary laminated structures whose sizes range from a few millimetres for an individual to a kilometre for reefs made of many individuals, and displaying corrugated surfaces and sometimes columnar shapes with a rich variety of patterns (e.g. [17,22,23] and figure 1). But, interestingly, stromatolites cannot be considered as proper fossils. Like termite mounds, see figure 2, stromatolites being currently formed are not actual biological organisms, but petrological structures built by living organisms and rarely preserve detectable organismal remnants of their putative builders or users. However, while the complexity of termite mounds structures rules out a non-biotic origin, the much simpler structures of stromatolites require that the possibility of a non-biological origin has to be explored, particularly for the case of many Archean and some Proterozoic stromatolites.
Figure 1.
Stromatolitic pattern from (a), (b) ca 2.7 Ga Tumbiana formation; (c) ca 1.8 Ga Duck Creek Dolomite; (d) ca 3.49 Ga Dresser formation.
Figure 2.
In the biotic scenario, ancient stromatolites are viewed not as biological entities, but as the result of biological activity from organisms that are no longer present, and from which no biological record remains. The situation would be much like a termite mound, as depicted above, once insects had left.
Biotic or abiotic in origin, stromatolite pattern formation needs to be better understood. By this, we mean the issue of ascertaining the way in which the three-dimensional topographies and textures of these rock structures are built up. Modern stromatolites provide the only dynamic models available for experimentation [28–31]. Such limitations emphasize the importance of insights gained from mathematical models of stromatolite morphogenesis. To provide useful information, mathematical models should be able to represent those physical processes likely to be involved in stromatolite formation (mainly associated with precipitation and sedimentation) and the influence (if any) of the growth of mats on these processes. Moreover, analyses and simulation of the corresponding models should shed light into the manner in which stromatolites are formed. To the best of our knowledge, mathematical models of stromatolite formation have been proposed and discussed only recently [32–34]. The choice of equations selected to model their formation basically reduces to the so-called Kardar–Parisi–Zhang (KPZ) stochastic equation [35]
| 1.1 |
which provides a classical model to describe the growth of an interface, whose position is identified by a height function h, separating a growing medium which advances into a receding one under the effect of random fluctuations η [35–37]. The KPZ equation has been postulated for many different types of systems, from polymers to vortex lines, domain walls, thin films, to biophysical systems. In our context, the interface position h is identified with the boundaries of the laminae displayed in stromatolites. For instance, in Grotzinger & Rothman [32], the authors propose that a model based on a KPZ equation is able to reproduce some morphological features (fractal dimension, power spectra, …) observed in some stromatolite specimens and they claim a possible purely abiotic origin for stromatolite formation. On the other hand, a particular limit of the deterministic KPZ equation (where noise effects are ignored) has been studied [33,34], where a biotic origin for stromatolite structures is proposed. The use of similar equations to support mutually exclusive conclusions raises at once the question: what features of stromatolite formation can actually be inferred from the analysis of simple mathematical models of which KPZ is an example? In this paper, we claim that, at our current state of knowledge, a purely biotic origin for stromatolites cannot be proved (nor disproved) by means of a KPZ-based mathematical model. The reason is that each term in equation (1.1) can be shown to correspond to a physical process (diffusion, convection, sedimentation, precipitation …) which can be of a biotic or abiotic nature, both cases being indistinguishable in the absence of further information. What can be shown, however, is that whatever their (biotic or abiotic) origin may be, some stromatolite morphologies cannot be formed as a consequence of a process modelled exclusively in terms of equation (1.1) and acting over sufficiently large times.
We conclude this introduction by describing the plan of this paper. We first recall in §2 some basic facts concerning the KPZ equation. In particular, the physical meaning of each term in that equation is described. We then address in §3, the main issue in this work. More precisely, we compare the behaviour of solutions to KPZ with the laminar morphologies observed in some stromatolite samples. In particular, it is observed that some of the former are not compatible with a formation process basically described by a KPZ equation. Section 4 contains a discussion on the relevance of KPZ in our current context, and some directions to model stromatolite formation are suggested to gain insight into stromatolite pattern formation. Finally, a number of technical results related to the physical derivation of KPZ in the context of kinetic roughening, as well as on the mathematical properties of that equation, are gathered in electronic supplementary material, appendices A and B at the end of the paper.
2. The meaning of Kardar–Parisi–Zhang equation
The KPZ equation (1.1) is a classical model for kinetic roughening. This last term denotes the general problem of describing how microscopic fluctuations, which are present in virtually any interface displacement process, eventually develop into large-scale behaviours with universal, observable properties [37]. As mentioned, in equation (1.1), h = h(x,t) denotes the position of an interface separating an advancing medium which is invading a receding one;  represents a space coordinate in a d-dimensional space (d ≥ 1), t stands for time, ν , λ and F are positive parameters to be discussed below; and η(x,t) is a Gaussian noise characterized by its two first moments
| 2.1 |
and
| 2.2 |
where D is a positive parameter known as the noise amplitude and δ(·) is Dirac's delta function, so that δ(x) = 0 for x ≠ 0, and  , where d ≥1 is the dimension of the space where the previous integral is considered. Conditions (2.1) and (2.2) are usually rephrased by stating that the noise term η(x,t) in equation (1.1) has zero mean, a variance given by D and correlations are considered negligible.
At this juncture, we should stress that equation (1.1) is a continuous equation, by which we mean that x can be any point in ℝd and t can be any positive real number. While particularly convenient for mathematical treatment, continuous equations are generally understood as suitable approximations to discrete ones. The latter are characterized by being formulated in discrete domains, with given time and space unit lengths Δt and Δx.
Modelling particular aspects of stromatolite formation by means of the KPZ equation raises at once a number of questions, as for instance:
How can equation (1.1) be derived from first principles, and which physical assumptions need to be considered to that end?
What is the physical meaning of parameters ν, λ and F in equation (1.1), and how can they be related to experimental measurements?
Which types of behaviour do solutions to equation (1.1) display, and what relation (if any) exists between such behaviours and stromatolite morphologies.
The mathematically oriented reader will find a discussion on points (i) and (ii) (respectively, (iii)) above in electronic supplementary material, appendix A (respectively, in electronic supplementary material, appendix B). Here, we merely describe the main conclusions that result from electronic supplementary material, appendix A concerning the physical meaning of the terms arising in the KPZ equation.
To begin with, equation (1.1) represents an approximation, obtained under a number of simplifying hypotheses, to a large class of non-equilibrium processes. These are characterized by the coexistence of two different media (or phases), one of which is advancing into the other. Both media are separated by a comparatively thin, moving interface. The location of such interface at any space coordinate x and time t is given by a function h(x,t), sometimes termed the interface height, whose evolution in time is governed by equation (1.1). Parameter λ represents the interface velocity along its normal direction. Such value is thus assumed to be constant in time. On the other hand, ν > 0 is the (material) diffusion coefficient along the interface and F is an external forcing term that has dimensions of velocity. Denoting by [u] the dimensions of a quantity u, we thus have
| 2.3 |
On its turn, the effect of noise on the interface motion is encoded in the term η(x,t) whose properties (zero mean noise, amplitude given by D > 0) have been recalled before. As a matter of fact, in the particular setting discussed in electronic supplementary material, appendix A, ν, λ and F can be related to some material properties of the interface as the interfacial tension σ and the effective interface mobility Γ (that is the interface speed per unit of bending force measured along the normal direction to the interface), as well as to an external driving potential (necessary for the interface motion), μ0 by means of the relations
| 2.4 |
hence
 |
2.5 |
Note that equation (2.3) is consistent with equations (2.4) and (2.5). In view of our previous discussion, we may say that equation (1.1) describes interface motion under the action of four superposing effects. These are represented by the four terms on the right-hand side (r.h.s.) of equation (1.1) and correspond to diffusion, growth, external forcing and noise. Diffusion at the interface is characterized by the diffusion coefficient ν given in equation (2.4), whereas the mean interface velocity in equation (2.4), which is the key player in the interface motion, is given by λ. Except for the noise term η(x,t), no additional effect is considered to be relevant for interface motion. At this modelling level, the particular physico-chemical properties of any given process under consideration are contained in the material parameters σ and Γ, the external potential at work μ0, and the noise term η(x,t). In the absence of further specifications, it is impossible to assign to any of them a biotic or abiotic origin. Therefore, the use of the KPZ equation in itself does not provide any hint about the biotic (or abiotic) nature of the process being modelled.
3. A test for mathematical modelling: stromatolite band interfaces
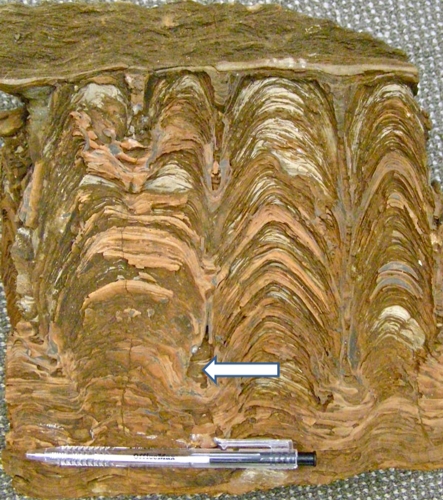
In this section, we address the issue of discussing which morphological features (if any) of stromatolites can be efficiently modelled by means of the KPZ equation (1.1). Following earlier studies [32–34], we shall concentrate on the formation of laminae, and more precisely on that of their separating interfaces, which constitute a characteristic feature of stromatolites. To be more specific, we will select a sample recently collected from the 2.724 Ga Tumbiana formation in the Fortescue Group (Australia), to be referred henceforth as the Andalusian Hill (AH) specimen, a picture of which is shown in figure 3.
Figure 3.
A stromatolitic sample from 2.7 Ga Tumbiana formation (Andalusian Hill). The arrow indicates the location of an overhang that cannot be described by the KPZ equation.
A central point in our analysis consists of ascertaining whether the band interfaces observed in the previous figure can be somehow associated with the sequential profiles of a function h(x,t) which solves equation (1.1) for a suitable choice of the parameters ν, λ and D therein. This is the basic assumption made [32,33]. For instance, in an earlier study [32] authors assert that, under suitable assumptions on the equation parameters ‘numerical solutions of equation (1.1) (our notation) yield interfaces that evolve to a statistical steady state with fractal dimension Df (our notation) ≅ 2.6 independent of the initial conditions. Assuming that our measurement of Df ≅ 2.5 is not significantly different from the theoretical prediction of Df ≅ 2.6, our theoretical description is consistent with our quantitative measurements’.
We have quoted in some detail the previous excerpt from the study of Grotzinger & Rothman [32] as it clearly illustrates an implicit assumption often made at the modelling stage. More precisely, it is widely assumed that the bands actually observed in rock samples correspond to what is called in mathematics an asymptotic pattern. By this, we mean a surface morphology to which any solution resembles, irrespective of its initial profile, after a sufficiently large time has elapsed. However, before an asymptotic pattern (assumed to exist) unfolds, solutions go through what is called a transient period. During such a period, solutions may display features quite different from their asymptotic morphology. Incidentally, the transient period may be quite long and there seems to be no general technique to a priori estimate its duration.
Actually, when looking for asymptotic patterns in equations similar to equation (1.1), serious mathematical difficulties are encountered which reflect underlying, deep scientific problems. In particular, and as a consequence of the presence of noise terms like η(x,t) in these equations, no general existence theory for solutions of nonlinear stochastic partial differential equations is available mainly for high space dimensions d (cf. [38]). This fact notwithstanding a wealth of results, mainly numerical simulations, have been obtained for equation (1.1) [37,39,40], a solution to the one-dimensional case having been achieved only very recently (see [41] and references therein). Although results suggested by these simulations are not always compatible among themselves, altogether they provide significant information about processes governed by the KPZ equation, as will be noticed below. On the other hand, if the noise term η(x,t) in equation (1.1) is dropped, a convenient existence theory is at hand for the deterministic equation thus obtained [42,43]. Furthermore, in these papers, a complete characterization of the solutions to this equation is presented, and the conditions under which non-uniqueness takes place are found.
Let us consider the question of describing what morphologies can be identified, for sufficiently large times, in the interface height h(x,t) of a process governed by equation (1.1). As it turns out, in order to obtain a meaningful answer, the previous question needs to be carefully reformulated. First of all, different morphologies may be obtained, each of them being an appropriate approximation over different periods of time. The latter may be quite large, reaching up to the scale of 104–106 years characteristic of carbonate platform deposition. Such different transient periods are separated by crossover times, for which only rough estimates can be provided. Moreover, as a consequence of the stochastic nature of equation (1.1), the asymptotic morphologies for which a theory exists correspond to some average interface properties, but not to the interface height itself. Fortunately enough, these interface-related quantities on which patterns can be shown to unfold have a clear morphological meaning as discussed below.
3.1. Evolution of the interface width in Kardar–Parisi–Zhang equation: crossover times
Consider first the simpler idealized case d = 1, in which the interface position depends on a single spatial coordinate, and on time. Then solutions are known to develop different features as time passes, as recalled next.
Bearing in mind the morphologies actually observed in stromatolite samples, we shall focus herein on a quantity associated with solutions of equation (1.1), the interface width W(t), which is defined as follows. Consider a medium of length L > 0, divided into N equal intervals Ii(1 ≤ i ≤ N), each having a size Δx. Let h(xi,t) be the average value of h(x,t) on each interval Ii. Then, the average value of h(x,t) at time t,  is given by
 |
3.1 |
and the interface width W(t) is defined as follows:
 |
3.2 |
Therefore, W(t) represents the mean quadratic deviation of the interface height around its average value, a measure of the roughness of the interface itself. Suppose now that at t = 0, the interface is flat so that
| 3.3 |
Then for sufficiently small times, the corresponding solution is expected to remain almost flat as well, so that the first and second terms on the r.h.s. of equation (1.1) are negligible, and equation (1.1) can be effectively replaced by the so-called random deposition (RD) equation
| 3.4 |
Notice that the term F in equation (3.4) can be dispensed with upon replacing h by h − Ft. For equation (3.4), it is known that, after some regularization [37]
| 3.5 |
where W(t) ∼ f(t) for suitable times t is to be understood as follows: there exist positive constants C1, C2 such that C1f(t) ≤ W(t) ≤ C2f(t) in the range of times under consideration.
As time passes, solutions to equations (1.1) and (3.3) begin to develop non-flat profiles, so that the terms of equation (1.1) which were discarded to obtain equation (3.4) become relevant. In view of the assumptions made in electronic supplementary material, appendix A to derive equation (1.1), the new term to be retained is the first on the r.h.s. of equation (1.1). One thus obtains the so-called Edwards–Wilkinson (EW) equation
| 3.6 |
The transition from the range of validity of equation (3.4) to that of equation (3.6) occurs at a first crossover time, t1C that can be estimated as follows
| 3.7 |
where Δx is the length scale corresponding to the discrete process of which equation (3.7) represents a continuous approximation. Equation (3.6) is linear and can be explicitly solved. It can be shown that for such equation
| 3.8 |
Finally, when t > t1C becomes large enough, all terms in equation (1.1) become relevant, and the full equation (1.1) needs to be considered. Transition from EW equation (3.6) to the KPZ equation (1.1) takes place at a second crossover time t2C, which is such that [36]
| 3.9 |
For convenience of the reader, let us compute t2C in a hypothetical situation, where
 |
then equation (3.9) yields t2C ∼ 10−3 years, that is, a few hours. This fact is consistent with the assumptions made that correspond to a fast-growing process. On the other hand, for the same value of ν as before, taking
gives t2C ∼ 107 years. Note the strong dependence of formula (3.19) on the values of the parameters involved.
Once the full equation (1.1) has been developed, the interface width W(t) continues to exhibit a power-like growth first.
| 3.10 |
to eventually saturate to an  -dependent value
| 3.11 |
This happens for times t > ts, where ts is the saturation time [37]
| 3.12 |
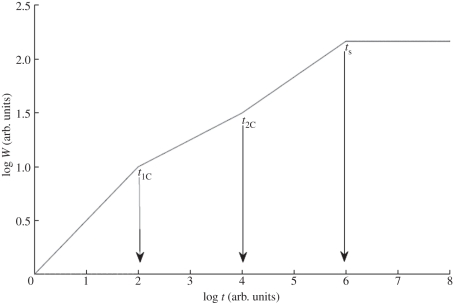
The set of parameters α, z and β = α/z (whose meaning will be explained in electronic supplementary material, appendix B) are called the critical exponents for the KPZ equation in one space dimension. They are also said to characterize the dynamical scaling corresponding to that equation. The dependence of W(t) on the subsequent crossover times is sketched in figure 4.
Figure 4.
Time evolution of the surface width for the KPZ equation in dimension d = 1. The slopes of the straight lines are 1/2, 1/4, 1/3, left to right. Crossover times t1C, t2C and saturation time ts are indicated by arrows.
To conclude this paragraph, we remark that results similar to those previously described continue to hold when, instead of equation (3.3), we consider initial data that are close enough to a flat profile. For instance, this is the case when we take h(x,0) in the form of a small oscillation with small amplitude, a situation appropriate as a starting point for stromatolite formation.
3.2. Interface patterns in different transient regions
We next provide some simulations to illustrate the morphologies that can be generated by means of KPZ-type equations. Consider first the earliest stages of a process governed by equation (1.1) with h(x,0) being a small-amplitude sinusoidal function. As observed before, that transient is governed by an RD equation (3.4). A plot of the unfolding profiles is given in figure 5.
Figure 5.
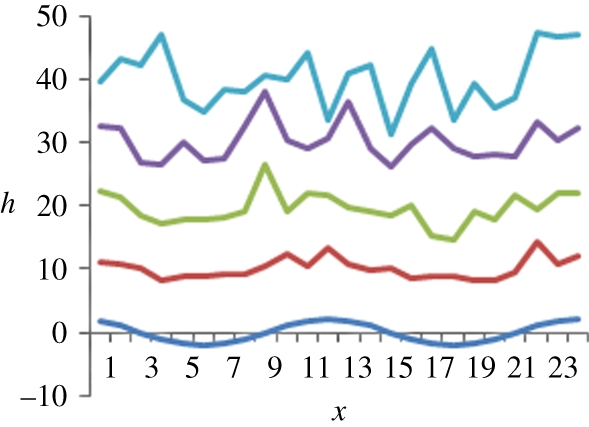
Simulated profiles at different times for solutions of the RD equation for which the initial condition is a small-amplitude sinusoidal profile. Here F = 10 and D = 1. Snapshots correspond to times: dark blue, t = 0; red, t = 1; green, t = 2; purple, t = 3; light blue, t = 4.
Concerning our previous figure, some remarks are in order. First, some memory of the initial condition is preserved during the times considered, although the initial profile is increasingly distorted owing to stochastic effects. At the technical level, what is shown in figure 5 is a (explicit) realization of the stochastic process that can be shown to provide a solution to the problem under consideration. Such realization can be shown to be discontinuous almost everywhere, although the plots actually given above have been made continuous for ease of visualization. Namely, in the numerical computation, we have discretized the equation in space, and have solved it on a finite number of nodes. Then, we have plotted the values of the solution in the different nodes, linking the values of first neighbours with straight lines.
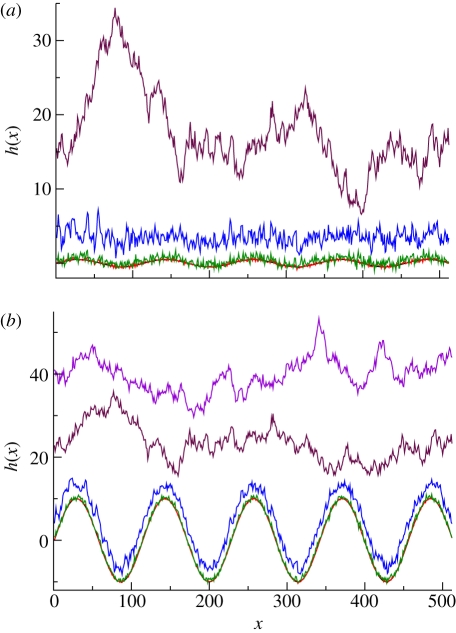
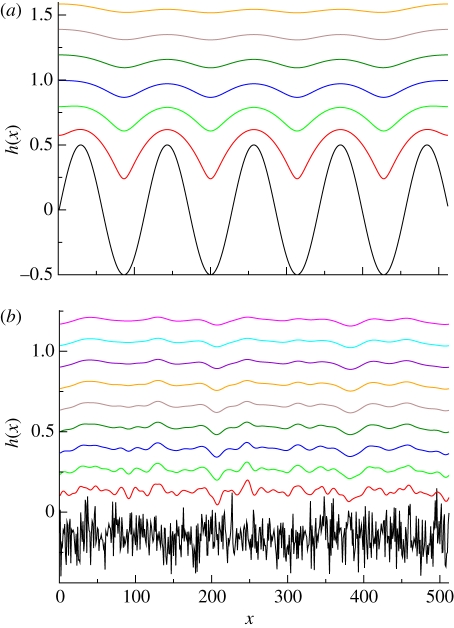
We next consider the full KPZ equation (1.1) with same initial value as before, and simulate the solution profiles in each of the subsequent regimes (RD, EW and KPZ). Without loss of generality, we may set F = 0, as this amounts to replacing h(x,t) by (h(x,t) − Ft) there. The corresponding results are illustrated in figure 6. Figure 6a displays the evolution starting out from an initial sinusoidal shape of small amplitude, while figure 6b shows snapshots of the dynamics corresponding to an initial sinusoidal shape with the same wavelength, but with a larger amplitude that is comparable with the roughness of the stationary state. Comparing the two panels, we see that the long time morphologies (e.g. t = 100, 1000 in the plots) are disordered and rough, independent of the initial condition, while there are intermediate times (e.g. t = 1) at which the periodicity of the initial condition may still exist if its amplitude was large enough (figure 6b).
Figure 6.
(a) Simulation of the KPZ equation with sinusoidal initial data corresponding to the RD transient (t = 0.01, t = 0.1), EW transient (t = 1) and the full KPZ stage (t = 100, 1000). Parameter values: λ = 3, γ = 1, D = 1. (b) Simulation for a different initial sinusoidal data, whose amplitude has been taken of the same order as that of the profile for the full KPZ regime. Parameter values are as in (a): black, t = 0; red, t = 0.01; green, t = 0.1; blue, t = 1; brown, t = 100; purple, t = 1000.
We now consider the case of the deterministic equation obtained when the term η(x,t) in equation (1.1) is dropped and the constant forcing term is rescaled upon the transformation h → (h − Ft).
| 3.13 |
We show in figure 7, how an initially sinusoidal profile evolves as time passes, and consider also the situation where the initial value itself is of a stochastic nature. Notice that in both cases considered in figure 7, the corresponding solution approaches towards a nearly constant profile as time passes.
Figure 7.
(a) Solution profiles for the deterministic KPZ equation when λ = 10, ν = 1. (b) Profiles corresponding to the same equation and same values of λ and ν in the case where h(x,0) is an uncorrelated white noise of amplitude D = 0.01 (black, t = 0; pink, t = 11.7).
To conclude this paragraph, we next consider a particular case of the deterministic KPZ equation (3.12), which has been used [33,34] to support the biotic origin of a class of stromatolites. More precisely, we shall deal with the following equation
| 3.14 |
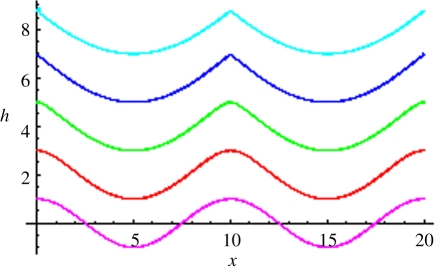
where F > 0 is constant, and h(x,0) is a prescribed sinusoid. Figure 8 provides information on the behaviour in time of the corresponding solutions.
Figure 8.
Evolution of a sinusoidal profile under equation (20). Notice the existence of an initial transient period, where the solution remains as smooth as its initial value (snapshots 1 and 2) after which cusps begin to unfold at the local maxima of the solution (snapshots 3 and 4). The profile will eventually converge to zero everywhere for a sufficiently long time. The initial profile is h(x,0) = cos(πx/5), F = 2 and ν = 1/2. Snapshots correspond to times t = 0, 1, 2, 3, 4.
It is interesting to compare figure 8 with figure 1 in the study of Batchelor et al. [33]. In both cases, one makes use of explicit formulae to represent the solutions. However, the authors in [33] are able to derive their plots through formulae (2.1) and (2.2) therein because they consider initial values with a single maximum. In our case, the initial value has several maxima, so that characteristics originating from them may intersect in time, which eventually results in loss of regularity and cusp formation. Therefore, the coexistence of several adjacent paraboloid-like structures as those represented in figure 2 in the study of Batchelor et al. [34] can be maintained only for sufficiently small times (see electronic supplementary material, appendix B for further details).
3.3. Is Kardar–Parisi–Zhang a suitable model of stromatolite growth?
Consider again the AH specimen in figure 3. One readily sees there a system of three undulations that run from bottom to top, the one on the left eventually undergoing a tip-splitting process. It is not a priori clear whether a precise wavelength can be associated with such undulations, as their number is too small to perform a reliable statistical analysis. This could be done, however, if larger samples displaying about 10–20 of such shapes were available. In any case, if such a wavelength could be identified, this would exclude that band formation had occurred at times corresponding to the last asymptotic regime for the KPZ equation. The reason is that the large-time behaviour of solutions to equation (1.1) is known to be incompatible with the persistence of a characteristic length [37], as illustrated in figure 6a. However, characteristic lengths can be preserved for comparatively long times, as seen in figure 6b. For instance, they are compatible with the first time regime (t < ts in equation (3.12)), which in practice may last for a long while. Note for instance that, as observed before, ts > t2C, and the latter quantity might be of the order of 10 Myr under assumptions on λ and D as those discussed in our previous paragraph.
Another point to be noticed is that neither overhangs (as that visible on the right of the first undulation at the bottom left in figure 3) nor increasingly steep interface profiles (the rightmost system in the same figure) are compatible with the asymptotic KPZ regime [37].
A final remark in this paragraph is concerned with the effect of noise on the KPZ equation. This is known to be crucial for non-zero patterns to evolve from an initially flat interface h(x,0) = 0. Indeed, if we drop the noise term h(x,t) in equation (1.1), then the only solution in the whole space of the resulting equation corresponding to an initial value h(x,0) = 0 is h(x,t) = 0. Moreover, in that case, solutions corresponding to data which are not too large (see electronic supplementary material, appendix B for details) are known to approach flat profiles as time goes to infinity. Therefore, the patterns depicted earlier [33,34] either develop from sufficiently large initial values, or will eventually be damped out as time passes.
3.4. More on kinetic roughening: beyond the Kardar–Parisi–Zhang equation
We have already illustrated some of the problems that arise when using equation (1.1) to model stromatolite morphologies. We should add in this respect that, to this day, there are very few experiments on rough interfaces where the scaling behaviour corresponding to the KPZ equation had been unambiguously observed [44]. While the reasons for that discrepancy remain still open for discussion, partial explanations thereof can be provided. Some of them are related to the manner in which equation (1.1) is obtained. For instance, the general arguments on symmetry assumptions to be recalled in electronic supplementary material, appendix A are fully meaningful at the largest time and space scales only. For smaller scales, however, mechanisms that are not compatible with the KPZ formalism (arising for instance from specific microscopic details) may play a significant role. This may result in the onset of a KPZ scaling being delayed, and even completely hindered for practical purposes. To illustrate this point, a specific example is shortly discussed below.
Consider a growth problem in which particles diffuse within a vapour phase until they reach a solid substrate onto which they attach through chemical reactions, forming an aggregate with a rough surface. If the chemical reactions resulting in that attachment are not too fast, it has been shown that the aggregate interface evolves according to the noisy Kuramoto–Shivashinsky equation [45]
| 3.15 |
Here ν, K and λ are positive constants and η is as in equation (1.1).
As in the KPZ case, equation (3.15) is symmetric under reflection of the space coordinates, x → −x, while not having up-down symmetry (h → −h) either. Based on standard arguments on universality [37], this might lead to expect a similar dynamical behaviour as described by both equations. However, the sign of the diffusion term in equation (3.15) is the opposite to that in the KPZ equation (1.1). This introduces important differences in the behaviour of solutions to both equations, particularly at small time scales. For instance, solutions to equation (3.15) may develop a periodic pattern of cells for times t > 0. This morphological instability is certainly compatible with the presence of undulatory patterns as those already discussed for the (AH) specimen. In the case of equation (3.15), such a periodic pattern subsequently evolves in a chaotic manner to eventually yield, for a suitable parameter range, a full KPZ scaling for sufficiently large times [45,46]. Thus, KPZ scaling can be viewed as an emergent property of equation (3.15), although that equation itself is strongly different from equation (1.1). Moreover, for some (finite) system sizes, and some parameter choices in equation (3.15), the asymptotic KPZ scaling may not be observable at all in equation (3.15) [44]. Incidentally, this seems to be the case in many experimental systems where diffusive instabilities seem to be a norm rather than an exception [44].
As a matter of fact, morphological instabilities may be driven by mechanisms of nature other than diffusive, and noise is not required to sustain them. A simple example is provided by the nonlinear equation
 |
3.16 |
which has been recently studied in the context of non-equilibrium growth [47,48]. Within the theory of surface growth, the second, linear term on the r.h.s. of equation (3.16) is usually associated with surface diffusion: it models how newly deposited particles diffuse along the growing surface. The nonlinear term in equation (3.16) is, as we explain in the following, tightly related to the surface Gaussian curvature (which is an intrinsic measure of the curvature of the surface). Furthermore, it is one of the simplest nonlinearities compatible with the symmetry requirements detailed in electronic supplementary material, appendix A1.
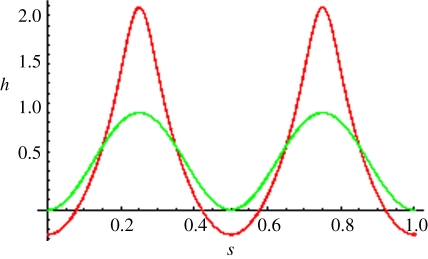
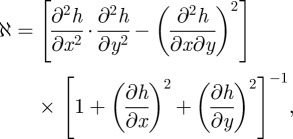
Figure 9 presents a one-dimensional cut along the x = y-axis of a two-dimensional numerical simulation of equation (3.16). What this figure shows is mass displacement from saddle points to the top of the hills by means of a nonlinear instability mechanism. A complementary effect, displacement of mass from saddle points to the bottom of the valleys, can be observed along the perpendicular axis. This sort of behaviour requires the action of a nonlinearity. Indeed, a linear instability would promote the growth of both holes and mounds. That phenomenology can be explained by means of a simple geometric argument as follows. The surface Gaussian curvature ℵ is given by
 |
3.17 |
and in the small gradient limit (|∇ h| ≪1), ℵ reduces to
 |
3.18 |
which is precisely the drift in equation (3.16). Thus, the dynamics of equation (3.16) favours the growth of patterns with positive Gaussian curvature (as is the case of holes and mounds) with respect to those with negative Gaussian curvature (as saddles).
Figure 9.
One-dimensional cut of the two-dimensional numerical solution of equation (3.16) shown along the x = y-axis at time t = 3.05 × 10⁻⁴ (red line). The variable  parametrizes this axis. The values of the parameters are λ = 1 and ν = 0.1. We have assumed periodic boundary conditions and the symmetric initial condition h0 = sin(2πx)sin(2πy) (green line). One can clearly see how the mass is displaced from the saddle points to the top of the hills as a consequence of the nonlinear instability mechanism.
4. Discussion
In this work, we have addressed some aspects of pattern formation in stromatolites. In particular, we have been concerned with the question of whether the interfaces appearing on such structures can be modelled by means of the KPZ equation (1.1). This issue has been raised as a tool to prove (or disprove) the biogenicity of such structures, and consequently on the way in which life was started in our planet.
We have focused into a particular aspect of the modelling question described before. More precisely, an effort has been made to clarify the following points: (i) what does any term in the KPZ equation represents in terms of physical mechanisms involved? (ii) What conclusions can be drawn from comparison of the properties of solutions to the KPZ equation with the profiles (particularly band interfaces) observed in actual stromatolite samples, and in particular in the AH specimen depicted in figure 3. A pressing motivation to ascertain (i) and (ii) is given by the fact that [32,33] different versions of the KPZ equation have been used to sustain seemingly contradicting views, namely a possibly abiotic (in the first case) and biotic (in the second one) origin of stromatolites. We now summarize our results, and put forward some research directions that can be pursued to understand pattern formation in such structures.
To begin with, we have observed that KPZ is a stochastic partial differential equation. This simple model has been largely used to describe the evolution of an interface separating a medium which advances into another. Three important aspects to retain such formulation are that (i) KPZ is a continuous equation, therefore obtained by means of an approximation process to a discrete phenomenon, (ii) noise effects are crucial, and (iii) at any given time, the interface is not considered to be in equilibrium: by assumption, there is an external force that drives the growth problem.
Interestingly enough, and in spite of the generality of the arguments leading to KPZ derivation (some of which are recalled in electronic supplementary material, appendix A), a first obstacle to be reckoned with is its scarce experimental relevance. Indeed, very few processes have been clearly shown to be governed by the KPZ equation. This admittedly inconvenient aspect has been linked to the very generality of the modelling assumptions leading to equation (1.1). For instance, it has been suggested [44] that in any particular case considered, the microscopic aspects of the underlying dynamics could have a strong impact on the dynamics of that process, and that those might have been ignored (at least in part) when deriving the continuous equation (1.1). We should bear in mind that any modelling equation as that of equation (1.1) is arrived at under a number of simplifying assumptions, some of which may be quite heavy (or utterly unacceptable) for our current problem.
While the previous remark has been specifically tailored to the KPZ equation, the following one is of a general nature. When using any particular equation for modelling purposes, one has to pay particular attention to the physical meaning of the various terms and coefficients retained. These encode information about the mechanisms that are assumed to be mainly, if not solely, responsible for the process we intend to model. However, rarely (if ever) do such terms and coefficients provide information about the biotic or abiotic origin of the forces that set such terms in action.
Consider for instance, the first term on the r.h.s. in equation (1.1). As remarked in §2, it can be interpreted as a diffusion term, and the corresponding coefficient has dimensions of a diffusion coefficient. One of the many possible ways in that such a term can be obtained is represented by formula (2.4), which provides a link between diffusivity and two material properties of the moving interface (interfacial tension and effective mobility). However, there is no way to clarify at that stage whether such physical mechanisms are the result of a biotic or abiotic process. What is more, no clear link between the underlying microscopic mechanisms and the averaged, effective coefficients appearing in equation (2.4) has yet been established. Clearly, equation (2.4) provides some insight into the nature of the laws at work at the interface. The knowledge thus obtained is, however, too scarce to draw any conclusion, not only on the biogenicity question, but also on the nature of the chemistry leading to interface formation. For this reason, we are left in almost complete ignorance of the physical forces that shaped the interface and determined its motion. To gain insight about such issues, additional information is needed. For instance, a direction that we consider as promising is that of deriving the effective coefficients appearing in equation (2.4) from the actual grain properties (volume fraction, composition, mechanisms of formation, and so on) of the structures that are present in an actual interface (that is, in the boundary of a band) of a living young stromatolite sample. This requires going beyond the representation of the interface as a comparatively thin line, to take instead into account its internal structure. Any significant result in that direction will be instrumental to improve our understanding on the way these bands were formed.
Concerning the remaining terms in equation (1.1), the second one in its r.h.s. has a particularly precise meaning. It postulates that interface velocity is nearly constant, a fact that might be perhaps compared with geological estimates (assumed available) on band formation. Finally, the presence of noise is crucial to produce non-trivial patterns out of nearly flat initial profiles. This makes a strong case for stochastic equations versus deterministic ones as models to describe stratified structures arising out of gentle sand ripples. The latter is widely assumed to be a starting point for currently forming stromatolites in shallow water environments.
A point to be stressed is that the KPZ equation can be shown to be incompatible with some particular interface morphologies. We have remarked on this issue in §3. In particular, we have noticed that overhangs and steep profiles are incompatible with solutions to KPZ. This is not a reason to exclude altogether KPZ from that scenario, but certainly hints at least at the presence of additional mechanisms at work. We have also noticed that, in our view, wave-like structures as that apparent in the AH specimen deserve further study. Indeed, if such undulations were common (a fact that the size of AH sample does not allow to conclude) the corresponding wavelength could possibly be identified. In that case, KPZ should be discarded as a guide to describe band formation in comparatively long times. Other equations, which take into account different driving mechanisms should then be considered, a fact that has been briefly discussed in §3.4.
A highly relevant question is often ignored at the modelling stage: it is widely assumed that, out of a manifold variety of patterns that a given equation can sustain, only a few of them will be preserved in the long run. In some cases, such robust, observable patterns unfold very quickly. However, for a given equation, different time regimes may occur, separated by suitable crossover times, and the behaviour of solutions might differ sharply from one region to another. We have addressed that issue in §3.1 where we have recalled that any of such time regions may be quite long, and that a given pattern might have been formed, and then stabilized by some additional mechanisms changing the sedimentary and/or precipitation conditions, such as stronger sedimentation owing to local storms or transgressive conditions, changes of pH owing to hydrothermal activity, or fast evaporation inducing evaporitic precipitation. In this way, the observed pattern may look incompatible with the behaviour which eventually sets in for very long times. The conclusion that emerges is that a given process (for instance, band formation in stromatolites) might have occurred according to a, say, KPZ mechanism, and still display morphologies that are incompatible with the behaviour of KPZ solutions in the long run (as time goes to infinity). This in turn raises another research direction: identifying the crossover times of a given equation in terms of measurable quantities. In our case, a possible strategy could be to relate such crossover times to the grain properties mentioned before. Incidentally, a remark made earlier [32] (see fourth line after formula (2.2) therein) may be related to the consideration of any of such crossover times, although the precise form of their assumption may not agree with estimates (3.7), (3.9) and (3.11) in §3.
Summing up, we believe that linking interface evolution with internal interface structure, searching for wave-like regularities in larger samples than those examined so far, and estimating the actual size of crossover times (as well as relating such times with material properties of stromatolites) are particular issues whose study might be helpful to obtain suitable interface lamina formation models for stromatolite samples. Gaining insight into such issues, as well as on the general question of lithification and on how accretion proceeds [17], will improve our current knowledge of pattern formation in such geological structures.
Acknowledgements
We thank Martin van Kranendok and Malcolm Walter for their critical reading of the manuscript. We would also like to acknowledge the two anonymous referees for their detailed and insightful remarks on our original manuscript. This work has been supported in part by MICINN grant nos FIS2009-12964-C05-01 (R.C.), CGL2010-12099-E (J.M.G.R.) and MTM2008-01867 (M.A.H.).
References
- 1.Schopf J. W. 1993. Microfossils of the Early Archean Apex Chert: new evidence of the antiquity of life. Science 260, 640–646 10.1126/science.260.5108.640 (doi:10.1126/science.260.5108.640) [DOI] [PubMed] [Google Scholar]
- 2.Schopf J. W., Kudryavtsev A. B., Agresti D. G., Wdowiak T. U., Czaja A. D. 2002. Laser-Raman imagery of Earth's earliest fossils. Nature 416, 73–76 10.1038/416073a (doi:10.1038/416073a) [DOI] [PubMed] [Google Scholar]
- 3.Schidlowski M. 1988. A 3800-million-year isotopic record of life from carbon in sedimentary rocks. Nature 333, 313–335 10.1038/333313a0 (doi:10.1038/333313a0) [DOI] [Google Scholar]
- 4.Mojzsis S. J., Arrhenius G., Keegan K. D., Harrison T. H., Nutman A. P., Friend C. L. R. 1996. Evidence for life on Earth 3800 million years ago. Nature 384, 55–58 10.1038/384055a0 (doi:10.1038/384055a0) [DOI] [PubMed] [Google Scholar]
- 5.Summons R. E., Jahnke L. L., Hope J. M., Logan G. A. 1999. 2-Methylhopanoids as biomarkers for cyanobacterial oxygenic photosynthesis. Nature 400, 554–557 10.1038/23005 (doi:10.1038/23005) [DOI] [PubMed] [Google Scholar]
- 6.Brocks J. J., Buick R., Summons R. E., Logan G. A. 2003. A reconstruction of Archean biological diversity based on molecular fossils from the 2.78 to 2.45 billion-year old Mount Bruce Supergroup, Hamersley Basin, Western Australia. Geochim. Cosmochim. Acta 67, 4321–4335 10.1016/S0016-7037(03)00209-6 (doi:10.1016/S0016-7037(03)00209-6) [DOI] [Google Scholar]
- 7.Walter M. R. 1983. Archean stromatolites: evidence of the Earth's earliest benthos. In Earth's earliest biosphere: it's origin and evolution (ed. Schopf J. W.), pp. 187–213 Princeton, NJ: Princeton University Press [Google Scholar]
- 8.Awramik S. M. 1992. The history and significance of stromatolites. In Early organic evolution: implications for mineral and energy resources (ed. Schidlowski M.), pp. 435–49 New York, NY: Springer [Google Scholar]
- 9.Allwood A. C., Walter M. R., Kamber B. S., Marshall C. P., Burch I. W. 2006. Stromatolite reef from the Early Archaean era of Australia. Nature 441, 714–718 10.1038/nature04764 (doi:10.1038/nature04764) [DOI] [PubMed] [Google Scholar]
- 10.Riding R. 1999. The term stromatolite: towards an essential definition. Lethaia 32, 321–330 10.1111/j.1502-3931.1999.tb00550.x (doi:10.1111/j.1502-3931.1999.tb00550.x) [DOI] [Google Scholar]
- 11.Westall F. 2005. A sedimentary view. Science 308, 366–367 10.1126/science.1107227 (doi:10.1126/science.1107227) [DOI] [PubMed] [Google Scholar]
- 12.Moorbath S. 2005. Dating earliest life. Nature 324, 155. 10.1038/434155a (doi:10.1038/434155a) [DOI] [PubMed] [Google Scholar]
- 13.García-Ruiz J. M., Hyde S. T., Carnerup A. M., Christy A. G., Van Kranendonk M. J., Welham N. J. 2003. Selfassembled silica-carbonate structures and detection of ancient microfossils. Science 302, 1194–1197 10.1126/science.1090163 (doi:10.1126/science.1090163) [DOI] [PubMed] [Google Scholar]
- 14.Van Zuilen M. A., Lepland A., Arrhenius G. 2002. Reassessing the evidence for the earliest traces of life. Nature 418, 627–630 10.1038/nature00934 (doi:10.1038/nature00934) [DOI] [PubMed] [Google Scholar]
- 15.Dutkiewicz A., Volk H., George S. C., Ridley J., Buick R. 2006. Biomarkers from Huronian oil-bearing fluid inclusions: an uncontaminated record of life before the great oxidation event. Geology 34, 437–440 10.1130/G22360.1 (doi:10.1130/G22360.1) [DOI] [Google Scholar]
- 16.Rasmussen B., Fletcher I. R., Brocks J. J., Kilburn M. R. 2008. Reassessing the first appearance of eukaryotes and cyanobacteria. Nature 455, 1101–1104 10.1038/nature07381 (doi:10.1038/nature07381) [DOI] [PubMed] [Google Scholar]
- 17.Grotzinger J. P., Knoll A. H. 1999. Stromatollites in Precambrian carbonates: evolutionary milesposts or environmental dipsticks? Annu. Rev. Earth Planet. Sci. 27, 313–358 10.1146/annurev.earth.27.1.313 (doi:10.1146/annurev.earth.27.1.313) [DOI] [PubMed] [Google Scholar]
- 18.Awramik S. M. 2006. Respect for stromatolites. Nature 441, 700–701 10.1038/441700a (doi:10.1038/441700a) [DOI] [PubMed] [Google Scholar]
- 19.Walter M. R., Buick R., Dunlop J. S. R. 1980. Stromatolites 3400–3500 Myr old from the North Pole area, Western Australia. Nature 248, 443–445 10.1038/284443a0 (doi:10.1038/284443a0) [DOI] [Google Scholar]
- 20.Lowe D. R. 1994. Abiological origin of described stromatolites older than 3.2 Ga. Geology 22, 387–390 10.1130/0091-7613(1994)022%3C0387:AOODSO%3E2.3.CO;2 (10.1130/0091-7613(1994)022%3C0387:AOODSO%3E2.3.CO;2) [DOI] [PubMed] [Google Scholar]
- 21.Hofmann H. J., Grey K., Hickman A. H., Thorpe R. 1999. Origin of 3.45 Ga coniform stromatolites in the Warrawoona Group, Western Australia. Geol. Soc. Am. Bull. 111, 1256–1262 10.1130/0016-7606(1999)111%3C1256:OOGCSI%3E2.3.CO;2 (doi:10.1130/0016-7606(1999)111%3C1256:OOGCSI%3E2.3.CO;2) [DOI] [Google Scholar]
- 22.Van Kranendonk M. J. 2007. A review of the evidence for putative Paleoarchean life in the Pilbara Craton. In Earth's oldest rocks. Developments in precambrian geology (eds Van Kranendonk M. J., Smithies R. H., Bennet V.), pp. 855–896 Amsterdam, The Netherlands: Elsevier [Google Scholar]
- 23.Walter M. R. (ed.) 1976. Stromatolites. Developments in sedimentology vol. 20, pp. 1–3 Amsterdam, The Netherlands: Elsevier [Google Scholar]
- 24.Riding R., Awramik S. M., Winsborough B. M., Griffin K. M., Dill R. F. 1991. Bahamian giant stromatolites: microbial composition of surface mats. Geol. Mag. 128, 227–234 10.1017/S001675680002207X (doi:10.1017/S001675680002207X) [DOI] [Google Scholar]
- 25.Reid R. P., James N. P., Macintyre I. G., Dupraz C. P., Brune R. V. 2003. Shark Bay stromatolites: microfabrics and reinterpretation of origins. Facies 49, 299–324 [Google Scholar]
- 26.Bosak T., Liang B., Sim M. S., Petroff A. P. 2009. Morphological record of oxygenic photosynthesis in conical stromatolites. Proc. Natl Acad. Sci. USA 106, 10 939–10 943 10.1073/pnas.0900885106 (doi:10.1073/pnas.0900885106) [DOI] [PMC free article] [PubMed] [Google Scholar]
- 27.Petroff A. P., Sima M. S., Maslovb A., Krupeninb M., Rothmana D. H., Bosaka T. 2010. Biophysical basis for the geometry of conical stromatolites. Proc. Natl Acad. Sci. USA 100, 1–6 10.1073/pnas.1001973107 (doi:10.1073/pnas.1001973107) [DOI] [PMC free article] [PubMed] [Google Scholar]
- 28.Logan B. W. 1961. Cryptozoa and associate stromatolites from the recent of Shark Bay, western Australia. J. Geol. 69, 517–533 10.1086/626769 (doi:10.1086/626769) [DOI] [Google Scholar]
- 29.Dravis J. J. 1983. Hardened subtidal stromatolites, Bahamas. Science 219, 385–386 10.1126/science.219.4583.385 (doi:10.1126/science.219.4583.385) [DOI] [PubMed] [Google Scholar]
- 30.Reid R. P., et al. 2000. The role of microbes in accretion, lamination and early lithification of modern marine stromatolites. Nature 406, 989–992 10.1038/35023158 (doi:10.1038/35023158) [DOI] [PubMed] [Google Scholar]
- 31.Foster J. S., Green S. J. 2011. Microbial diversity in modern stromatolites. In Stromatolites: interaction of microbes with sediments (eds Tewari V. C., Seckbach J.), pp. 383–405 New York, NY: Springer [Google Scholar]
- 32.Grotzinger J. P., Rothman D. H. 1996. An abiotic model for stromatolite morphogenesis. Nature 383, 423–425 10.1038/383423a0 (doi:10.1038/383423a0) [DOI] [Google Scholar]
- 33.Batchelor M. T., Burne R. V., Henry B. I., Jackson M. J. 2004. A case for biotic morphogenesis of coniform stromatolites. Phys. A 337, 319–326 10.1016/j.physa.2004.01.065 (doi:10.1016/j.physa.2004.01.065) [DOI] [Google Scholar]
- 34.Batchelor M. T., Burne R. V., Henry B. I., Slayter T. 2005. Statistical physics and stromatolite growth: new perspectives of an ancient dilemma. Phys. A 350, 6–11 10.1016/j.physa.2005.01.014 (doi:10.1016/j.physa.2005.01.014) [DOI] [Google Scholar]
- 35.Kardar M., Parisi G., Zhang Y. C. 1986. Dynamic scaling of growing interfaces. Phys. Rev. Lett. 56, 889–892 10.1103/PhysRevLett.56.889 (doi:10.1103/PhysRevLett.56.889) [DOI] [PubMed] [Google Scholar]
- 36.Krug J. 1995. Origins of scale invariance in growth processes. Adv. Phys. 46, 139–282 10.1080/00018739700101498 (doi:10.1080/00018739700101498) [DOI] [Google Scholar]
- 37.Barabási A.-L., Stanley H. E. 1995. Fractal concepts in surface growth. Cambridge: Cambridge University Press [Google Scholar]
- 38.Holden H., Oksendal B., Uboe J., Zhang T. 2010. Stochastic partial differential equations. New York, NY: Springer [Google Scholar]
- 39.Forrest B., Toral R. 1993. Crossover and finite size effects in the 1+1 dimensional Kardar–Parisi–Zhang equation. J. Stat. Phys. 70, 703–720 10.1007/BF01053591 (doi:10.1007/BF01053591) [DOI] [Google Scholar]
- 40.Giada L., Giacometti A., Rossi M. 2002. Pseudospectral method for the Kardar–Parisi–Zhang equation. Phys. Rev. E 65, 036134. 10.1103/PhysRevE.65.036134 (doi:10.1103/PhysRevE.65.036134) [DOI] [PubMed] [Google Scholar]
- 41.Calabrese P., Le Doussal P. 2011. Exact solution for the Kardar–Parisi–Zhang equation with flat initial conditions. Phys. Rev. Lett. 106, 250603. 10.1103/PhysRevLett.106.250603 (doi:10.1103/PhysRevLett.106.250603) [DOI] [PubMed] [Google Scholar]
- 42.Abdellaoui B., Dall' Aglio A., Peral I. 2006. Some remarks on elliptic problems with critical growth in the gradient. J. Diff. Equ. 222, 21–62 10.1016/j.jde.2005.02.009 (doi:10.1016/j.jde.2005.02.009) [DOI] [Google Scholar]
- 43.Abdellaoui B., Dall' Aglio A., Peral I. 2008. Regularity and nonuniqueness results for parabolic problems arising in some physical models, having natural growth in the gradient. J. Math. Pures Appl. 90, 242–269 10.1016/j.matpur.2008.04.004 (doi:10.1016/j.matpur.2008.04.004) [DOI] [Google Scholar]
- 44.Cuerno R., Vázquez L. 2004. Universality issues in surface kinetic roughening of thin solid films. In Advances in statistical and condensed matter physics (eds Korutcheva E., Cuerno R.), pp. 237–259 New York, NY: Nova Science Publishers [Google Scholar]
- 45.Karma A., Misbah C. 1993. Competition between noise and determinism in step flow growth. Phys. Rev. Lett. 71, 3810–3813 10.1103/PhysRevLett.71.3810 (doi:10.1103/PhysRevLett.71.3810) [DOI] [PubMed] [Google Scholar]
- 46.Ueno K., Sakagushi H., Okamwa M. 2005. Renormalization group and numerical analysis of noisy Kuramoto–Sivashinsky equation in 1+1 dimensions. Phys. Rev. E 71, 046138. 10.1103/PhysRevE.71.046138 (doi:10.1103/PhysRevE.71.046138) [DOI] [PubMed] [Google Scholar]
- 47.Escudero C. 2008. Geometric principles of surface growth. Phys. Rev. Lett. 101, 196102. 10.1103/PhysRevLett.101.196102 (doi:10.1103/PhysRevLett.101.196102) [DOI] [PubMed] [Google Scholar]
- 48.Escudero C., Korutcheva E. 2010. Origins of scaling relations in nonequilibrium growth. (See http://arxiv.org/abs/1004.2725). [Google Scholar]


