

Abstract
Facemasks are widely used as a protective measure by general public to prevent inhalation of airborne pathogens including seasonal, swine and other forms of influenza and severe acute respiratory syndrome (SARS), etc. However, scientific data on effectiveness of facemasks in reducing infections in the community are extremely limited and even inconsistent. In this work, two manikins labelled as ‘source’ and ‘susceptible’ were used to measure the protection provided by facemasks under various emission scenarios. The source was modified to generate polydisperse ultrafine particles, whereas the susceptible was modified to mimic a realistic breathing pattern. The facemask was challenged by both pseudo-steady and highly transient emissions generated by an expiratory process where parameters, such as separation distance between manikins, emission velocity and expiratory duration, were controlled and measured systematically. Performances of four different types of facemask fits, varying from ideal to normal wearing practice, were also investigated. Under the pseudo-steady concentration environment, facemask protection was found to be 45 per cent, while under expiratory emissions, protection varied from 33 to 100 per cent. It was also observed that the separation between the source and the manikin was the most influential parameter affecting facemask protection.
Keywords: airborne infection, expiratory emission, exposure reduction, facemask protection, ultrafine particles
1. Introduction
Wells [1] was the first to hypothesize droplet nuclei transmission of airborne infections in the 1930s. Since then many pathogens have been identified as liable to be transmitted through the airborne route [2,3]. When a contagious individual coughs or sneezes, numerous droplets containing infectious particles (bacteria and viruses) are released [4,5]. Despite severe public health and financial implications, the issue was not addressed seriously until the outbreak of severe acute respiratory syndrome (SARS) in 2003 and the recent outbreak of human swine influenza (H1N1) in May 2009.
Since after the outbreaks, diverse research have been undertaken to find ways of controlling and reducing infections caused by airborne pathogens and those caused by human-to-human contact. There are different groups of approaches to control airborne-transmitted diseases. Ventilation and air flow patterns were widely investigated to study the influence on droplet transmission [6,7]. Ventilation air dilutes bio-contaminants, which reduces the concentration level, and hence occupants have less risk of infection. Active devices such as air cleaners may also be an effective control measure to reduce exposure when they are properly located relative to the infected person [8]. The thermal pressure effect developed from the differential temperature between two zones to induce airborne transmission was studied [9]. An air curtain was used to reduce the air exchange owing to the differential temperature between two zones by reducing the area of the openings [9,10]. Instead of controlling airborne transmission in a space, respiratory protective equipment (RPE) provides personal protection against infection [11,12]. There are many different types of RPE, varying from simple facemasks, N95 respirators to self-contained breathing apparatus. Many previous studies have focused on testing respirators [13,14]. However, facemasks are not only easy to use and more comfortable to wear compared with respirators, but they also cost much less.
The original use of facemasks was to help protect surgical wounds from staff-generated nasal and oral bacteria [15,16]. Today facemasks find much broader usage in metropolitan cities where close contact of people are frequent and inevitable, particularly inside public transport facilities, shopping malls and workplaces.
However, despite much research effort, the effectiveness of facemasks for preventing the contraction of influenza is still under debate and the results presented are not viewed as conclusive [12,17,18]. For instance, the Centre for Disease Control and Prevention commented that there were only limited data available on the effectiveness of facemasks in preventing transmission of H1N1 (or seasonal influenza), while the UK's National Health Service (NHS) did not recommend the use of facemasks for healthy people in the community as there was ‘no conclusive evidence that facemasks protect healthy people in their day-to-day lives’ [19]. Nevertheless, some recent research results have observed that facemasks significantly reduce the risk of contracting influenza-like illnesses in households [12,20]. In many Asia countries, facemasks are routinely used by the general public to reduce exposure to airborne pathogens.
Facemask protection can be classified broadly into two pathogen challenges, steady and episodic, which are related to characteristics of emissions. If a number of infected persons cough in a ventilated indoor environment, i.e. waiting rooms of hospitals or private clinics, a number of episodic expiratory emissions occurring at different times can generate pseudo-steady pathogen concentrations. In this case, even if a susceptible victim is not physically close to infected persons, he would still be exposed to pseudo-steady concentrations and the facemasks he wears would be challenged by the pathogens. Many existing testing protocols evaluate the filtration performance of facemasks under steady flow conditions [21,22]. Comparing the results reported in the literature, it was found that the penetration factor for facemasks follows a similar trend; for ultrafine particles (UFPs), the penetration can be as low as 10–30%. This increases with particle diameter, and reaches 80–100% from 0.2 to 0.5 µm. Beyond this size range, the penetration decreases 10–60% for particle sizes up to 3 µm [13,23–26].
Nevertheless, when an infected person sneezes or coughs in close vicinity to others, their facemasks are challenged by a transient concentration profile. Characteristics of expiratory episodic emissions include the generation emission of droplets at high velocities and short-duration emission. To our best knowledge, the performance of facemasks under these conditions have not been measured and quantified in peer-reviewed literature. Another issue that has not been studied is how periodic breathing affects the ultimate exposure. Recently, the present authors have observed that breathing has a significant influence on exposure [27]. While wearing a facemask, breathing creates alternate positive and negative pressures inside the facemask. During inhaling, more particles may infiltrate through leaks around facemasks. Thus, the steady-state efficiency claimed by the manufacturer may not represent the real efficiency under heavy breathing conditions. Apparently, no methodology or protocol has been developed so far for testing facemasks under expiratory processes, by mimicking patients' (active carriers) coughs or sneezes [28].
It is believed that emission velocity, emission duration, leaks around the facemasks, distance between the infected person and the susceptible victim, and pulmonary ventilation of the susceptible are the major factors affecting the ultimate protection and exposure. Except for the leaks around the facemask [25], none of these have been studied to any extent.
Owing to varying public perceptions of the impact of wearing of facemasks on public health, there is an urgent need for a comprehensive experimental study to measure the protection provided by facemasks against aerosols under realistic expiratory processes and pseudo-steady conditions. Experiments were conducted for a wide range of conceivable practical parameters such as expiratory velocity, emission duration, leaks around the facemask and separation distance between the infected person and the susceptible victim. The aim of this work is to investigate the performance of facemasks in providing protection under various environmental conditions and human factors.
2. Parameters selection
Six important parameters were considered in this work: nature of the source, wearing conditions, emission velocity V, duration of the expiratory process t, separation distance between two manikins D and leaks around facemasks.
Both transient and steady aerosol concentrations were used to test how the protection provided by facemasks varies with the nature of the source. An expiratory process was used to mimic a transient source, while a pseudo-steady source was achieved by injecting aerosols from an external source into the chamber.
According to some results reported recently in the literature [29,30], the velocity of a cough can vary from 5 to 30 m s−1. It is recognized that velocities above 30 m s−1, though not very common, are worth considering in order to cover the extreme cases. Two momentary emission velocities, 15 and 30 m s−1, were tested in this work. They were measured at a fixed location 5 cm away from the source manikin.
The duration of a single expiratory cycle varies with individuals, usually between 0.5 and 2 s. In the literature, the duration of the whole expiratory process was taken to be 0.9 s [31–33]. Therefore, the expiratory durations of 0.5 and 1 s were selected as being appropriate, while a duration of 2 s was considered as an extreme case. Although such a long duration as 2 s may only occur rarely in real life, the result of such a duration would demonstrate the worst condition under which the facemask could be challenged. A duration shorter than 0.5 s was not considered because there would be too few emitted droplets to enable accurate measurement. Besides, the dynamic behaviour of electrical modulations of the valve limits the accuracy of shorter duration as the valve takes a certain amount of time to operate mechanically.
The distance between the source and the susceptible was varied from 30 to 60 cm. This represents a common social behaviour. People have been reported to have four proxemics zones, where the intimate and personal distances were within 18 inch (45.7 cm) and 18 inch to 4 feet (45.7–121.92 cm), respectively [34]. The testing separations represent a normal distance between two people conversing, while one of them (the source) coughs or sneezes during the conversation.
Four facemask wearing conditions were mimicked to represent different ways people might wear facemasks. The first was a fully sealed facemask, regarded as the ideal case, where all sides were sealed onto the manikin's face by double-sided tape, i.e. penetration was possible only through the facemask. The second was a three-side-sealed facemask, where three sides were sealed and the upward side was shaped in a normal way to mimic natural wearing. Since only one side of the facemask was not sealed, the penetration pathway for unintentional leakage could be studied. The third wearing condition was also a three-side-sealed facemask, but with a 4 mm artificial leakage on both sides of nose, such a small area was provided in order to study the penetration pathway for intentional leakages. The last one was the closest to the normal wearing pattern as no artificial seal or leakage was applied. In order to mimic the normal wearing as close to practice as possible, the facemask was worn by pinching the stiff metal edge to mould to the bridge of the nose and by fully covering the chin.
In the breathing system applied in this study, the maximum breathing flow rate was set to 15 l per minute (LPM). Each cycle lasted 4 s, i.e. 2 s for inhalation and 2 s for exhalation. Therefore, within 4 s, the flow rate was varied from +15 LPM to −15 LPM, representing inhalation and exhalation, respectively.
All the above parameters were selected for episodic scenarios. To determine influences of breathing on facemask protection challenged by a steady source, an atomizer was used to generate aerosols, which were injected through a supply duct into the chamber. The chamber was ventilated at 15 ± 0.3 air changes per hour (ACH) for all experiments. Under this supply scenario, the facemask was worn the normal way without any sealing.
2.1. Experimental set-up and procedure
Figure 1a shows the experimental set-up, including chamber configuration and the manikins' set-up. Two manikins, named as ‘source’ and ‘susceptible’, were placed close to the middle of the experimental chamber of dimensions 2.30 × 2.25 × 2.30 m3 (W × D × H), where well-mixed ventilation was used.
Figure 1.

Configuration of experimental set-up; (a) plan view showing locations of the manikins and (b) manikins and aerosol sampling set-up. (Online version in colour.)
Figure 1b shows the schematic of the experimental set-up of an electro-mechanical breathing and sampling system for the susceptible and a sneezing system for the source manikin. The breathing and sampling system were divided into four parts, viz. Paths A, B and C were part of the breathing circuit, while Path D was the sampling system. Pulmonary ventilation was set at 15 LPM throughout the experiment. The breathing waveform was controlled by a National Instruments LabVIEW program. Details of the design and fabrication of manikins can be found elsewhere [27]; they are only briefly described here.
The sneezing system of the source manikin consisted of a compressor, an on/off electrical modulating valve, a manual electrical modulating valve and a spray gun (180D, Spray-Work, Tamiya). The on/off electrically modulated valve controlled the sneezing duration, governed by the LabVIEW program at 0.5, 1 and 2 s. A manual electrically modulated valve was used to control the flow rate of sneezing.
Droplet concentration was measured by a condensation particle counter (CPC, 3775, TSI Incorporated; accuracy of ±10%), which collected samples from tee-offs of the breathing system, as shown in figure 1b. The concentration, therefore, was influenced by the breathing system. Since the peak concentration was an important parameter in this work, a high sampling frequency of 10 Hz was used to capture transient concentrations.
Temperature values were monitored and controlled through the LabVIEW program. Throughout the experiments, the two manikins wore light long-sleeve T-shirts. Only one brand of commonly available facemasks, purchased from a local supermarket, was used. It should be noted that the objective of the present work was not to compare the performances of various commercial facemasks.
2.2. Experimental procedure
The skin temperature of both manikins was adjusted to 33.0 ± 0.2°C, regulated by switching on a control. In general, it took 30 to 60 min to achieve the set point. The manikins' facemasks were sealed by applying double-sided adhesive tape carefully around the edges. The physical location of each manikin was arranged according to applicable parameters. Figure 2 shows the arrangement of facemasks worn by the manikins. Artificial leakages were introduced by sticking two 4 mm spacers on the manikin's face under the eye sockets. The spacers ensured that the facemask would not be fully plastered on the face, and therefore some slits were created on the sides of these spacers. Apart from this area, the other sides were fully sealed. Air velocity was measured before and after the experiment without aerosols by a handheld hot-wire anemometer (IAQ-CALC, TSI; accuracy of ±3%) placed 5 cm from the emission point which was treated as a reference. The true velocity at the mouth would be better measured using instruments without probes, such as an laser Doppler velocimetry (LDV) or a particle image velocimetry (PIV), as any probe will undoubtedly disturb the flow. It is ideal to use non-invasive approaches to measure the velocity at the vicinity of the mouth to represent the true emission velocity. Owing to the constraint of the available instrument, only the reference velocity approach was adopted. The anemometer was calibrated by a constant temperature anemometry system (IFA 300, TSI) prior to measurements.
Figure 2.

Photo showing an arrangement of artificial leakage inserted between the facemask and the manikin's face. (Online version in colour.)
Polydisperse sodium chloride (NaCl) particles were generated by the spray gun. Residues of NaCl may clog the nozzle and, therefore, before each experiment, the spray gun nozzle was cleaned with ethanol. The gun's container was filled with NaCl solution. Emission duration was controlled accordingly. The emission quantity varied from trial by trial by around 5–10%. In order to facilitate cross-comparison between different sets of data, concentration measured at the mouth was made dimensionless by normalizing the peak concentration at a point 30 cm away from the source.
Part of the experiment was conducted to mimick a steady ‘external’ source. The output of the atomizer was connected to an air-conditioning supply duct. By placing an ultrafine particle counter (P-Trak, 8525, TSI; assumed accuracy the same as the CPC; ±10%) and the CPC, it was confirmed that the concentration inside the chamber was pseudo-steady for over an hour. NaCl was used as the source media of the pollutant.
The particle size distribution for NaCl solution was measured by the scanning mobility particle sizer (SMPS) (3936, TSI). The peak concentration obtained was for particle sizes of about 35 nm with geometric standard deviation (GSD) of 1.81. Most particles were regarded as UFPs. In the literature, the evaporation time is very short for small droplets. The evaporation times to achieve equilibrium size distribution were 0.8 and 0.33 s for 5 and 3 µm droplets, respectively [35]. Similar results were also found that the smaller the droplets initial size, the faster the evaporation time would be [36]. Hence, it can be predicted that the evaporation time for UFPs can be neglected in this study.
3. Results and discussion
To calculate the magnitude of protection provided by the facemasks, experiments were divided into two categories: no facemask wearing and facemask wearing. Under each category, a wide range of parameters was studied. A series of baseline cases (total of 12 runs) was defined as that of no facemask worn by the susceptible. As expected, the measured concentration represented the maximum dose inhaled by the susceptible under the specified emission duration and emission velocity. In all other cases, where facemasks were worn, some measure of protection was achieved (details are listed in table 1).
Table 1.
Experimental run details. i: (1) no facemask, (2) fully sealed facemask, (3) three-side-sealed facemask with artificial leakage, (4) three-side-sealed facemask and (5) normal wearing.
| facemask scenario | parameters | run no. |
|||||||||||
|---|---|---|---|---|---|---|---|---|---|---|---|---|---|
| 1 | 2 | 3 | 4 | 5 | 6 | 7 | 8 | 9 | 10 | 11 | 12 | ||
| facemask scenario i | separation (cm) | 30 | 30 | 30 | 30 | 30 | 30 | 60 | 60 | 60 | 60 | 60 | 60 |
| velocity (m s−1) | 30 | 30 | 30 | 15 | 15 | 15 | 30 | 30 | 30 | 15 | 15 | 15 | |
| duration (s) | 2 | 1 | 0.5 | 2 | 1 | 0.5 | 2 | 1 | 0.5 | 2 | 1 | 0.5 | |
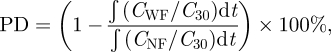
How periodic breathing influences facemask performance had not been previously reported. The conventional parameter of filtration efficiency is not suitable. This conventional parameter includes material efficiency and bacterial filtration efficiency [21,22]. The parameter of breathing has been considered in literature [37], but the evaluation of efficiency only accounts for the particle concentrations inside and outside facemask (conventional evaluation approach), without considering the effect of breathing. We define a new parameter, protection degree (PD), as a measure of the extent to which exposure (to airborne diseases) is reduced by facemasks.
 |
3.1 |
where PD is the protection degree, CWF and CNF represent the temporal concentration measured at the mouth, with facemask and without facemask, respectively, C30 is the concentration measured at 30 cm away from the source's mouth. This concentration is regarded as the reference point for the measurement at the susceptible. Since the emission from the source may not be the same throughout the experiments, use of the reference point would make the results comparable; hence CWF and CNF are normalized by the reference. The integration, being the area under the concentration versus time curve, indicates the exposure level of the receiver. The ratio between the cases with and without facemask indicates the amount of aerosol that could pass through the facemask. The PD, therefore, is calculated by subtracting this ratio from unity.
Based on equation (3.1), to evaluate the PD, the background concentration was assumed steady and the concentration was assumed to return to the initial background level after the expiratory emission. Sometimes the concentration was observed to be higher than the initial background level even after a sufficiently long time. Nevertheless, this effect was slight and not significant when compared with the concentration developed under expiratory emission. In addition, all set-ups in the experiment, including tubing, were the same. Hence, the sampling losses in the measurements were assumed to be the same. Since we adopted the ratio-approach calculation, the sampling loss should not significantly affect the result.
The integral limit depended on the duration of the concentration profile developed by the emitted aerosol. Based on previous experiments [27], the transition concentration level returned back to the initial background concentration within 20 s after the expiratory emission process; therefore, the upper limited of the time integral was set as 20 s. In the case of a constant source, this time limit was taken to be 3 min approximately, depending on the duration of the experiment.
Most of the experiments were conducted under (transient) expiratory emission with periodic breathing. These two were non-steady processes and could determine the concentration of particles entering the mouth. Two extreme cases corresponded to the aerosol cloud reaching the mouth, when the susceptible started either inhaling or exhaling. In the former, aerosols could enter the body, while in the latter, aerosol could not cross the physical boundary. Since the commencement of emission and the breathing process were not synchronized, the concentration reaching the mouth was stochastic [27]. Hence, each experimental run was repeated 20–30 times, the concentration was divided into different bins, and the frequency was counted for each bin. The data from the highest frequency bin (i.e. the mode) were used for calculation. This allowed a more practical way of evaluating the PD. In addition, there were some outlying concentration frequency data observed in different scenarios, and some may not be normal-distributed. Sometimes, even occasional or rare experimental data were found. The mode was, therefore, used as it was insensitive to these results when compared with the mean. Figure 3 shows a typical histogram of the frequency distribution.
Figure 3.

A typical frequency distribution of number concentration measured at the susceptible's mouth without a facemask. The separation between manikins is 30 cm, emission duration is 0.5 s with emission velocity 30 m s−1 emission.
3.1. Steady-state results
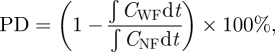
Figure 4 shows the comparison between the conditions with and without facemask. Under steady-state conditions, the PD defined in equation (3.1) above for evaluation of exposure reduction by facemasks becomes:
 |
3.2 |
where CWF, CNF are the concentrations with and without facemasks, respectively.
Figure 4.

Concentration profiles measured at susceptible's mouth under steady-state conditions with pulmonary ventilation of 15 LPM under MV scheme; (a) no facemask (red dashed line) and (b) with facemask (blue solid line). (Online version in colour.)
Using equation (3.2), the PD was found to be 45 ± 0.9%. This result shows that wearing a facemask under steady-state conditions can reduce inhalation of UFPs by about 45 per cent. In addition, it can be observed that the maximum concentration in the experiment set without a facemask was obviously higher than in the set with a facemask, where the mean number concentrations were 28 246 and 14 689 per cubic centimetre corresponding to without and with the facemask, respectively. By viewing the means of two oscillations, a certain degree of protection as a result of the facemask is observed. This result agrees with the result found from equation (3.2).
3.2. Expiratory emission results
Figure 5 shows a typical example of the situation of a 30 cm separation distance, velocity of 30 m s−1 and 2 s sneezing. The data were normalized by the peak concentration ratio of the no facemask scenario for comparison. It is obvious that peak concentrations were reduced to different extents under different wearing scenarios, which increased the magnitude of PD. We defined the response time to be the time taken for the peak to develop after an expiratory emission. Response time varied between 2.7 and 3.9 s, with the fastest response for the situation of no mask and the slowest response for the situation of wearing a fully sealed facemask. This can be explained by the fact that the facemask worked as an obstruction for the aerosol to access the susceptible's mouth so that the entire system has a longer characteristic time. Without any artificial leakage, the aerosols had to penetrate the facemask before being sampled. This situation was different from scenarios of wearing facemask, in which aerosols could access the mouth through natural and artificial leakages around the facemask. The more the leakage, the easier it was for the aerosol to access the manikin's mouth and the faster the response.
Figure 5.

Concentration ratio measured at the susceptible's mouth with manikins at 30 cm separation, 2 s emission duration and with 30 m s−1 emission velocity. The black long dashed line represents scenario of no facemask. The response time is 2.7 s. The red solid line represents scenario of fully sealed facemask. The response time is 3.9 s. The green dashed-dotted line represents scenario of three-side-sealed facemask with artificial leakage. The response time is 3.6 s. The blue short dashed line represents scenario of three-side-sealed facemask. The response time is 2.9 s. The pink dashed-dot-dot line represents scenario of normal wearing. The response time is 3.1 s. (Online version in colour.)
As mentioned earlier, the experiment was a stochastic process where large variations of concentration profiles were considered. Therefore, figure 6 shows PDs of different wearing scenarios, which varied over a wide range.
Figure 6.

Variations of protection degree (PD) measured for run no. 1.
The minimum and maximum protection were calculated by the minimum and maximum inhalation, respectively, in each experimental run under the ‘with facemask’ condition. The exposure varied with the breathing cycle, resulting in variations of PD. Figure 6 also shows that the range of PD varies within each of the four types of mask arrangements. The variation becomes significant for wearing scenarios of the three-side-sealed facemask and normal wearing. The maximum-to-minimum ratio increases from 1.1 times (99/89%) for the scenario of fully sealed facemask to 3.8 times (69/18%) for the scenario of normal wearing. This may be attributed to wider leakage paths which provide larger access paths for aerosols and lead to a higher sensitivity to the surrounding environment.
The results under different scenarios and using the mode concentration for calculation are summarized in figure 7, which shows that under the same conditions, the fully sealed facemask offers the highest protection, followed by the three-side-sealed facemask with artificial leakage and the three-side-sealed facemask (without artificial leakage), while the normal wearing facemask gives the least protection. It is obvious that the sealed facemask provides nearly 100 per cent PD under all scenarios. Thus, if there is no artificial leakage around the facemask, excellent protection against UFPs emitted by the expiratory process is possible. The reduction in PD offered under other wearing scenarios was mainly caused by the voids or gaps between the facemask and the face.
Figure 7.

PD measured by using mode concentration for all experimental runs. Purple bars, 2 s; brown bars, 1 s; yellow bars, 0.5 s. (Online version in colour.)
3.2.1. Effect of leakage
When a 4 mm artificial leakage was created in the facemask, the PD was reduced by a small amount, to a minimum of 80 per cent in the extreme case. It is interesting to note that the facemask with artificial leakage had higher PD compared with the three-side-sealed cases. This seems counterintuitive and can perhaps be attributed to leakage pathways. When a 4 mm spacer (artificial leakage) was inserted, some slits were created on both sides of spacer as shown in figure 2. However, the sum of the area of these slits may not equal the area of the 4 mm circular spacer (about 50 mm2). Visual inspection shows that the leakage size may be less than 4 mm. Therefore, 4 mm only indicates the size of spacer, but not the slit size (artificial leakage) of the facemask. Further work should be done to study the effect of artificial leakage size on PD.
Under the normal wearing scenario, PD is reduced to 33.6 per cent when the highest expiratory speed and the shortest separation distance are considered. The natural leaks around the facemask provide a pathway for the aerosols to reach the susceptible's mouth. The large reduction of PD indicates that the leakage cannot be neglected under normal wearing practices.
The wearing arrangement of facemask was shown to have a significant influence on PD. The above discussion was focused on different wearing scenarios. In addition, as can be seen from table 1, three other parameters were also tested. These were emission duration, emission speed and distance between manikins. Figure 7 shows a summary of the PDs under different scenarios. Effects of these parameters are analysed herein below.
3.2.2. Effect of distance
Increasing the distance between the source and the susceptible obviously enhanced PD. This shows that the separation distance between two manikins plays a dominant role in determining PD. In the worst scenario, i.e. the shortest separation distance and the highest emission velocity under normal wearing (30 cm separation and 30 m s−1 emission), PD is enhanced more obviously on increasing the separation distance to 60 cm than on decreasing the emission speed. With the shorter separation, it was easier for the aerosol to reach the susceptible. Even when the emission speed was decreased, a certain amount of aerosol could reach it. However, if the separation distance was increased, the aerosol had to travel a longer distance to reach the susceptible. Because of its cone-shaped emission, the concentration was lower at a particular point after the aerosol had travelled a longer distance. Therefore, the separation distance has a greater effect on PD.
3.2.3. Effect of emission speed
In general, the higher the emission speed, the lower was the PD. This can be interpreted as implying that the greater speed causes a higher differential pressure between the surrounding environment and inside the facemask. The greater transient pressure difference would aid the aerosol to reach inside the facemask from outside. Therefore, with the lower emission speed, the lower pressure difference across the facemask lowers the access to the mouth. Future measurements of the transient pressure could be used to verify the hypothesis.
3.2.4. Effect of emission duration
Results show that the longer the duration of the emission, the lower the PD. With the longer emission duration, the susceptible manikin was exposed to the aerosol cloud for a longer time. Therefore, more aerosol could access the susceptible manikin's mouth (sampling point), which leads to lower PD eventually.
The analysis of variance (ANOVA) was conducted for the measurement results. The ANOVA results showed that the PD of facemasks is influenced more by the facemask scenarios than the various parameters of velocity, distance and duration. For each facemask scenario, the ANOVA was performed to test the influence of the parameters and the facemask scenario. The results are shown in table 2. The results show that distance has the dominant influence on the PD among these three parameters. The p-value of distance is the smallest with the significant confidence (less than 0.05) compared with velocity and duration in three different wearing facemask scenarios (normal wearing, three-side-sealed facemask and three-side-sealed facemask with artificial leakage). This indicates that distance has the most influence on the PD. Nevertheless, this is not the case for the fully sealed facemask scenario, where the p-value of these three parameters are all larger than the significance level of 0.05 (smaller than 95% confidence level), indicating that these factors do not have a significant relation with PD. Therefore, it can be concluded that when the facemask is fully sealed, the parameters, i.e. emission velocity, duration and distance, do not affect the exposure at the mouth. However, when a leakage exists, the exposure at the mouth is directly affected by these tested parameters, with distance having the greatest effect.
Table 2.
p-value for ANOVA under different facemask scenarios.
| fully sealed facemask | three-side-sealed facemask with artificial leakage | three-side-sealed facemask | normal wearing | |
|---|---|---|---|---|
| velocity | 0.110 | 0.0342 | 0.0150 | 0.441 |
| distance | 0.235 | 0.00129 | 0.00155 | 0.0000878 |
| duration | 0.0988 | 0.0208 | 0.0802 | 0.0174 |
Ventilation may also influence PD, especially in the case of wider separation distances between the two manikins and lower speeds of emission. This could be explained by the fact that with a lower speed and a longer distance, the jet flow from the source is diffused when the speed decreases. It becomes easier for the aerosol to be disturbed by ventilation when compared with a higher speed or a shorter separation distance. Therefore, it would be more difficult for aerosols to access the mouth in this situation.
4. Limitations
In this work, comprehensive tests were carried out to investigate the protection provided by facemasks under a wide range of conditions and scenarios. It is very difficult to completely mimic truly normal wearing conditions as human skin's surface is soft, while the manikins used had a hard (solid) surface. The start of droplet emissions was not synchronized with the breathing circuit, and hence the mode concentration model was adopted to calculate the magnitude of protection. Furthermore, leaks could not be guaranteed to be the same for all ‘normal wearing’ scenarios. Besides, water vapour might have formed if the wearing period was long, which might have affected the performance of the facemask [38].
5. Conclusions
In this work, the protection provided by facemasks was studied experimentally by challenging pseudo-steady and transient aerosol sources generated by the expiratory process. Developing a standardized testing protocol was beyond the scope of our analysis. Nevertheless, it is important to study the magnitude of protection facemasks provide under pseudo-steady and transient emissions since they are often used as a preventive measure that guards against airborne pathogen transmission.
As mentioned, ventilation and air flow patterns naturally affect the airborne dispersion process. However, since this paper focuses on the effectiveness of facemasks, the experiments were only conducted under the one ventilation scheme (well-mixed ventilation). With such a high emission velocity in the expiratory process, it is believed that ventilation will not affect the ultimate PD significantly [39].
The pseudo-steady condition was achieved in a well-mixed chamber, while transient scenarios were realized by the expiratory process. One of the key features of the measurements was that practical breathing was mimicked by using a thermal breathing manikin. The level of protection was parametrized by reduction of exposure. It was observed that under pseudo-steady conditions, the PD is 45 per cent for normal wearing scenarios. Under transient scenarios, the PD varied from 33 to 100 per cent with different parameters. It was observed that fully sealed facemasks provide the highest protection, while the least protective was the normal wearing. It was also observed that the reduction of exposure decreases with increasing emission velocity and emission duration, and with decreasing separation distance between source and susceptible manikins. The current results have important implications for public health as wearing facemasks has become a common protection measure, particularly in some Asian countries.
The current study is the first study investigating a wide range of parameters affecting the protection performance of facemasks. The results presented here are very useful for public health professionals, occupational hygienists and industrial hygienists to evaluate personal exposure. Since the PDs for both steady and transient events have been measured, personal exposure can be estimated when the airborne concentration is readily given. These will be very helpful for these professionals to estimate the total (indoor and outdoor) exposure.
The particles used in this study were spherical, but the shapes of viruses and bacteria are cylindrical or of some irregular morphologies. In this case, even with the same equivalent size, the behaviour of particles and viruses may be different. Therefore, different professions can extend the present study to their applicable area, such as for fibrous-shaped pollutants. In addition, the relative humidity (RH) should also be considered for follow-up studies, since wearing facemasks will undoubtedly increase the RH between the face and the facemask. Such further studies would be very important as the humid environment may provide a hotbed for viruses and bacteria.
It is believed that numerical models can improve the design and the performance of the facemasks. For instance, the filtration materials can be replaced according to the environmental conditions. Until now, there have been limited numerical studies on facemasks. Computational researchers can also validate their results with the present experimental results. For instance, they can model a completely sealed wearing scenario and compare their results with the present study. In addition, the current study would be useful for investigations in computational epidemiology, such as simulations of pandemic respiratory disease in populations [40–42]. The experimental data in this study can help to estimate pandemic spreading under different protection scenarios, e.g. how facemasks are worn would affect the reduction of the transmission.
As stated, the present work is only a first step to investigate the performance of facemasks. One of our objectives was to measure the effective ‘leakage’ area for different artificial leakage size. This will become a useful tool to characterize the performance of facemasks in practical applications.
Acknowledgements
The work described in this paper was partially supported by a grant from CityU 7002659.
References
- 1.Wells W. F. 1934. On air-borne infection. Study II. Droplets and droplet nuclei. Am. J. Hyg. 20, 611–618 [Google Scholar]
- 2.Fiegel J., Clarke R., Edwards D. A. 2006. Airborne infectious disease and the suppression of pulmonary bioaerosols. Drug Discov. Today 11, 51–57 10.1016/S1359-6446(05)03687-1 (doi:10.1016/S1359-6446(05)03687-1) [DOI] [PMC free article] [PubMed] [Google Scholar]
- 3.Eames I., Shoaib D., Klettner C. A., Taban V. 2009. Movement of airborne contaminants in a hospital isolation room. J. R. Soc. Interface 6, S757–S766 10.1098/rsif.2009.0319.focus (doi:10.1098/rsif.2009.0319.focus) [DOI] [PMC free article] [PubMed] [Google Scholar]
- 4.Nicas M., Nazaroff W. W., Hubbard A. 2005. Toward understanding the risk of secondary airborne infection: emission of respirable pathogens. J. Occup. Environ. Hyg. 2, 143–154 10.1080/15459620590918466 (doi:10.1080/15459620590918466) [DOI] [PMC free article] [PubMed] [Google Scholar]
- 5.Chao C. Y. H., et al. 2009. Characterization of expiration air jets and droplet size distributions immediately at the mouth opening. J. Aerosol Sci. 40, 122–133 10.1016/j.jaerosci.2008.10.003 (doi:10.1016/j.jaerosci.2008.10.003) [DOI] [PMC free article] [PubMed] [Google Scholar]
- 6.Li Y., et al. 2007. Role of ventilation in airborne transmission of infectious agents in the built environment: a multidisciplinary systematic review. Indoor Air 17, 2–18 10.1111/j.1600-0668.2006.00445.x (doi:10.1111/j.1600-0668.2006.00445.x) [DOI] [PubMed] [Google Scholar]
- 7.Jiang Y., Zhao B., Li X. F., Yang X. D., Zhang Z. Q., Zhang Y. F. 2009. Investigating a safe ventilation rate for the prevention of indoor SARS transmission: an attempt based on a simulation approach. Build. Simul. 2, 281–289 10.1007/s12273-009-9325-7 (doi:10.1007/s12273-009-9325-7) [DOI] [PMC free article] [PubMed] [Google Scholar]
- 8.Chen C., Zhao B., Cui W. L., Dong L., An N., Ouyang X. Y. 2010. The effectiveness of an air cleaner in controlling droplet/aerosol particle dispersion emitted from a patient's mouth in the indoor environment of dental clinics. J. R. Soc. Interface 7, 1105–1118 10.1098/rsif.2009.0516 (doi:10.1098/rsif.2009.0516) [DOI] [PMC free article] [PubMed] [Google Scholar]
- 9.Chen C., Zhao B., Yang X. D., Li Y. G. 2011. Role of two-way airflow owing to temperature difference in severe acute respiratory syndrome transmission: revisiting the largest nosocomial SARS outbreak in Hong Kong. J. R. Soc. Interface 8, 699–710 10.1098/rsif.2010.0486 (doi:10.1098/rsif.2010.0486) [DOI] [PMC free article] [PubMed] [Google Scholar]
- 10.Ching W. H., Leung M. K. H., Leung D. Y. C., Li Y., Yuen P. L. 2008. Reducing risk of airborne transmitted infection in hospitals by use of hospital curtains. Indoor Built. Environ. 17, 252–259 10.1177/1420326X08091957 (doi:10.1177/1420326X08091957) [DOI] [Google Scholar]
- 11.Jefferson T., Del Mar C., Dooley L., Ferroni E., Al-Ansary L. A., Bawazeer G. A., van Driel M. L., Foxlee R., Rivetti A. 2009. Physical interventions to interrupt or reduce the spread of respiratory viruses: systematic review. BMJ 339, b3675. 10.1136/bmj.b3675 (doi:10.1136/bmj.b3675) [DOI] [PMC free article] [PubMed] [Google Scholar]
- 12.van der Sande M., Teunis P., Sabel R. 2008. Professional and home-made face masks reduce exposure to respiratory infections among the general population. PLoS ONE 3, e2618. 10.1371/journal.pone.0002618 (doi:10.1371/journal.pone.0002618) [DOI] [PMC free article] [PubMed] [Google Scholar]
- 13.Bałazy A., Toivola M., Adhikari A., Sivasubramani S. K., Reponen T., Grinshpun S. A. 2006. Do N95 respirators provide 95% protection level against airborne viruses, and how adequate are surgical masks? Am. J. Infect. Control 34, 51–57 10.1016/j.ajic.2005.08.018 (doi:10.1016/j.ajic.2005.08.018) [DOI] [PubMed] [Google Scholar]
- 14.Beest D. E. T., van Boven M., Bos M. E. H., Stegeman A., Koopmans M. P. G. 2010. Effectiveness of personal protective equipment and oseltamivir prophylaxis during avian influenza A (H7N7) epidemic, the Netherlands, 2003. Emerg. Infect. Dis. 16, 1562–1568 10.3201/eid1610.091412 (doi:10.3201/eid1610.091412) [DOI] [PMC free article] [PubMed] [Google Scholar]
- 15.Meleney F. L., Stevens F. A. 1926. Postoperative haemolytic streptococcus wound infections and their relation to haemolytic streptococcus carriers among the operating personnel. Surg. Gynecol. Obstet. 43, 338–342 [Google Scholar]
- 16.Romney M. G. 2001. Surgical face masks in the operating theatre: re-examining the evidence. J. Hosp. Infect. 47, 251–256 10.1053/jhin.2000.0912 (doi:10.1053/jhin.2000.0912) [DOI] [PubMed] [Google Scholar]
- 17.Cowling B. J., et al. 2008. Preliminary findings of a randomized trial of non-pharmaceutical interventions to prevent influenza transmission in households. PLoS ONE 3, e2101. 10.1371/journal.pone.0002101 (doi:10.1371/journal.pone.0002101) [DOI] [PMC free article] [PubMed] [Google Scholar]
- 18.Jacobs J. L., Ohde S., Takahashi O., Tokuda Y., Omata F., Fukui T. 2009. Use of surgical face masks to reduce the incidence of the common cold among health care workers in Japan: a randomized controlled trial. Am. J. Infect. Control 39, 417–419 10.1016/j.ajic.2008.11.002 (doi:10.1016/j.ajic.2008.11.002) [DOI] [PubMed] [Google Scholar]
- 19.NHS 2009. Swine flu: question and answers, national health service Plymouth. UK: National Health Service; See http://www.plymouthpct.nhs.uk/Documents/Swine%20Flu%20QA.pdf [Google Scholar]
- 20.Maclntyre C. R., et al. 2009. Face mask use and control of respiratory virus transmission in households. Emerg. Infect. Dis. 15, 233–241 10.3201/eid1502.081167 (doi:10.3201/eid1502.081167) [DOI] [PMC free article] [PubMed] [Google Scholar]
- 21.ASTM 2003. Standard test method for determining the initial efficiency of materials used in medical face masks to penetration by particulates using Latex Spheres F2299-03. West Conshohocken, PA: American Society for Testing and Materials [Google Scholar]
- 22.ASTM 2007. Standard test method for evaluating the bacterial filtration efficiency (BFE) of medical face mask materials using a biological aerosol of Staphylococcus aureus F2101-07. West Conshohocken, PA: American Society for Testing and Materials [Google Scholar]
- 23.Lee S. A., Grinshpun S. A., Reponen T. 2008. Respiratory performance offered by N95 respirators and surgical masks: human subject evaluation with NaCl aerosol representing bacterial and viral particle size range. Ann. Occup. Hyg. 52, 177–185 10.1093/annhyg/men005 (doi:10.1093/annhyg/men005) [DOI] [PMC free article] [PubMed] [Google Scholar]
- 24.Wake D., Bowry A. C., Crook B., Brown R. C. 1997. Performance of respirator filters and surgical masks against bacterial aerosols. J. Aerosol Sci. 28, 1311–1329 10.1016/S0021-8502(97)00009-8 (doi:10.1016/S0021-8502(97)00009-8) [DOI] [Google Scholar]
- 25.Weber A., Willeke K., Marchioni R., Myojo T., McKay R., Donnelly J., Liebhaber F. 1993. Aerosol penetration and leakage characteristics of masks used in the health care industry. Am. J. Infect. Control 21, 167–173 10.1016/0196-6553(93)90027-2 (doi:10.1016/0196-6553(93)90027-2) [DOI] [PubMed] [Google Scholar]
- 26.Chen C. C., Willeke K. 1992. Aerosol penetration through surgical masks. Am. J. Infect. Control 20, 177–184 10.1016/S0196-6553(05)80143-9 (doi:10.1016/S0196-6553(05)80143-9) [DOI] [PubMed] [Google Scholar]
- 27.Poon C. K. M., Lai A. C. K. 2011. An experimental study quantifying pulmonary ventilation on inhalation of aerosol under steady and episodic emission. J. Hazard. Mater. 192, 1299–1306. (doi:10.1016/j.jhazmat.2011.06.040) [DOI] [PMC free article] [PubMed] [Google Scholar]
- 28.Grinshpun S. A., Haruta H., Eninger R. M., Reponen T., Mckay R. T., Lee S. A. 2009. Performance of an N95 filtering facepiece particulate respirator and a surgical mask during human breathing: two pathways for particle penetration. J. Occup. Environ. Hyg. 6, 593–603 10.1080/15459620903120086 (doi:10.1080/15459620903120086) [DOI] [PMC free article] [PubMed] [Google Scholar]
- 29.Zhu S., Kato S., Yang J. H. 2006. Study on transport characteristics of saliva droplets produced by coughing in a calm indoor environment. Build. Environ. 41, 1691–1702 10.1016/j.buildenv.2005.06.024 (doi:10.1016/j.buildenv.2005.06.024) [DOI] [Google Scholar]
- 30.VanSciver M., Miller S., Hertzberg J. 2011. Particle image velocimetry of human cough. Aerosol Sci. Technol. 45, 415–422 10.1080/02786826.2010.542785 (doi:10.1080/02786826.2010.542785) [DOI] [Google Scholar]
- 31.Gupta J. K., Lin C.-H., Chen Q. 2009. Flow dynamics and characterization of a cough. Indoor Air 19, 517–525 10.1111/j.1600-0668.2009.00619.x (doi:10.1111/j.1600-0668.2009.00619.x) [DOI] [PubMed] [Google Scholar]
- 32.Gupta J. K., Lin C.-H., Chen Q. 2009. Characterizing exhaled airflow from breathing and talking. Indoor Air 20, 31–39 10.1111/j.1600-0668.2009.00623.x (doi:10.1111/j.1600-0668.2009.00623.x) [DOI] [PubMed] [Google Scholar]
- 33.Tang J. W., Liebner T. J., Craven B. A., Settles G. S. 2009. A Schlieren optical study of the human cough with and without wearing masks for aerosol infection control. J. R. Soc. Interface 6, S727–S736 10.1098/rsif.2009.0295.focus (doi:10.1098/rsif.2009.0295.focus) [DOI] [PMC free article] [PubMed] [Google Scholar]
- 34.Griffin E. 2009. A first look at communication theory, 7th edn. New York, NY: McGraw-Hill [Google Scholar]
- 35.Morawska L., Johnson G. R., Ristovski Z. D., Hargreaves M., Mengersen K., Corbett S., Chao C. Y. H., Li Y., Katoshevski D. 2009. Size distribution and sites of origin of droplets expelled from the human respiratory tract during expiratory activities. J. Aerosol Sci. 40, 256–269 10.1016/j.aerosci.2008.11.002 (doi:10.1016/j.aerosci.2008.11.002) [DOI] [PMC free article] [PubMed] [Google Scholar]
- 36.Morawska L. 2006. Droplet fate in indoor environments, or can we prevent the spread of infection? Indoor Air 16, 335–347 10.1111/j.1600-0668.2006.00432.x (doi:10.1111/j.1600-0668.2006.00432.x) [DOI] [PubMed] [Google Scholar]
- 37.Cho K. J., Reponen T., Mckay R., Shukla R., Haruta H., Sekar P., Grinshpun S. A. 2010. Large particle penetration through N95 respirator filters and facepiece leaks with cyclic flow. Ann. Occup. Hyg. 54, 68–77 10.1093/annhyg/mep062 (doi:10.1093/annhyg/mep062) [DOI] [PMC free article] [PubMed] [Google Scholar]
- 38.Li Y., Wong T., Chung J., Guo Y. P., Hu J. Y., Guan Y. T., Yao L., Song Q. W., Newton E. 2006. In vivo protective performance of N95 respirator and surgical facemask. Am. J. Ind. Med. 49, 1056–1065 10.1002/ajim.20395 (doi:10.1002/ajim.20395) [DOI] [PubMed] [Google Scholar]
- 39.Sivaji S., Lai A. C. K. In press Experimental and numerical investigation of inter-personal exposure of sneezing in a full scale chamber. Aerosol Sci. Tech.
- 40.Ferguson N. M., Cummings D. A., Cauchemez S., Fraser C., Riley S., Meeyai A., Iamsirithaworn S., Burke D. S. 2005. Strategies for containing an emerging influenza pandemic in Southeast Asia. Nature 437, 209–214 10.1038/nature04017 (doi:10.1038/nature04017) [DOI] [PubMed] [Google Scholar]
- 41.Hsieh Y. H., King C. C., Chen C. W. S., Ho M. S., Hsu S. B., Wu Y. C. 2007. Impact of quarantine on the 2003 SARS outbreak: a retrospective modeling study. J. Theor. Biol. 244, 729–736 10.1016/j.jtbi.2006.09.015 (doi:10.1016/j.jtbi.2006.09.015) [DOI] [PMC free article] [PubMed] [Google Scholar]
- 42.Tracht S. M., Del Valle S. Y., Hyman J. M. 2010. Mathematical modeling of the effectiveness of facemasks in reducing the spread of novel influenza A (H1N1). PLoS ONE 5, e9018. 10.1371/journal.pone.0009018 (doi:10.1371/journal.pone.0009018) [DOI] [PMC free article] [PubMed] [Google Scholar]