Abstract
Spatial organization and noise play an important role in molecular systems biology. In recent years, a number of software packages have been developed for stochastic spatio-temporal simulation, ranging from detailed molecular-based approaches to less detailed compartment-based simulations. Compartment-based approaches yield quick and accurate mesoscopic results, but lack the level of detail that is characteristic of the computationally intensive molecular-based models. Often microscopic detail is only required in a small region (e.g. close to the cell membrane). Currently, the best way to achieve microscopic detail is to use a resource-intensive simulation over the whole domain. We develop the two-regime method (TRM) in which a molecular-based algorithm is used where desired and a compartment-based approach is used elsewhere. We present easy-to-implement coupling conditions which ensure that the TRM results have the same accuracy as a detailed molecular-based model in the whole simulation domain. Therefore, the TRM combines strengths of previously developed stochastic reaction–diffusion software to efficiently explore the behaviour of biological models. Illustrative examples and the mathematical justification of the TRM are also presented.
Keywords: stochastic modelling, reaction–diffusion processes, multi-scale simulation, hybrid algorithm
1. Introduction
Stochastic spatio-temporal simulations have been successfully used in a number of biological applications, including models of morphogen gradients [1], MAPK pathway [2], signal trasduction in Escherichia coli chemotaxis [3] and oscillation of Min proteins in cell division [4]. However, detailed stochastic spatio-temporal models are often computationally intensive to simulate. This is one of the reasons why whole cell simulation has been recognized as a ‘grand challenge of the 21st century’ [5]. In this paper, we address this problem using a modelling approach that has computational complexity only in regions of interest.
Spatio-temporal biological processes are often modelled using deterministic reaction–diffusion models that are written in the form of partial differential equations (PDEs) for concentrations of biochemical species [6]. However, cellular or subcellular processes usually take place on very small spatial scales. With such small scales, it is not uncommon for populations of biochemical species to be so small that deterministic (PDE-based) approaches are completely inappropriate. Several stochastic reaction–diffusion models have been introduced in the literature. In general, these models can be divided into two distinct classes [7]. The first class of models is compartment-based, which is characterized by a discretization of the spatial domain into compartments [8]. At any particular time, the best approximation to the localization of any individual molecule is the compartment that the molecule is in. Molecules that are in the same compartment and are of the same species are completely indistinguishable. Molecules are free to migrate in the form of discrete jumps from one compartment to another via diffusion. Compartment-based modelling techniques are very popular and are used in a number of available self-contained simulation packages, for example MesoRD [9] and SmartCell [10]. While compartment-based models do not specifically represent the true noisy trajectory of the molecules, it has been shown that these models can provide accurate results by choosing the mesh spacing carefully [11,12]. The second class of models is based on Brownian dynamics (molecular-based) simulation. The characterizing property of this method is that each molecule has an exact location on a continuous domain. Molecule diffusion is simulated by calculation of its noisy trajectory. There are a number of simulation packages that implement molecular-based simulation, for example Smoldyn [13,14], MCell [15,16] and Green's function reaction dynamics (GFRD) [17].
Brownian dynamics simulation is popular because of its better representation of the microscopic physics. However, if precise information about the trajectories of each molecule is not important, then the effort placed on tracking them is a waste of computational resources. As a general rule, if concentrations are really small, tracking every molecule's trajectory is achievable, but becomes less practical as concentrations increase, when compartment-based methods (or even deterministic methods) are preferred. Often it is difficult to choose the most appropriate stochastic model when large spatial concentration variations, specific regions of interest and/or small systems coupled to larger systems are involved. In each of these cases, it would be ideal if a Brownian dynamics model may be used for localized regions of particular interest in which accuracy and microscopic detail is important (such as near the biological cell membrane [18]), and a compartment-based model may be used for other regions in which accuracy may be traded for simulation efficiency.
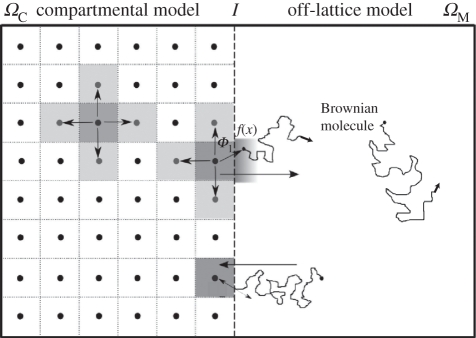
In this paper, we propose a spatially hybrid model, the two-regime method (TRM), which includes the best parts of each type of model and therefore optimizes simulation results. The TRM uses both a compartment-based approach and a molecular-based approach. It divides the computational domain Ω into two non-overlapping parts which we will label ΩM and ΩC, i.e. Ω = ΩM ∪ ΩC. Modellers compartmentalize that part of the domain in which they feel a compartment approach is best suited (labelled ΩC in this paper) and consider molecules in ΩM as free molecules diffusing and reacting on a continuous space using molecular-based modelling rules. Therefore, molecules jump from compartment to compartment in the spatially coarse regime in ΩC and move according to Brownian motion in ΩM with an exact location. The purpose of this paper is to outline the best way to couple these two regimes. That is, we address the following questions. Where and when does a molecule jump from a compartment in ΩC into the molecular-based region ΩM? And, how does a particle migrate from the molecular-based regime in ΩM into a compartment in ΩC? Both of these questions relate to the way in which molecules experience the interface between the two regimes that we will denote as I, i.e I = ΩM ∩ ΩC. The schematic of the geometry of the TRM is shown in figure 1. To explain this method, we have to first summarize important facts about the compartment-based and molecular-based regimes. This will be done in §1.1 and §1.2. The TRM is then explained in full detail in §2.1.
Figure 1.
Graphical representation of the two-regime method.
1.1. Compartment-based modelling
The characterizing property of compartment-based stochastic models of reaction–diffusion processes is the fact that the domain is discretized. Molecules do not have exact locations as they do in Brownian dynamics simulations, but rather they are only assigned to be located within one of the compartments at a given moment in time. In particular, computer implementations of compartment-based models only store and evolve numbers of molecules in compartments (for each biochemical species). In what follows, we will consider the discretization of the computational domain using the compartments of the same size. This means that, in the case of three-dimensional simulations, compartments will be small cubes with the side equal to h. Similarly, compartments will be squares with the side h (respective intervals of length h) for two-dimensional (respectively one-dimensional) models. In each case, diffusion is modelled by allowing jumps of molecules between neighbouring compartments with rate D/h2, where D is the diffusion constant [19].
Compartment-based models postulate that chemical reactions only occur if the reactant molecules are in the same compartment [9]. Let us consider a general system of N chemical species that are subject to M chemical reactions in a domain ΩC that is discretized into K compartments. Then compartment-based models assign a propensity function αi,j(t), i = 1,2, … , M, j = 1, 2, … , K, to each chemical reaction in each compartment. Here, the product αi,j(t)dt is the probability that the i-th chemical reaction occurs in the j-th compartment during the infinitesimally small time interval [t,t + dt]. The propensity αi,j(t) depends on the number of available reactants in the compartment, the kinetic rate constant and the compartment size h [7]. In a similar way, one can assign the propensity of diffusive jumps from the j-th compartment, j = 1,2, … , K, to its neighbouring compartments to be αi,j(t) = D/h2, where i = M+1, … , M + dj and dj is the number of available compartments adjacent to the j-th compartment. In this way, the reaction events and the diffusive jumps are both contained in the propensities αi,j.
Because a real diffusing molecule's trajectory is continuous, if a molecule leaves a compartment, it enters a neighbouring compartment. This necessarily places a constraint on the time step in which the system is updated. Commonly, there are two separate ways of simulating molecule migration from compartment to compartment. The first is by designation of the time step Δt [20]. We will call this the time-driven approach. This is a less accurate, but simpler, method of simulation. Regardless of how small the time step is, there will be a non-zero probability for molecules to move more than one compartment, which leads to inaccuracies in the results. However, accuracy is assured so long as the probability for a single molecule to move just one compartment, DΔt/h2, is small (which makes the probability for two compartment jumps negligible). Further restrictions on the time step might also be provided by fast chemical reactions.
A more common approach to compartment-based modelling is given by event-driven algorithms, which simulate the evolution of the system by picking the time step that corresponds to the next diffusive jump or reaction event [21,22]. Examples include the Gillespie algorithm [21], next reaction method [22] and next subvolume method [9]. In the next reaction method, the time t + τi,j for each reaction and diffusion jump is computed putatively by
 |
1.1 |
where ri,j is a uniformly distributed random number in (0,1). In particular, if the compartment size h is reduced, then the propensities D/h2 of the molecules to migrate between compartments increases, which causes the time step between diffusive events to decrease in turn. Thus, in both time-driven and event-driven algorithms, the time step and the compartment size are inherently linked (either by the constraint of small jumping probabilities or by correlation between the randomly selected time step and the compartment size).
1.2. Molecular-based modelling
Computer implementations of molecular-based models in the literature store and evolve the positions of all biomolecules of interest [13]. The trajectories of large biomolecules (proteins) are computed through Brownian dynamics [23]. This is done by the inclusion of a random motion term that models the effect of solvent molecules on the biomolecules of interest without the need to simulate each solvent molecule individually. In the time-driven algorithms, the position xi(t + Δt) of the i-th molecule at time t + Δt is computed from its position xi(t) at time t by
| 1.2 |
where ζ = [ζx, ζy, ζz] is a vector of three normally distributed random numbers with zero mean and unit variance. Chemical reactions are then performed at each time step according to the probability of each reaction. Probabilities of bimolecular reactions also depend on the distance of possible reactants [7,13]. Molecules that migrate over domain boundaries are treated depending on whether they are reflective, absorbing or reactive boundaries [18].
A time-driven Brownian model is simple to implement, but may not be efficient. Prescribing a time step Δt to an arbitrary simulation can be difficult because if the concentration is too small, then many time steps will be calculated before any interactions or interesting features may take place. Sometimes event-driven algorithms are preferred for Brownian dynamical models. An example is the GFRD method [17] that chooses a time step based on the current system configuration. It makes use of the fact that single-particle and two-particle problems can be solved analytically using Green's functions, and selects the time step in such a way that the system evolution can be approximated as a collection of two-particle (or single-particle) problems.
2. Results
2.1. Two-regime method
The TRM is a spatially hybrid model for stochastic reaction–diffusion processes that uses a two-part domain Ω. One part, ΩC, is discretized into compartments and the other, ΩM, is a molecular-based subdomain (Ω = ΩC ∪ ΩM). The interface between the subdomains is denoted as I ≡ ∂ΩC ∪ ∂ΩM. The algorithm is graphically presented in figure 1. Some details of the implementation of TRM are dependent on the choice of algorithms governing each individual regime, i.e. whether we use a time-driven or event-driven approach in ΩC and ΩM. In this section, we focus on the most common case. Other cases are discussed in §3.
Commonly, compartment-based stochastic reaction–diffusion models are implemented using an event-driven algorithm [9], while molecular-based stochastic reaction–diffusion models are implemented using a time-driven approach [13]. We therefore present the TRM that integrates an event-driven compartment-based reaction–diffusion regime (next reaction method [22]) and a time-driven molecular-based reaction–diffusion regime (for example, that used by Smoldyn [13]). The algorithm is summarized in table 1.
Table 1.
The two-regime method (TRM) for stochastic reaction–diffusion simulation.
|
Molecules in both ΩC and ΩM are simulated according to the rules defined by their particular algorithm. Therefore, when initializing in step (i), molecules are placed according to compartment in ΩC and according to coordinate in ΩM. The propensity for molecules to migrate from compartments adjacent to the interface I into ΩM is given by Φ1D/h2 per molecule, where Φ1 is the change in the propensity of migration (from that of an internal migratory event) that is included to make the molecular flux over the interface I consistent with diffusion. We have determined Φ1 to be (see appendix A)
| 2.1 |
where Δt is the fixed time increment defined for updating the molecules in ΩM. We use (1.1) to find the putative times t + τi,j for the next reaction/migration events in ΩC. We call these C-events. They include the jumps from ΩC to ΩM, which have propensities equal to Φ1D/h2 multiplied by the number of molecules in the corresponding compartment. Therefore, we define dj to be the number of available directions in which a molecule may jump, including a jump over the interface I. In step (ii), we also initialize the time of the next update of molecules in ΩM as tM = Δt (we call these M-events).
The algorithm then proceeds by repeating steps (iii) and (iv), which compute C-events and M-events respectively. At each C-event, we track the reaction-migratory events that occur in ΩC. At each M-event, we update the entire system of molecules in ΩM by calculating the new positions of molecules in ΩM using (1.2) and the reactions using the method prescribed by the specific molecular-based algorithm [13,23]. At each M-event, we also introduce new molecules from ΩC into ΩM by placing them at a distance x from the interface I that is sampled from the probability distribution f(x). These new molecules arise from those C-events that have occurred since the previous M-event. We have determined that (see appendix A)
 |
2.2 |
where x ≥ 0 is the distance from the boundary, and  is the complementary error function. To sample efficiently from this distribution, one can follow the method presented in Andrews [24, eqn (35)]. Note that the probability distribution (2.2) can also be interpreted as a concentration profile created by diffusion over the period of Δt from initial concentration given as a Heaviside function [25]. This implies that the molecular-based algorithm ‘senses’ the compartment as a continuous, uniform, distribution of particles rather than a single source of particles originating at the node of the compartment or any other specific microscopic arrangement.
In step (iv), we also identify all molecules that migrate from ΩM to ΩC during an M-event. These include those molecules which have new locations calculated by (1.2) in ΩC. However, we also have to include some molecules that have their new locations calculated by (1.2) in ΩM. In appendix A, we show that every molecule has a probability Pm to migrate from ΩM to ΩC during an M-event where
 |
2.3 |
where Δxold is the distance of the molecule from the interface I before the M-event and Δxnew is the calculated distance from the interface I at the current M-event. All molecules that migrate from ΩM to ΩC are placed into the corresponding (nearest) compartment in ΩC. It is worth noting that (2.3) is also used in some stochastic reaction–diffusion algorithms for the treatment of boundary conditions [13,18]. In the TRM, the external (physical) boundary conditions are implemented for each regime in the usual way (e.g. [18]), where treatment of reflective, absorbing and reactive boundaries is discussed. Furthermore, it is also worth noting that implementation of absorbing molecules implicitly (using (2.3)) is very costly numerically. If one were to simply allow transfer of molecules based on whether or not they appear on the other side of the interface, an error proportional to the net flux over the interface would be the result.
For both C-events and M-events, when the propensity αi,j is changed owing to a change in ΩC, we must recalculate the putative time t + τi,j for the next C-event to take place. Following Gibson & Bruck [22], we update τi,j as follows:
 |
2.4 |
where αi,jold(t) is the propensity before the event at time t and αi,jnew(t) is the propensity after the event.
Migratory events from compartments into ΩM occur at C-events. Until they are initialized, they have no probability of interaction or reaction. The probability of reaction is calculated after the initialization at the next M-event depending on its initialized position in comparison with other molecules that it may interact with. This consideration does not affect the accuracy of the algorithm because the time between a C-event and the subsequent M-event is small (smaller than Δt).
Mathematical justification of the TRM is given in appendix A. In order to demonstrate the validity of the TRM, we will present results for two test problems for which one can derive analytically the exact solution. We can therefore test our stochastic simulation by increasing the number of realizations and observing convergence between the exact solution and the stochastic simulation. The first test problem is presented in §2.2. It has been designed so that a large range of different concentrations and fluxes will exist at some stage on and across the interface so that theoretical agreement will provide more compelling validation of the algorithm in all possible situations. In §2.3, we will apply the TRM to a particular model of protein concentration gradients in order to demonstrate the usefulness of the TRM to an existing biological model [26].
2.2. Illustrative results: diffusion example
We will consider one-dimensional diffusion of N0 non-interacting molecules with diffusion constant D = 1 in the domain Ω = [0,1]. In this example, all parameters are dimensionless. The boundaries of the domain Ω are defined to be reflective. We assume that initially all molecules are uniformly distributed in the subinterval [0,0.5]. Physically, this problem is nothing other than the diffusion of molecules squashed into half a room being suddenly allowed to fill the room. This problem can be stated as the following initial boundary value problem for the (normalized) density ϱ of molecules
| 2.5 |
where ϱ(x,0) = 2H(0.5 − x), ϱx(0,t) = ϱx(1,t) = 0 and H is the Heaviside function. The solution can be found by applying the separation of variables technique to (2.5) as
 |
2.6 |
This solution will be used to test the validity of the TRM.
To apply the TRM, we divide Ω into the following compartment-based and molecular-based parts: ΩC = [0,0.5] and ΩM = [0.5,1]. Therefore, the interface I is located at I = ∂ΩC ∩ ∂ΩM = {0.5}. The compartment-based domain ΩC is discretized into K = 20 compartments (subintervals) of the length h = 0.025. The compartment-based model will give us the time evolution of a vector of integers n = [n1, n2, … , nK], where ni is the number of molecules in the i-th compartment, i = 1,2, … , K. Initially, all N0 molecules are placed in ΩC in random compartments with equal probability. This constitutes step (i) in table 1. In step (ii), we choose the time step Δt as Δt = 10−6; therefore, Φ1 given by (2.1) is approximately 28.
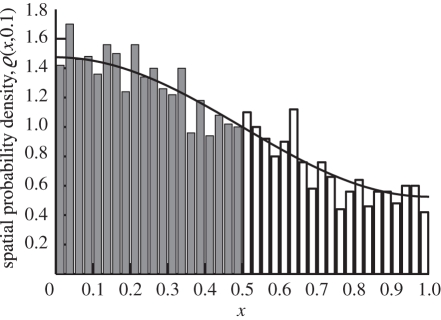
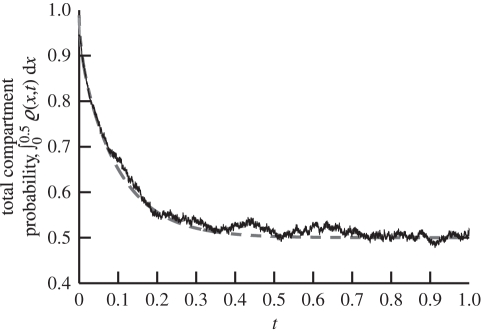
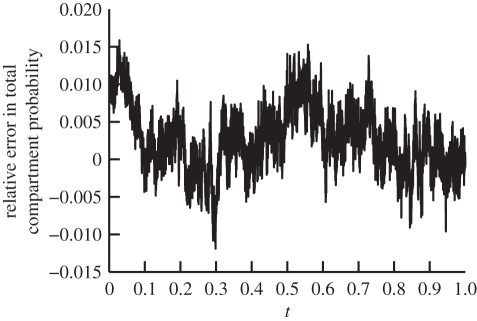
Figure 2 is a plot of the distribution comparing the solution (2.6) and the distribution that is produced using our stochastic algorithm at t = 0.1. We use N0 = 2000 molecules in these simulations. For comparative purposes, the molecules in ΩM are counted and compartmentalized so that we can see their relative concentration to that of the compartments in ΩC. While good agreement is observed, we require a more quantitative comparison. It has been established in the literature that the algorithms that govern the internal processes of ΩM and ΩC are consistent with diffusion, and therefore we are most interested with the accuracy of the flux over the boundary. For this reason, we compare the total probability to find molecules in ΩC with that predicted by (2.6) (i.e. ∫00.5ϱ(x,t)dx). A comparison of a theoretical probability and simulation containing N0 = 2000 molecules shows good agreement over time in figure 3. Simulation of the TRM with N0 = 3 × 10⁴ overlaps that of the theory in figure 3. Thus, in figure 4, we present a plot of the error between the expected probability to find molecules in ΩC and that of a simulation with N0 = 3 × 10⁴ molecules over time to demonstrate that there is no apparent time-dependent error that is associated with the algorithm; rather, there are unbiased fluctuations around the true expected probability. The test problem, therefore, provides very strong validation of the proposed algorithm.
Figure 2.
The TRM applied to the diffusion example which was introduced in §2.2. We plot the spatial distribution of molecules at time t = 0.1 according to (2.6) (black line) and TRM (compartment molecule probability density shown in dark compartment bars and free molecules counted into compartments and shown in white bars). The compartmental separation is h = 0.025.
Figure 3.
Plot of total probability to find a particle bound to a compartment as a function of time (∫00.5ϱ(x,t)dx) according to (2.6) (grey dashed line) and from simulation of 2000 molecules (solid black line) using the TRM for the diffusion example from §2.2.
Figure 4.
Relative stochastic error of the total probability to find a particle bound to a compartment (∫00.5ϱ(x,t)dx) between simulation of the diffusion example (given in §2.2) using the TRM with 3 × 10⁴ molecules and the theoretical value calculated using (2.6), as a function of time.
2.3. Morphogen gradient model
In the second test problem, we simulate a model of a diffusing morphogen presented by Tostevin et al. [26]. Consider a system of no molecules on the semi-infinite domain Ω = [0,∞). Morphogen molecules are produced at the origin x = 0 at a rate J = 6.25 µm−1 s−1 and diffuse with a diffusion coefficient of D = 0.5 µm2 s−1. We implement a zero flux boundary condition at the origin. The molecules undergo decay with rate μ = 1 s−1. Intuitively, because molecules are produced only at the origin and decay as they diffuse away from the origin, there will be a large concentration of molecules near the origin that dissipate as x gets large. If a molecular-based algorithm were to be used for this model, at small values of x, where there are characteristically a lot of molecules, high computational effort will be needed, whereas accurate and efficient results are achievable using a compartment-based model. However, using a compartment-based algorithm for the entire model would mean necessarily truncating the domain and introducing errors associated with small concentrations at large values of x. This type of problem is ideal for the TRM because we would prefer to use the efficiency of a compartment-based model for small x and the precision of a molecular-based model for large x. We, therefore, simulate the model using the TRM and place the interface at an arbitrarily chosen location (x = 1 µm). Therefore, ΩC = [0,1) and ΩM = [1,∞). In the large J limit, we expect the concentration of molecules, ϱ(x,t) to obey the PDE
| 2.7 |
where δ(x) is the Dirac delta function. While there is zero flux over the boundary, the introduction of the point source term at x = 0 gives us a formal boundary condition of ϱx(0,t) =−J/D. The initial condition is ϱ(x,0) = 0. The time-dependent analytical solution is given by Bergmann et al. [27]
 |
2.8 |
where  is the characteristic decay length. Using this analytical solution, we can discuss the accuracy of the TRM by combining 5000 simulations of this problem.
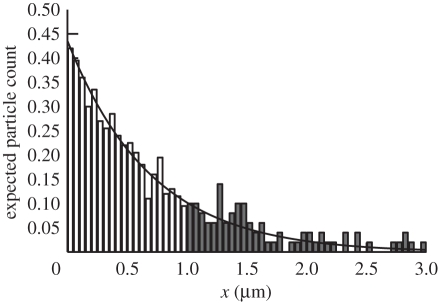
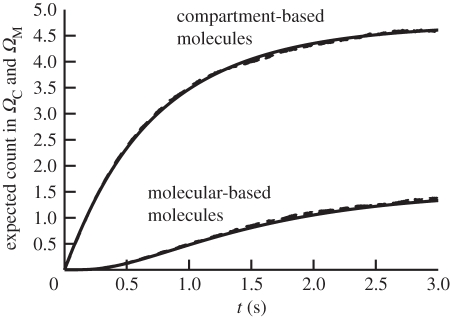
We chose the following parameters for our simulation results; Δt = 0.1 ms for the molecular-based model and h = 0.05 µm for the compartment-based model. Figure 5 is a plot of the distribution comparing the analytical solution (2.8) and the distribution that is produced using our stochastic algorithm averaged over 5000 realizations at time t = 3 s. In order to test that the interface properties of the TRM are accurate, we compare ∫01ϱ(x,t)dx computed by (2.8) with the total number of compartment-bound molecules averaged over 5000 simulations and ∫1∞ϱ(x,t)dx with the total number of molecules in ΩM averaged over the same 5000 simulations. The results are shown in figure 6. The stochastic and analytical results are in clear agreement.
Figure 5.
The TRM applied to the morphogen gradient model that was introduced in §2.3. Plot of the expected morphogen molecule count per compartment evaluated at t = 3 s according to (2.8) (black line) and 200 realizations of the TRM simulation (compartment molecule probability density shown in white compartment bars and free molecules counted into compartments and shown in dark bars).
Figure 6.
Plot of total expected number of morphogen molecules found in both ΩC and ΩM as a function of time for the analytical solution according to (2.8) (solid lines) and TRM simulation results averaged over 5000 realizations (dashed lines).
3. Discussion
In this manuscript, we have successfully interfaced a compartment-based model of diffusion to a Brownian dynamics model of diffusion. We have derived and verified, for any process that has diffusion as its dominant form of molecule mobility, very particular rules in which molecules may freely migrate between a compartment-based regime and a free Brownian dynamics regime. The ability to interchange the modelling approach in spatially specific areas allows greater control in simulation and in particular allows a modeller to have the precision of a molecular-based regime in regions where it is needed, while having the computational efficiency of compartment-based approaches where it is appropriate. In order to interface the two regimes, one simply needs to migrate molecules between regimes according to the rules described in table 1 and using the coupling parameters given in equations (2.1) and (2.2). Their mathematical justification is given in appendix A.
It is important to note that, while we have focused on presenting the TRM using an event-driven compartment-based regime and a time-driven molecular-based regime, it is possible to use any desired combination of compartment-based and molecular-based regimes. In the case where algorithms in both ΩC and ΩM are event-driven (for example, using the GFRD [17] in ΩM), the parameters Φ1 and f(x) are the same. Care must be taken in this case. Molecule migration from ΩM to ΩC occurs at the moment of first contact with the interface I. Furthermore, equation (2.1) implies that (in the case of an event-driven algorithm) Φ1 is dependent on τi,j, which in turn determines the propensity for the diffusive events on interfacial compartments in ΩC and therefore determine τi,j itself. The putative time for the migration of a particle from the boundary compartment in ΩC to ΩM is calculated from some current time in the following way:
 |
3.1 |
where nb is the number of molecules in the compartment at the interface and r is a uniformly distributed random number in (0,1). Notice from (2.1) that  is equal to
  , which is a constant with respect to τi,j. Therefore, using (3.1), we find that τi,j can be computed by the following formula:
 |
3.2 |
The illustrative algorithms that we presented were effectively one-dimensional, but the algorithm naturally extends by symmetry into higher dimensions with flat interfaces. It still remains to extend the work into curved higher dimensional interfaces and systems with advection as a form of molecule mobility. Another important extension is to consider unstructured meshes [28] and complex geometries [29]. We are currently working on these important extensions and we will report our findings in a future publication. The presented algorithm has the potential to significantly increase the accuracy and speed at which stochastic reaction–diffusion simulations are implemented by giving the simulator control over modelling approaches in specific regions of interest.
Acknowledgements
The research leading to these results has received funding from the European Research Council under the European Community's Seventh Framework Programme (FP7/2007-2013)/ERC grant agreement no. 239870. This publication was based on work supported in part by award no. KUK-C1-013-04, made by the King Abdullah University of Science and Technology (KAUST). R.E. would also like to thank Somerville College, University of Oxford, for a Fulford Junior Research Fellowship.
Appendix A. derivation of parameters (2.1)–(2.3)
In this appendix, we derive equations (2.1) and (2.2), i.e. we derive equations relating the TRM parameters Φ1 and f(x) and the parameters of compartment-based and molecular-based models. This derivation will also make use of an auxiliary parameter Φ2 (which does not explicitly appear in the formulation of the TRM, because its value is determined to be equal to 2 in all cases). We also justify equation (2.3).
Without loss of generality, consider an interface at x = 0. To the left of this interface, a compartment-based model is used with fixed compartment size h. To the right of the interface, a molecular-based algorithm is used, updated at fixed time increments of Δt. Our aim is to choose the parameters that govern the transfer of molecules across the interface from one model to the other in such a way as to make the interface ‘invisible’ in the solution: the switch of models does not reflect anything in the underlying physical processes, it is simply a mathematical construct to aid the simulation.
To determine these parameters, we focus on the purely diffusive problem, because bulk reactions have no effect on boundary conditions [18]. Then the exact description of the underlying physical problem is a set of N molecules undergoing Brownian motion. We write  for the distribution function for this process, so that
  gives the probability of finding a given molecule in the interval [x,x + dx) at time t. In the purely diffusive case,
  satisfies the diffusion equation.
The stochastic models we are using on either side of the interface at x = 0 both provide an approximation to  (as h → 0 and Δt → 0). We need to choose the coupling parameters so that these approximations join together smoothly—that is, they both give the same value of
  and
and  , where the subscript indicates partial differentiation.
We label the compartment [−kh, − kh + h) by k and denote the probability of finding a molecule in it by pk(t)h (so that pk(t) approximates the probability density function  above). Since the inter-regime interface does not work in the same way as the interface between two neighbouring compartments, we generalize the transition rate from the compartments over the interface using the parameter Φ1. As discussed in §2.1, this transition rate will be given as Φ1D/h2. If the molecule is transmitted, we have to decide where to place it: we suppose that it is placed at a random position in x > 0 with the probability distribution function f(x) (so that it is placed in the interval [x,x + dx) with probability f(x)dx).
We introduce parameters ψ1 and ψ2 to control the flux of molecules flowing from ΩM to ΩC as follows. Let us consider a system in which a molecule in ΩM is absorbed from the interface (at x = 0) and placed in the corresponding compartment in ΩC with a probability ψ1 if, in a given time step, it generates a negative x coordinate (say −x′ < 0) through the process of Brownian motion (using equation (1.2)). Such molecules are therefore reflected back into ΩM with a probability 1 − ψ1 and, in such circumstances, placed at x′ > 0. Furthermore, consider that a molecule starting at position y′ > 0 is calculated to randomly appear at x′ > 0 at the end of a given time step by equation (1.2). There is a probability that this molecule has, in this time step, crossed over the interface (at x = 0) and made its way back to x′ > 0. This probability has been presented previously by Andrews & Bray [13] and is given by
 |
A 1 |
We consider, for a full description of the interface as it is seen by molecules in ΩM, that, along with the probability ψ1 to absorb molecules at the interface from ΩM, we also absorb molecules with a probability ψ2Pm(x′,y′), where ψ2 ∈ [0,1] is another parameter of the method.
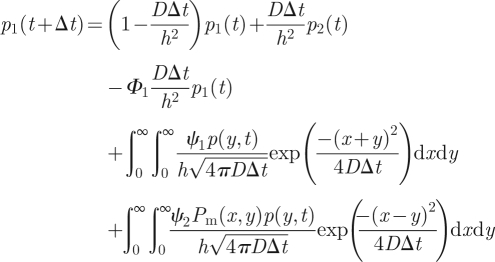
If we denote by p(x,t) the probability density function of the discrete-time molecular-based algorithm, then these transmission/reflection rules are implemented in the following way:
 |
A 2 |
and
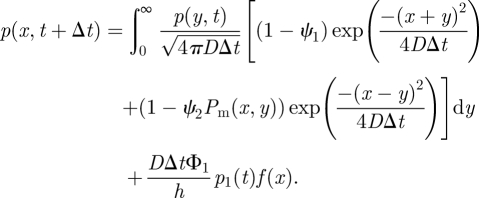 |
A 3 |
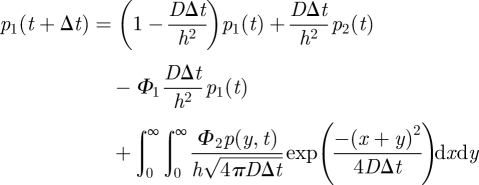
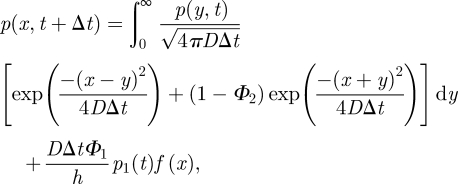
The first and third terms of (A 2) represent the loss of molecules in a given time step from the interfacial compartment 1 into ΩM and compartment 2. The second term in (A 2) represents the addition of molecules into the interfacial compartment 1 from compartment 2 by standard-compartment-based jumping. The fourth and fifth terms in (A 2) represent those molecules that are introduced into compartment 1 from ΩM by the methods described by the probabilities ϕ1 and ϕ2, respectively. The integral in (A 3) represents the change in the probability density to find molecules in ΩM owing to diffusion, including losses to compartment 1 by both of the methods described by the probabilities ϕ1 (in term 1 of the integrand) and ϕ2 (in term 2 of the integrand). The final term in (A 3) represents the addition of molecules from compartment 1 distributed into ΩM according to the distribution f(x). Denoting Φ2 = ψ1 + ψ2 and using (A 1), equations (A 2) and (A 3) can be rewritten as follows:
 |
A 4 |
and
 |
A 5 |
where 0 ≤ Φ2 ≤ 2. Note that if f(x) vanishes away from x = 0, then equation (A 5) reduces to the Fokker–Planck equation for finite-time-step Brownian motion and thus to the diffusion equation in the limit Δt → 0. However, in the vicinity of x = 0, there is a boundary layer of width  [18]. We rescale (A 4) and (A 5) using the (dimensionless) boundary layer coordinate
  . We also denote the probability density and placement function in this boundary layer region by
  and
and  . Note the rescaling of f, which is necessary to satisfy the normalization condition ∫0∞f(x)dx = 1 because (as we will see) f vanishes outside the boundary layer. Thus, in the boundary layer scalings, (A 4) and (A 5) become
 |
A 6 |
and
 |
A 7 |
where K(x) = (4π)−1/2 exp(−x2/4). Now in order for our two models to join smoothly, we require on the compartment-based side that
 |
and
 |
while, for the molecular-based side, we want no rapid variation in the boundary layer, so that
| A 8 |
We have allowed here for a small shift C in where the molecular-based region ‘sees’ the interface; we will see that this extra degree of freedom is crucial. Equivalently we could have said that pk(t) approximates  rather than
  : C is really a small phase shift between the spatial coordinate in the two regions. Substituting these expansions into (A 6) and (A 7) and equating coefficients of h0 and h1 (with
  as h,
as h,  ) gives
| A 9 |
 |
A 10 |
 |
A 11 |
and
 |
A 12 |
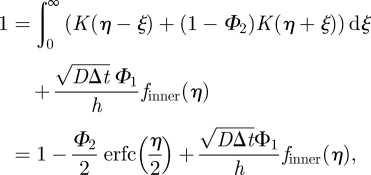
From (A 9) we find
| A 13 |
Then (A 11) gives
| A 14 |
corresponding to the unscaled
 |
A 15 |
which is denoted as equation (2.2) in the paper. The normalization condition on f is automatically satisfied.
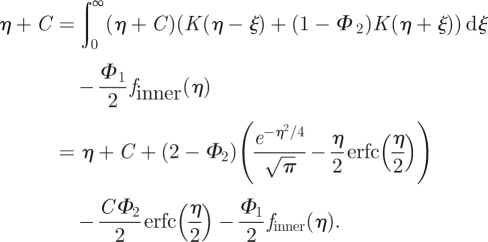
Substituting (A 14) and (A 10) into (A 12) gives
 |
from which we find
| A 16 |
Because Φ2 = ψ1 + ψ2, where ψ1 and ψ2 are probabilities, the only option is that both ψ1 and ψ2 are equal to 1. This justifies the use of equation (2.3) in the TRM, because equation (2.3) is the probability given by (A 1). Substituting (A 16) in (A 9), we derive the formula for Φ1, which is presented as equation (2.1) in the paper. Finally, substituting this value into (A 10) gives
| A 17 |
One interpretation of this value of C is that we should think of pk(t) as approximating  , so that p1(t) approximates
  and not
  .
.
References
- 1.Erdmann T., Howard M., ten Wolde P. R. 2009. The role of spatial averaging in the precision of gene expression patterns. Phys. Rev. Lett. 103, 258101. 10.1103/PhysRevLett.103.258101 (doi:10.1103/PhysRevLett.103.258101) [DOI] [PubMed] [Google Scholar]
- 2.Takahashi K., Tănase-Nicola S., ten Wolde P. R. 2010. Spatio-temporal correlations can drastically change the response of a MAPK pathway. Proc. Natl Acad. Sci. USA 107, 19 820–19 825 10.1073/pnas.0906885107 (doi:10.1073/pnas.0906885107) [DOI] [PMC free article] [PubMed] [Google Scholar]
- 3.Lipkow K., Andrews S. S., Bray D. 2005. Simulated diffusion of phosphorylated CHeY through the cytoplasm of Escherichia coli. J. Bacteriol. 187, 45–53 10.1128/JB.187.1.45-53.2005 (doi:10.1128/JB.187.1.45-53.2005) [DOI] [PMC free article] [PubMed] [Google Scholar]
- 4.Fange D., Elf J. 2006. Noise-induced Min phenotypes in E. coli. PLoS Comput. Biol. 2, 637–648 10.1371/journal.pcbi.0020080 (doi:10.1371/journal.pcbi.0020080) [DOI] [PMC free article] [PubMed] [Google Scholar]
- 5.Tomita M. 2001. Whole-cell simulation: a grand challenge of the 21st century. Trends Biotechnol. 19, 205–210 10.1016/S0167-7799(01)01636-5 (doi:10.1016/S0167-7799(01)01636-5) [DOI] [PubMed] [Google Scholar]
- 6.Murray J. D. 2003. Mathematical biology II: spatial models and biomedical applications, pp. 403–420 Berlin, Germany: Springer [Google Scholar]
- 7.Erban R., Chapman J. 2009. Stochastic modelling of reaction–diffusion processes: algorithms for bimolecular reactions. Phys. Biol. 6, 046001. 10.1088/1478-3975/6/4/046001 (doi:10.1088/1478-3975/6/4/046001) [DOI] [PubMed] [Google Scholar]
- 8.Fange D., Berg O. G., Sjöberg P., Elf J. 2010. Stochastic reaction–diffusion kinetics in the microscopic limit. Proc. Natl Acad. Sci. USA 107, 19 820–19 825(doi:10.1073/pnas.1006565107) [DOI] [PMC free article] [PubMed] [Google Scholar]
- 9.Hattne J., Fange D., Elf J. 2005. Stochastic reaction–diffusion simulation with MesoRD. Bioinformatics 21, 2923–2924 10.1093/bioinformatics/bti431 (doi:10.1093/bioinformatics/bti431) [DOI] [PubMed] [Google Scholar]
- 10.Ander M. 2004. SmartCell, a framework to simulate cellular processes that combines stochastic approximation with diffusion and localisation: analysis of simple networks. Syst. Biol. 1, 129–138 10.1049/sb:20045017 (doi:10.1049/sb:20045017) [DOI] [PubMed] [Google Scholar]
- 11.Isaacson S. A. 2009. The reaction–diffusion master equation as an asymptotic approximation of diffusion to a small target. SIAM J. Appl. Math. 70, 77–110 10.1137/070705039 (doi:10.1137/070705039) [DOI] [Google Scholar]
- 12.Isaacson S. A., Isaacson D. 2009. Reaction–diffusion master equation, diffusion-limited reactions, and singular potentials. Phys. Rev. E 80, 066106. 10.1103/PhysRevE.80.066106 (doi:10.1103/PhysRevE.80.066106) [DOI] [PMC free article] [PubMed] [Google Scholar]
- 13.Andrews S. S., Bray D. 2004. Stochastic simulation of chemical reactions with spatial resolution and single molecular detail. Phys. Biol. 1, 137–151 10.1088/1478-3967/1/3/001 (doi:10.1088/1478-3967/1/3/001) [DOI] [PubMed] [Google Scholar]
- 14.Andrews S. S., Addy N. J., Brent R., Arkin A. P. 2010. Detailed simulations of cell biology with Smoldyn 2.1. PLoS Comput. Biol. 6, e1000705 10.1371/journal.pcbi.1000705 (doi:10.1371/journal.pcbi.1000705) [DOI] [PMC free article] [PubMed] [Google Scholar]
- 15.Stiles J. R., Bartol T. M. 2001. Monte Carlo methods for simulating realistic synaptic microphysiology using MCell. In Computational neuroscience: realistic modeling for experimentalists (ed. De Schutter E.), pp. 87–127 Boca Raton, FL: CRC Press. [Google Scholar]
- 16.Kerr R. A., Bartol T. M., Kaminsky B., Dittrich M., Chang J.-C. J., Baden S. B., Sejnowski T. J., Stiles J. R. 2008. Fast Monte Carlo simulation methods for biological reaction–diffusion systems in solution and on surfaces. SIAM J. Sci. Comput. 30, 3126–3126 10.1137/070692017 (doi:10.1137/070692017) [DOI] [PMC free article] [PubMed] [Google Scholar]
- 17.van Zon J. S., ten Wolde P. R. 2005. Simulating biochemical networks at the particle level and in time and space: Green's function reaction dynamics. Phys. Rev. Lett. 94, 128103. 10.1103/PhysRevLett.94.128103 (doi:10.1103/PhysRevLett.94.128103) [DOI] [PubMed] [Google Scholar]
- 18.Erban R., Chapman J. 2007. Reactive boundary conditions for stochastic simulations of reaction–diffusion processes. Phys. Biol. 4, 16–28 10.1088/1478-3975/4/1/003 (doi:10.1088/1478-3975/4/1/003) [DOI] [PubMed] [Google Scholar]
- 19.Erban R., Chapman J., Maini P. 2007. A practical guide to stochastic simulations of reaction–diffusion processes. (http://arxiv.org/abs/0704.1908) [DOI] [PubMed] [Google Scholar]
- 20.Tomita M., et al. 1999. E-Cell software environment for whole-cell simulation. Bioinformatics 15, 72–84 10.1093/bioinformatics/15.1.72 (doi:10.1093/bioinformatics/15.1.72) [DOI] [PubMed] [Google Scholar]
- 21.Gillespie D. 1977. Exact stochastic simulation of coupled chemical reactions. J. Phys. Chem. 81, 2340–2361 10.1021/j100540a008 (doi:10.1021/j100540a008) [DOI] [Google Scholar]
- 22.Gibson M., Bruck J. 2000. Efficient exact stochastic simulation of chemical systems with many species and channels. J. Phys. Chem. A 104, 1876–1889 10.1021/jp993732q (doi:10.1021/jp993732q) [DOI] [Google Scholar]
- 23.Lipkova J., Zygalakis K. C., Chapman S. J., Erban R. 2011. Analysis of Brownian dynamics simulations of reversible biomolecular reactions. SIAM J. Appl. Math. 71, 714–730 10.1137/100794213 (doi:10.1137/100794213) [DOI] [Google Scholar]
- 24.Andrews S. S. 2009. Accurate particle-based simulation of adsorption, desorption and partial transmission. Phys. Biol. 6, 046015. 10.1088/1478-3975/6/4/046015 (doi:10.1088/1478-3975/6/4/046015) [DOI] [PMC free article] [PubMed] [Google Scholar]
- 25.Crank J. 1975. The mathematics of diffusion. Oxford, UK: Oxford University Press [Google Scholar]
- 26.Tostevin F., ten Wolde P. R., Howard M. 2007. Fundamental limits of position determination by concentration gradients. PLoS Comput. Biol. 3, 0763–0771 [DOI] [PMC free article] [PubMed] [Google Scholar]
- 27.Bergmann S., et al. 2007. Pre-steady-state decoding of the bicoid morphogen gradient. PLoS Comput. Biol. 5, 0232–0242 [DOI] [PMC free article] [PubMed] [Google Scholar]
- 28.Engblom S., Ferm L., Hellander A., Lötstedt P. 2009. Simulation of stochastic reaction-diffusion processes on unstructured meshes. SIAM J. Sci. Comput. 31, 1774–1797 10.1137/080721388 (doi:10.1137/080721388) [DOI] [Google Scholar]
- 29.Isaacson S. A., Peskin C. S. 2007. Incorporating diffusion in complex geometries into stochastic chemical kinetics simulations. SIAM J. Sci. Comput. 28, 47–74 10.1137/040605060 (doi:10.1137/040605060) [DOI] [Google Scholar]


