Abstract
The mechanical properties of skin are important tissue parameters that are useful for understanding skin patho-physiology, which can aid disease diagnosis and treatment. This paper presents an innovative method that employs phase-sensitive spectral-domain optical coherence tomography (PhS-OCT) to characterize the biomechanical properties of skin by measuring surface waves induced by short impulses from a home-made shaker. Experiments are carried out on single and double-layer agar–agar phantoms, of different concentrations and thickness, and on in vivo human skin, at the forearm and the palm. For each experiment, the surface wave phase-velocity dispersion curves were calculated, from which the elasticity of each layer of the sample was determined. It is demonstrated that the experimental results agree well with previous work. This study provides a novel combination of PhS-OCT technology with a simple and an inexpensive mechanical impulse surface wave stimulation that can be used to non-invasively evaluate the mechanical properties of skin in vivo, and may offer potential use in clinical situations.
Keywords: phase-sensitive optical coherence tomography PhS-OCT, phase-sensitive measurement, surface waves, phase-velocity dispersion, skin mechanical properties
1. Introduction
The mechanical properties of skin are important tissue parameters useful for understanding skin patho-physiology, which can aid medical diagnosis and treatment, e.g. scleroderma and skin cancer [1–3]. Most skin pathologies result in changes of their elastic properties and/or thickness. The diagnosis of skin cancer is commonly detected by the changes in stiffness of the tumour compared with its surrounding tissue, such as an increase in the Young modulus of squamous cell carcinomas and malignant melanomas and a decrease in the Young modulus of basal cell carcinomas [4,5]. Therefore, the evaluation of the elastic properties of skin tissues is important for the early diagnosis and the treatment of many skin diseases.
Currently, most skin diseases are diagnosed qualitatively based on a visual inspection and/or palpation by a dermatologist who has significant training and clinical experience in the field. During manual palpation, pathological tissue regions can be identified by having a different strain response to an imposed stress compared with its surrounding healthy tissue. The magnitude of the strain response depends on the nature of the pathology [6]. This method of diagnosis has high variability among dermatologists; therefore, a fast, inexpensive and non-invasive technique capable of analysing and quantifying skin mechanical properties is in demand.
There are several methods that have been developed to measure in vivo the mechanical properties of soft tissues in recent years. Magnetic resonance elastography and ultrasound elastography have been used to measure the shear wave dispersion induced by a shaker [3,7,8]. Although these methods track the shear wave propagation inside the tissue to determine the elastic properties, they offer limited spatial resolution for detecting small lesions. Optical methods are attractive in evaluating the skin mechanical properties because they can provide information, both quantitatively and qualitatively. Optical coherence elastography (OCE) has been proposed for dermatological applications and explored by a number of research groups based on speckle tracking [9–12] and Doppler shift between A-scans [13–15]. In vivo OCE was first preformed in multiple skin sites of human subjects by Kennedy et al. [16]. They presented a dynamic OCE system for mapping the strain of skin, which was induced by a ring actuator [16]. Recently, this method was further developed into an in vivo three-dimensional OCE imaging system to evaluate normal and hydrated skin [17]. Liang et al. [18] employed three-dimensional multi-photon microscopy to detect the biomechanical properties of in vivo human skin at the cellular level. In addition, Grimwood et al. [19] presented a technique for generating contrast in two-dimensional shear strain elastograms from a localized stress, by generating a non-uniform, localized stress via a magnetically actuated implant. These quantitative methods provide tissue images that enable healthy tissues to be distinguished from diseased tissues. Liang & Boppart [20] introduced a method of using OCE for measuring a continuous wave (CW) excited by an external shaker, from which they were able to quantify the elastic properties of human skin in vivo. In their study, different driven frequencies were used to determine the Young modulus from different layers of a specimen. Qiang et al. [21] used a laser displacement sensor to measure surface waves generated by an impulse stimulation, and calculated the phase velocity of these waves, for which the mechanical properties were derived. A previous study from our group explored a method that combined laser ultrasonics and low-coherence interferometry to evaluate single- and double-layer soft tissue mimicking phantoms [22]. By calculating and analysing the phase-velocity curve from a laser-induced surface acoustic wave (SAW), we were able to determine the Young modulus from different layers of a phantom. These results demonstrate that the impulse response approach is faster and more accurate than the CW method. The impulse-stimulated wave propagates on the surface of the sample. This wave is rich in frequency content, which enables the determination of the mechanical properties of different skin layers within a single measurement and analysis. Previous studies [21,22] have suggested that measuring surface waves with both a laser displacement sensor and low-coherence interferometry is highly sensitive to the shape of the tissue surface. Therefore, it has been difficult to determine the skin properties because the skin is rough, and has curvatures [21]. Also, it is difficult to obtain a detecting position containing a high signal-to-noise ratio (SNR).
This paper proposes a novel combination of an impulse-stimulated surface wave with a phase-sensitive optical coherence tomography (PhS-OCT) system that can be used to evaluate the mechanical properties of skin. In this study, an inexpensive home-made shaker was used to generate the impulse stimulations, which produced the surface waves from the tissue-mimicking phantoms and from in vivo human skin. As opposed to using a short laser pulse [22], the shaker is a cost-effective, safe and portable method to induce surface waves. Phantoms were made out of different concentrations of agar solution and different layer thickness to simulate the elastic properties typically found in skin. The generated surface waves from the skin and phantom were detected by a PhS-OCT system. Dispersion phase-velocity curves were calculated to obtain the elastic properties from well-defined layers that exhibit different mechanical properties.
2. Brief theoretical background
When a material is stimulated with an impulse, mechanical pressure waves are generated, which propagate within the material. Among these waves, surface waves, which are dominated by Rayleigh waves, have been widely used to characterize the elastic properties of different kinds of materials [23–26]. The propagation of surface waves in a heterogeneous medium (i.e. layered materials) show a dispersive behaviour [27], where the different frequency components have different phase velocities. The phase velocity at each frequency is dependent on the elastic and geometric properties of the material at different depths [27]. In isotropic homogeneous materials, the surface wave phase velocity can be approximated as [27–30]:
 |
2.1 |
where E is the Young modulus, ν is the Poisson's ratio and ρ is the density of the material.
For a multi-layer medium, in which each layer has different elastic properties, the phase velocity of the surface wave is influenced by the mechanical properties of all the layers it penetrates. The elastic properties that affect the phase-velocity dispersion curve include not only the Young modulus, the Poisson's ratio and the density of each layer, but also the thickness of each layer. The surface waves with shorter wavelengths (higher frequency) penetrate shallow depths with the phase velocity depending on the superficial layers. The surface waves with longer wavelengths (lower frequency) penetrate deeper into the material, and the phase velocity tends to be mostly influenced by the elastic properties of the deeper layers.
In general, the maximum frequency of a surface wave signal is related to the phase velocity of the material [31]:
 |
2.2 |
where r0 is the radius of the stimulator and CR is the velocity of the Rayleigh wave. A property of surface waves is that the depth of the wave motion is proportional to the wavelength. The probing depth can be estimated by the following relation [32]:
| 2.3 |
where f is the corresponding frequency content.
3. System configuration and sample preparation
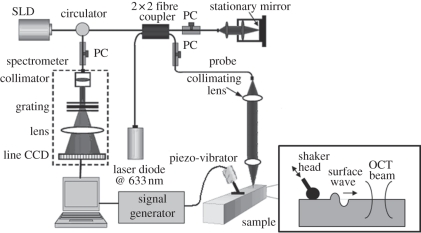
The system set-up for generation and detection of shaker-induced surface waves in soft tissue is shown in figure 1.
Figure 1.
System set-up of surface wave generation and detection. The inset presents a side view description of the stimulation and detection of the surface wave.
3.1. Surface wave generation induced by a shaker
A home-made shaker was used as the mechanical impulse stimulator, which included a signal generator, and a single-element piezoelectric ceramic with a metal rod (length of approx. 20 mm and diameter of approx. 2 mm) connected in the end as the shaker head. To stimulate the surface wave on the sample surface, the metal rod was directly in touch with the sample to transmit the vibration from the piezoelectric ceramic. The stimulus was applied with an approximately 45° angle over the tissue surface, which provided equal longitudinal and shear energy to the sample. Compared with a point and a round source, the line source (provided by the metal rod) improved the SNR, and reduced the attenuation of the surface wave, which enabled the surface wave to propagate longer distances [33–35]. The shaker applied a tissue displacement of approximately 100 nm in the axial direction. The tissue displacement was proportional to the surface wave amplitude; however, the shape and the velocity remained constant.
The frequency range of the surface waves was determined by using equation (2.2). In our previous study, it was demonstrated that the phase velocity for an approximately 3.5 per cent single-layer agar phantom is approximately 13 m s−1; which contains a maximum frequency component of approximately 10 kHz [36]. To analyse all the frequencies from the surface waves, the shaker is required to generate a pulse with a short duration, and the detector is required to sample at more than twice the maximum frequency component to meet the Nyquist–Shannon sampling theorem. For this study, we used an external trigger to control the shaker, which generated pulses of approximately 20 Hz with an approximately 0.2 per cent duty cycle; producing frequencies up to approximately 10 kHz. The sampling rate of the PhS-OCT system was determined by the InGaAs line scan camera (shown in figure 1), which was approximately 47 kHz (greater than the 20 kHz required by the Nyquist–Shannon theorem).
3.2. Detection of surface wave by phase-sensitive optical coherence tomography
Detection of the shaker-induced surface wave was performed using a PhS-OCT system. The OCT imaging system can provide the structural image of the samples as a function of depth, i.e. the thickness of each layer. This system allows imaging of the tissue inner layer structures as well as providing the elastic properties of the tissue simultaneously.
The PhS-OCT system employed a spectral-domain OCT (SD-OCT) system [36] with a centre wavelength of approximately 1310 nm and a bandwidth of approximately 46 nm from a superluminecent diode (SLD, DenseLight Semiconductors Ltd) as the light source. It provided an axial resolution of approximately 15 µm in air (approx. 10 µm within the skin, assuming the refractive index is approx. 1.4). Via an optical circulator, the light from the SLD broadband light source was split into two paths in a 50/50 fibre-based Michelson interferometer. One beam was coupled onto a stationary reference mirror and the second was focused onto the sample via an objective lens. The focal length of the objective lens was approximately 50 mm to provide a transverse resolution of approximately 18 µm.
The coupler recombined the backscattered light from the sample arm and the reflected light from the reference arm into a home-made, high-speed spectrometer via the optical circulator. The interference light was then coupled into a fast spectrometer equipped with a 14-bit, 1024 pixel InGaAs line scan camera with a maximum acquisition rate of approximately 47 kHz. A computer was used to synchronously control the acquisition of the camera and the impulse excitation of the shaker. In this study, we triggered the shaker and camera at the same time.
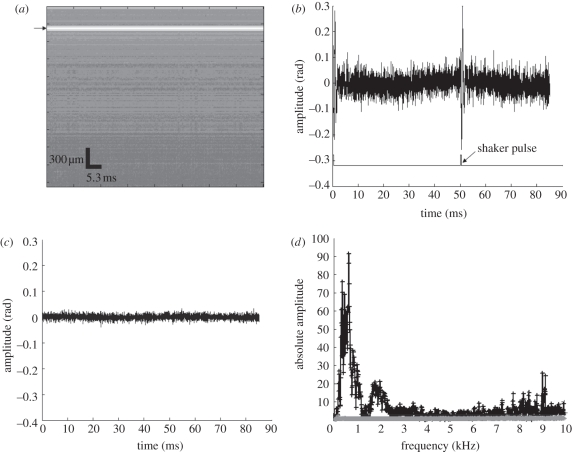
At each detection location, we acquired 4000-lines over time at a sampling frequency of 47 kHz, also known as an M-mode acquisition. Since the shaker stimulus had a frequency of approximately 20 Hz, the system was able to detect two phase changes (bottom line in figure 2b) with a time gap of approximately 50 ms. An example of the M-mode image of a phantom obtained with the OCT system can be observed in figure 2a. Figure 2b shows the phase change observed at the surface of the sample from a typical 1 per cent agar phantom (arrow in figure 2a).
Figure 2.
(a) Amplitude data of M-mode PhS-OCT image at the detection point (black arrow points the surface data selected to analyse the phase change), (b) phase change of the surface wave signal and waveform of the shaker pulses on a 1% agar phantom, (c) phase change of the detected system noise and (d) frequency contribution of the system noise (c) and the detected surface wave signal (b). (d) Asterisks with solid line, frequency contribution of system noise; vertical bars with solid line, frequency contribution of typical surface wave signal.
To determine the system noise, we collected data from the stage surface when no sample was present (figure 2c). The system noise detected from the sample stage was much lower than the detected surface wave signal; and its frequency contribution was negligible as observed in figure 2d. The measured SNR at a 0.5 mm axial depth position was approximately 100 dB [13,36].
To calculate the dispersion curves of the shaker-induced surface waves, several detecting locations with known separations are required. The shaker head needs to be in contact with the sample surface to generate the surface waves. To maintain the stability of the generated surface waves, we mounted the shaker and the sample (shown in figure 1) on a translation stage. During the experiment, we moved the PhS-OCT sample beam to different detecting locations, while maintaining the shaker head at a fixed location.
Surface wave displacements were calculated using:
| 3.1 |
where Δφ is the detected phase change, λ is the central wavelength of the PhS-OCT system (1310 nm) and n is the index of refraction of the sample (approx. 1.35).
3.3. Sample preparation
Seven single- and double-layer agar–agar phantoms were prepared, to simulate soft tissues (table 1). A higher agar concentration produces stiffer gels with higher Young's modulus. The Young modulus of 1, 2 and 3 per cent agar are similar to subcutaneous fat layer, dermis and epidermis, respectively [1,3,20,37–39]. Homogeneous single-layer phantoms were prepared with agar concentrations of approximately 1, 2 and 3 per cent and their phase velocities were determined. Then, double-layer phantoms were prepared with approximately 1 over 2 per cent agar and approximately 3 over 2 per cent agar, to validate our method of evaluating the elasticity of layered materials, such as skin. For both of these double-layer phantoms, an approximately 1 mm and an approximately 2 mm upper layer thickness were produced to study the influence of the top layer thickness over the phase-velocity curve. The single-layer phantom and the bottom layer of the double-layer phantom had a thickness of approximately 10 mm, which was considered semi-infinite for this application and should not affect the results. To improve the scattering coefficient of the tissue-mimicking phantoms, several drops of milk were mixed with the agar solution.
Table 1.
Phantoms produced for this study.
| top layer agar concentration (%) | bottom layer agar concentration (%) | top layer thickness (mm) | |
|---|---|---|---|
| single layer | 1 | — | — |
| 2 | — | — | |
| 3 | — | — | |
| double layer | 1 | 2 | 1 |
| 1 | 2 | 2 | |
| 3 | 2 | 1 | |
| 3 | 2 | 2 |
In vivo experiments were carried on five healthy human volunteers with an age span between 25 and 45 years old. The in vivo experiments were undertaken under room temperature and humidity. Measurements were obtained from two skin sites, the forearm and the palm.
4. Signal processing of surface wave phase-velocity dispersion curve
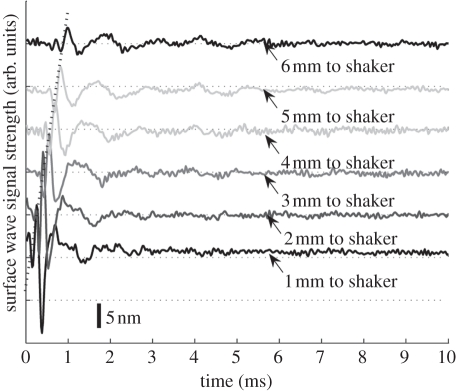
The surface wave signals were recorded on each sample surface at different spatial locations with the same step length. For each location on the sample surface, six measurements were made and their average was high-pass filtered to reduce the DC noise. The signal's noise was minimized by using a Hilbert–Huang method that reduces the high-frequency random noise [40]. The phase-velocity dispersion curve between two measured surface wave signals, y1(t) and y2(t) corresponding to locations x1 and x2, respectively, was analysed. The typical y(t) is observed in figures 3, 6, 9 and 10. The phase difference Δφ between the surface wave signals y1(t) and y2(t) was calculated by determining the phase of the cross-power spectrum Y12(f):
| 4.1 |
where Y1(f) and Y2(f) are the Fourier transformations of y1(t) and y2(t), A1 and A2 are the amplitude of cross-power spectrum, and Δφ = φ1 − φ2 is the phase difference of the measured signals y1(t) and y2(t), respectively. When the propagation wave has a wavelength equal to the distance Δx, the measured phase difference is 2π. In general, the ratio between the phase difference and 2π equals to the ratio of the detection distance and the wavelength:
| 4.2 |
Figure 3.
Surface wave signals of a single layer 2% phantom at a distance of 1 mm (bottom) to 6 mm (top) from the shaker head, with 1 mm per step. Each surface wave signal is purposely shifted vertically by equal distance in order to better illustrate the results captured from different positions. The bar indicates the estimated displacement of the surface wave. The same also applies to figures 6, 8 and 9. The horizontal dotted lines indicate the baseline.
Figure 6.
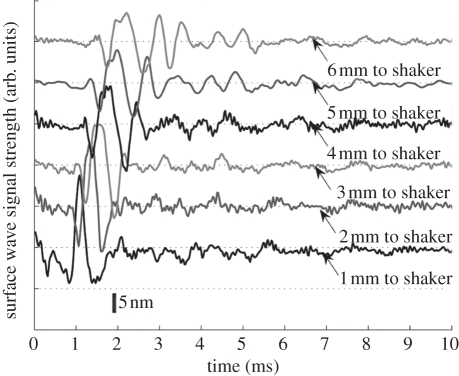
Surface wave signal from a 1 mm 1% layer over a 2% substrate at a distance of 1 mm (bottom) to 6 mm (top) from the shaker head, with 1 mm per step.
Figure 9.
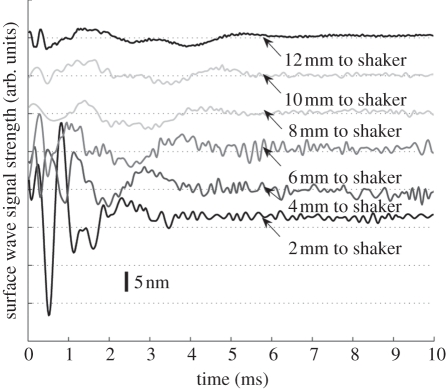
Typical surface wave signals from in vivo human forearm skin between 2 and 12 mm away from the shaker head, in 2 mm steps.
Figure 10.
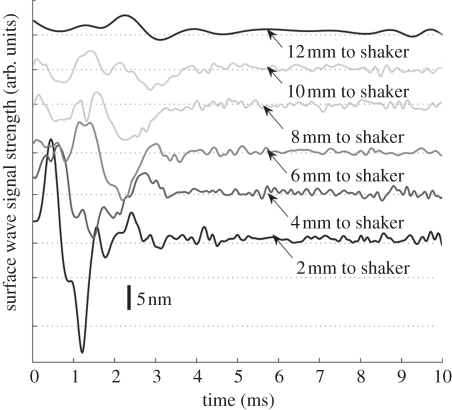
Typical surface wave signals from in vivo human palm skin between 2 and 12 mm away from to the shaker head, in 2 mm steps.
Also, the phase velocity and frequency are related by:
| 4.3 |
Both the autocorrelation spectrum and the phase-velocity dispersion curves are the key parameters for our analyses, as the former provides the available frequency range of the signals, while the latter provides the elastic and structural information of the samples. The cut-off frequency for the surface waves has been defined at −20 dB from the maximum of the autocorrelation spectrum, where the uncertainty of the dispersion curves are increased [32].The final phase-velocity dispersion curve was determined by averaging all the phase velocities between two detection points.
5. Experimental results
5.1. Surface waves on single-layer phantoms
Figure 3 shows the typical surface waves recorded from a single-layer 2 per cent phantom. The PhS-OCT sample beam was located at 1, 2, 3, 4, 5 and 6 mm away from the shaker head. Figure 3 demonstrates that the surface wave is moving away from the shaker-excitation position because the arrival time of the surface wave is longer as the detector is located farther away (diagonal line in figure 3). Since the sample was a single-layer homogeneous phantom, no velocity-dispersion was found in the detected waveforms. However, the waveform was attenuated with increasing distance from the shaker. Although there were two surface waves detected at each position in the experiment, since the shaker applies two pulses per experiment, only the results from the first surface wave are presented. Similar results were obtained from the second surface wave.
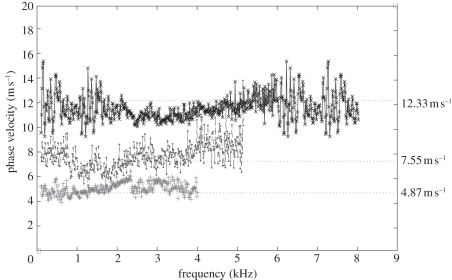
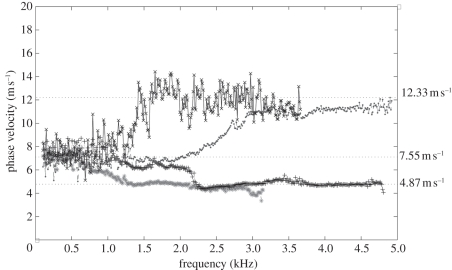
The averaged phase-velocity dispersion curves of all single-layer phantoms are plotted in figure 4. All the curves exhibit a constant value for all frequencies, which is expected for a single-layer homogeneous sample. The average phase velocities measured from the curves were approximately 12.33 ± 1.03, 7.55 ± 1.09 and 4.87 ± 0.94 m s−1, which yields a Young modulus of approximately 515 ± 3.59, 193 ± 4.01 and 80 ± 2.99 kPa for the 3 per cent, 2 per cent and 1 per cent phantoms, respectively. The Young modulus was calculated with equation (2.1) by using a Poisson ratio of approximately 0.47 and a density of approximately 1040 kg m3 [22]. As expected, the higher concentration of agar exhibits higher phase velocity owing to its higher Young's modulus.
Figure 4.
Phase-velocity dispersion curves of 1%, 2% and 3% phantoms. Plus symbols with solid line, 1% agar–agar phantom phase velocity; circles with dashed line, 2% agar–agar phantom phase velocity; crosses with solid line, 3% agar–agar phantom phase velocity.
In addition, the maximum frequency content of the shaker-generated surface waves was increased with increase in agar concentration. The cut-off frequency was selected when the intensity of the power spectrum dropped 20 dB below its maximum. Thus, the maximum frequency content for the 1, 2 and 3 per cent phantoms was approximately 4, 5.5 and 8.3 kHz, respectively. These values were lower than the theoretical maximum frequency content calculated from equation (2.2) (approx. 4.37, 6.5 and 9.5 kHz for the 1%, 2% and 3%, respectively) because the maximum frequency content might exceed −20 dB cut-off of the power spectrum.
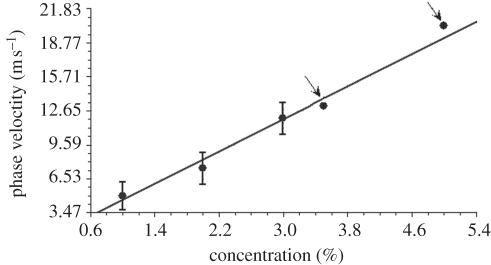
In figure 5, we observe the phase velocity as a function of the agar concentration. We also included two data points from our prior publication [22], which uses laser-induced SAW instead of the shaker (pointed by arrow). The phase velocity of each agar sample increased linearly with increase in the agar concentration.
Figure 5.
Phase velocity as a function of single-layer homogeneous agar phantom concentration. The black arrows indicate the values extracted from the previous study [22].
5.2. Surface waves on double-layer phantoms
Figure 6 shows the typical surface waves obtained from double-layer agar–agar phantom, with 2 per cent agar as the substrate layer and 1 per cent agar as the superficial layer with a thickness of 1 mm. The detecting points were varied from 1 to 6 mm away from the shaker in 1 mm increments. As the wave propagates along the surface of the phantom, the wave disperses owing to the heterogeneous environment.
The phase-velocity dispersion curves of the four double-layer phantoms are presented in figure 7. It can be observed that the phase-velocity dispersion curves are not constant for all frequencies. The initial phase velocity of these double-layer phantoms has a value of approximately 7.5 m s−1, which matches the value from the single-layer 2 per cent phantom. This is expected since all the double-layer phantoms have a 2 per cent agar phantom as the substrate. However, as the frequency increases, the phase velocity changes owing to the influence of the upper layer. The phase velocity increased to approximately 12.5 m s−1 when the top layer had a 3 per cent agar concentration, and was reduced to approximately 4.80 m s−1 when the top layer had a 1 per cent concentration. These results agree with the theoretical expectations, where the phase velocity at lower frequencies indicates the mechanical properties of deeper tissue layers, while the phase velocity at higher frequencies indicates the mechanical properties of the superficial layers.
Figure 7.
Comparison of phase-velocity dispersion curves between double-layer phantoms with different upper layer thickness and agar concentration. Asterisks with dashed line, 2 mm 1% agar layer on 2% agar phantom; plus symbols with dotted line, 1 mm 1% agar layer on 2% agar phantom; circles with dashed line, 1 mm 3% agar layer on 2% agar phantom; crosses with solid line, 2 mm 3% agar layer on 2% agar phantom.
The frequency, at which the phase velocity changed, is dependent on the thickness of the superficial layer. Thicker layers change the phase velocity at lower frequencies. The 2 mm top layer phantom saturates at frequencies greater than approximately 1.5 kHz, while the 1 mm top layer phantoms saturates at approximately 2.2–2.8 kHz. Notice that the 2 mm 3 per cent agar layer on 2 per cent agar phantom was noisier than the other three curves. We believe this was because the scattering coefficient in that phantom was lower than the other phantoms (fewer drops of milk were added into the agar solution), which would lead to weaker OCT signal values, and thus higher inaccuracy in the phase estimation [20,36].
5.3. Surface waves on in vivo human skin
5.3.1. Mechanical properties of human skin
Skin can be roughly classified into three distinct layers: the epidermis, dermis and subcutaneous fat [37]. The epidermis layer is the most superficial layer, has a thickness of approximately 0.1 mm [37], and has the highest Young modulus (approx. 1 MPa) compared with the other skin layers [38]. The thickness of the dermis layer is about approximately 1 mm and its Young's modulus is much lower compared with the epidermis (from approx. 88 to 300 kPa) [1,20,39]. The subcutaneous fat layer is the deepest skin layer with the largest thickness (above 1.2 mm) and the lowest stiffness (around 34 kPa) [37,39] among all the skin layers.
5.3.2. Measurements and results
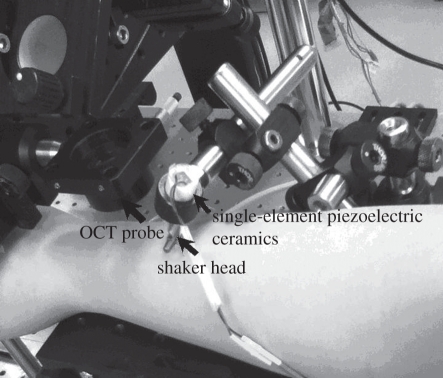
The measurement set-up and the analysis procedures were the same as described for the phantom experiments. Figure 8 shows a photograph taken when the measurement was done on the skin of a human forearm. The subjects were asked to keep the arm (palm) stable during the six measurements (6 × 85 ms). A full experiment lasted less than 5 min. The shaker head was gently pressed over the skin, and no discomfort was felt by the subject.
Figure 8.
Experimental set-up for measuring a human forearm.
Figures 9 and 10 show the typical surface wave from in vivo human skin for the forearm and palm, respectively. The detection points were varied from 2 to 12 mm away from the shaker head in 2 mm increments. The surface wave signal on the human skin attenuated faster than in the phantoms, which may be due to the high viscosity and the influence of the micro-vasculature under the skin.
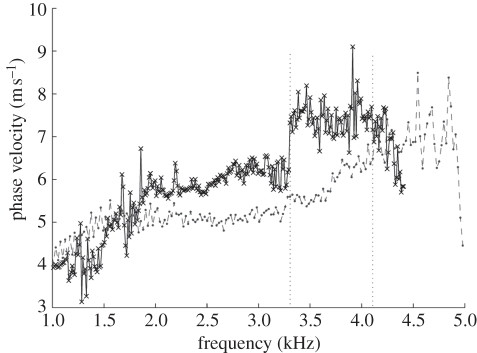
The phase-velocity dispersion curves of the palm and forearm from one subject are plotted in figure 11. Note that the phase-velocity curves begin from approximately 1 kHz in human skin studies compared with approximately 0.1 kHz in the phantom studies. This is because the human subjects are less stable than the phantoms, resulting in higher noise at lower frequencies. Based on the −20 dB rule mentioned in §4, the cut-off frequency was set at approximately 1 kHz. The value of the phase velocity in the low frequency for both the palm and the forearm is similar. At 1 kHz, the phase velocity represents the subcutaneous fat layer, with a value of approximately 4 m s−1. The phase velocity reaches a plateau of approximately 7 m s−1 at approximately 4.15 kHz in the forearm and approximately 7.5 m s−1 at 3.3 kHz in the palm (the plateau is marked with vertical dotted lines in figure 11). The plateau value was selected when the value of the phase-velocity curve reached 95 per cent of the maximum value after smoothing the curve. These values indicate that the Young modulus of the dermis of the palm is higher than that of the forearm, and the palm dermis layer is thicker than that of the forearm owing to the phase-velocity curve reaching saturation at a lower frequency.
Figure 11.
Comparison of phase-velocity dispersion curves between palm and forearm (dot line shows the beginning frequency content of dermis layer). Crosses with solid line, palm phase velocity; circles with dashed line, forearm phase velocity.
The phase-velocity curve shows that the skin model is similar to the double-layer phantom with 1 mm 3 per cent agar layer on top of the 2 per cent agar phantom. Although, our system cannot obtain the Young modulus of the epidermis, because a high surface wave frequency content is required to measure superficial and thin layers, this study is important since most skin diseases are related to the mechanical properties of the dermis layer. We estimate that to measure the mechanical properties of the epidermis, the shaker pulse will require a frequency of 20 kHz, and the PhS-OCT system will require a sampling rate of approximately 100 kHz, which is higher than the current system (approx. 47 kHz).
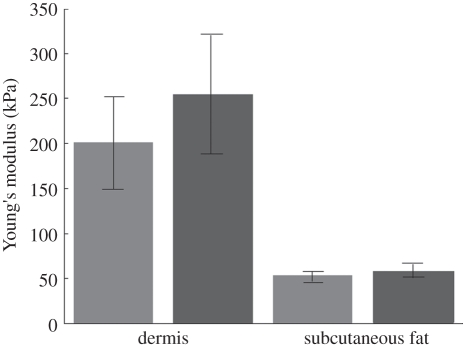
From the experiments above, the measured phase velocities for the palm and forearm skin of all the five subjects are summarized in table 2. To calculate the Young modulus, we chose the phase-velocity value at 1 kHz for the fat layer, and the phase velocity of the plateau for the dermis layer. Based on previous studies, we can assume that the Poisson ratio of the human skin tissue is approximately 0.48. We used approximately 1116 kg m−3 as the dermis density and approximately 971 kg m−3 as the subcutaneous fat density [24]. Therefore, with these measured phase-velocity values, we can calculate the Young modulus according to equation (2.1). The results are in good agreement with the literature [1,3,14,16,33,35]. Figure 12 presents the average and standard deviations of the calculated Young modulus from five subjects.
Table 2.
The phase velocity (averaged) and estimated Young's modulus of five subjects in palm and forearm.
| subject | dermis phase velocity (m s−1) |
dermis Young's modulus (kPa) |
subcutaneous fat phase velocity (m s−1) |
subcutaneous fat Young's modulus (kPa) |
||||
|---|---|---|---|---|---|---|---|---|
| forearm | palm | forearm | palm | forearm | palm | forearm | palm | |
| 1 | 7.02 ± 1.14 | 7.50 ± 0.55 | 180.38 ± 4.76 | 205.89 ± 1.11 | 4.00 ± 0.38 | 4.25 ± 0.69 | 50.95 ± 0.46 | 57.52 ± 1.51 |
| 2 | 6.45 ± 0.87 | 7.94 ± 0.52 | 152.27 ± 2.77 | 230.75 ± 0.99 | 3.92 ± 0.27 | 4.05 ± 0.81 | 48.93 ± 0.23 | 52.23 ± 2.09 |
| 3 | 7.37 ± 0.93 | 8.29 ± 0.61 | 198.81 ± 3.17 | 251.55 ± 1.36 | 4.18 ± 0.41 | 4.38 ± 0.78 | 55.64 ± 0.54 | 61.09 ± 1.94 |
| 4 | 7.24 ± 0.61 | 7.69 ± 0.48 | 191.86 ± 1.36 | 216.45 ± 0.84 | 4.25 ± 0.35 | 4.56 ± 0.64 | 57.52 ± 0.39 | 66.22 ± 1.30 |
| 5 | 8.85 ± 0.79 | 10.02 ± 0.51 | 286.68 ± 2.28 | 368.22 ± 0.98 | 4.17 ± 0.55 | 4.03 ± 0.73 | 55.37 ± 0.96 | 51.72 ± 1.69 |
Figure 12.
Average Young's modulus from five subjects. The error bars denote standard deviation. Light grey bars, forearm Young's modulus; dark grey bars, palm Young's modulus.
Although the current system is capable of evaluating the Young modulus from different layers of skin, there are some limitations. The skin layer boundaries are not flat surfaces and the tissue microstructures (such as blood vessels) are ignored. Therefore, there is higher uncertainty in distinguishing the frequency contents at each layer in the phase-velocity curve. The Young moduli presented in table 2 are estimates obtained from averaged phase-velocity values, using values for the Poisson ratio and density that were found in the literature. However, the standard deviations of the phase velocities were less than 1 m s−1 and of the Young modulus were less than 2.5 kPa, which is small compared with the expected stiffness changes that are found in skin diseases, e.g. basal cell carcinoma tumours are 3–50% stiffer compared with healthy skin [4,16,41].
6. Conclusion
We have presented a technique that combines an inexpensive mechanical impulse response with a PhS-OCT detector to characterize the mechanical properties of the tissue-mimicking phantoms and in vivo human skin. We used a home-made shaker with a line shaker head to generate surface waves. By calculating and analysing the phase-velocity curves from the detected surface wave signals, we could evaluate the elastic properties of different layers. We have shown that the experimental results are in good agreement with the literature. This study proves the feasibility of using surface waves for evaluating elastic properties of layered soft solid materials and soft biological tissues.
The phantoms and in vivo human skin experiments demonstrate that the surface wave method could be applicable in clinical settings, because the system is sensitive to the elastic and geometry changes of a sample in the axial direction. Since most skin diseases result in changes of the elastic properties and/or thickness of the affected skin layer, this will cause changes to the phase-velocity curve, which can be detected by our system. The current system may have potential in diagnosing diseases of the dermis layer, such as level II skin cancer (including malignant melanoma, squamous cell carcinoma and basal cell carcinoma) and scleroderma.
There are several straightforward studies and developments that would be logical next steps. A higher speed PhS-OCT system is required to obtain the higher frequency content of the shaker-generated surface wave, such that the elasticity information from the epidermis layer of skin can be characterized. Higher data processing speed is also required to provide results in real-time. Such approaches could have several medical applications, such as characterizing the mechanical properties of skin tissues to aid in the early diagnosis and the treatment of skin diseases, e.g. cancer. It will also be beneficial to understand the influence of skin location and hydration in the determination of the tissue mechanical properties.
Acknowledgements
The authors would like to thank Dr Guozhong Liu, Dr Peng Li, Dr Xusheng Zhang and Prof. Yi Wang for their laboratory assistance.
References
- 1.Gennisson J., Baldeweck T., Tanter M., Catheline M. S., Fink M., Sandrin L., Cornillon C., Querleux B. 2004. Assessment of elastic parameters of human skin using dynamic elastography. IEEE Trans. Ultrason. Ferroelectr. Freq. Control 51, 908–989 [DOI] [PubMed] [Google Scholar]
- 2.Agache P. G., Monneur C., Leveque J. L., De Regal J. 1980. Mechanical properties and Young's modulus of human skin in vivo. Arch. Dermatol. Res. 269, 221–232 10.1007/BF00406415 (doi:10.1007/BF00406415) [DOI] [PubMed] [Google Scholar]
- 3.Zhang X., Kinnick R. R., Pittelkow M. R., Greenleaf J. F. 2008. Skin viscoelasticity with surface wave method. In IEEE Int. Ultrasonics Symp. Proc. 2–5 November, Beijing, China, pp. 651–653. Piscataway, NJ: IEEE 10.1109/ULTSYM.2008.0156 (doi:10.1109/ULTSYM.2008.0156) [DOI] [Google Scholar]
- 4.Tilleman T. R., Tilleman M. M., Neumann M. 2004. The elastic properties of cancerous skin: Poisson's ratio and Young's modulus. Isr. Med. Assoc. J. 6, 753–755 [PubMed] [Google Scholar]
- 5.Nakajima M., Kiyohara Y., Shimizu M., Kobayashi M. 2007. Clinical application of real-time tissue elastography on skin lesions. MEDIX Supplement, pp. 36–39. Tokyo, Japan: Hitachi Medical Corporation. See http://www.hitachi-medical.co.jp/medix/pdf_sup/sup_10.pdf [Google Scholar]
- 6.Kirkpatrick S. J., Wang R. K. 2006. Imaging the mechanical stiffness of skin lesions by in vivo acousto-optical elastography. Opt. Express 14, 9770–9779 10.1364/OE.14.009770 (doi:10.1364/OE.14.009770) [DOI] [PubMed] [Google Scholar]
- 7.Sarvazyan A. P., Rudenko O. V., Swanson S. D., Fowlkes J. B., Emelianov S. Y. 1998. Shear wave elasticity imaging: a new ultrasonic technology of medical diagnostics. Ultrasound Med. Biol. 24, 1419–1435 10.1016/S0301-5629(98)00110-0 (doi:10.1016/S0301-5629(98)00110-0) [DOI] [PubMed] [Google Scholar]
- 8.Ophir J., Cespedes I., Ponnekanti H., Yazdi Y., Li X. 1991. Elastography: a quantitative method for imaging the elasticity of biological tissues. Ultrason. Imaging 13, 111–134 10.1016/0161-7346(91)90079-W (doi:10.1016/0161-7346(91)90079-W) [DOI] [PubMed] [Google Scholar]
- 9.Schmitt J. M. 1998. OCT elastography: imaging microscopic deformation and strain of tissue. Opt. Express 3, 199–211 10.1364/OE.3.000199 (doi:10.1364/OE.3.000199) [DOI] [PubMed] [Google Scholar]
- 10.Chan R. C., et al. 2004. OCT-based arterial elastography: robust estimation exploiting tissue biomechanics. Opt. Express 12, 4558–4572 10.1364/OPEX.12.004558 (doi:10.1364/OPEX.12.004558) [DOI] [PubMed] [Google Scholar]
- 11.Rogowska J., Patel N. A., Fujimoto J. G., Brezinski M. E. 2004. Optical coherence tomographic elastography technique for measuring deformation and strain of atherosclerotic tissues. Heart 90, 556–562 10.1136/hrt.2003.016956 (doi:10.1136/hrt.2003.016956) [DOI] [PMC free article] [PubMed] [Google Scholar]
- 12.Ko H. J., Tan W., Stack R., Boppart S. A. 2006. Optical coherence elastography of engineered and developing tissue. Tissue Eng. 12, 63–73 10.1089/ten.2006.12.63 (doi:10.1089/ten.2006.12.63) [DOI] [PubMed] [Google Scholar]
- 13.Wang R. K., Ma Z. H., Kirkpatrick S. J. 2006. Tissue Doppler optical coherence elastography for real time strain rate and strain mapping of soft tissue. Appl. Phys. Lett. 89, 144103. 10.1063/1.2357854 (doi:10.1063/1.2357854) [DOI] [Google Scholar]
- 14.Kirkpatrick S. J., Wang R. K., Duncan D. D. 2006. OCT-based elastography for large and small deformations. Opt. Express 14, 11 585–11 597 10.1364/OE.14.011585 (doi:10.1364/OE.14.011585) [DOI] [PubMed] [Google Scholar]
- 15.Liang X., Oldenburg A. L., Crecea V., Chaney E. J., Boppart S. A. 2008. Optical micro-scale mapping of dynamic biomechanical tissue properties. Opt. Express 16, 11 052–11 065 10.1364/OE.16.011052 (doi:10.1364/OE.16.011052) [DOI] [PMC free article] [PubMed] [Google Scholar]
- 16.Kennedy B. F., Hillman T. R., McLaughlin R. A., Quirk B. C., Sampson D. D. 2009. In vivo dynamic optical coherence elastography using a ring actuator. Opt. Express 17, 21 762–21 772 10.1364/OE.17.021762 (doi:10.1364/OE.17.021762) [DOI] [PubMed] [Google Scholar]
- 17.Kennedy B. F., Liang X., Adie S. G., Gerstmann D. K., Quirk B. C., Boppart S. A., Sampson D. D. 2011. In vivo three-dimensional optical coherence elastography. Opt. Express 19, 6623–6634 10.1364/OE.19.006623 (doi:10.1364/OE.19.006623) [DOI] [PMC free article] [PubMed] [Google Scholar]
- 18.Liang X., Graf B. W., Boppart S. A. 2011. In vivo multiphoton microscopy for investigating biomechanical properties of human skin. Cell. Mol. Bioeng. 4, 231–238 10.1007/s12195-010-0147-6 (doi:10.1007/s12195-010-0147-6) [DOI] [PMC free article] [PubMed] [Google Scholar]
- 19.Grimwood A., Garcia L., Bamber J., Holmes J., Woolliams P., Tomlins P., Pankhurst Q. A. 2010. Elastographic contrast generation in optical coherence tomography from a localized shear stress. Phys. Med. Biol. 55, 5515–5528 10.1088/0031-9155/55/18/016 (doi:10.1088/0031-9155/55/18/016) [DOI] [PubMed] [Google Scholar]
- 20.Liang X., Boppart S. A. 2010. Biomechanical properties of in vivo human skin from dynamic optical coherence elastography. IEEE Trans. Biomed. Eng. 57, 953–959 10.1109/TBME.2009.2033464 (doi:10.1109/TBME.2009.2033464) [DOI] [PMC free article] [PubMed] [Google Scholar]
- 21.Qiang B., Greenleaf J., Zhang X. 2010. Quantifying viscoelasticity of gelatin phantoms by measuring impulse response using compact optical sensors. IEEE Trans. Ultrason. Ferroelectr. Freq. Control 57, 1696–1700 10.1109/TUFFC.2010.1600 (doi:10.1109/TUFFC.2010.1600) [DOI] [PubMed] [Google Scholar]
- 22.Li C., Huang Z., Wang R. K. 2011. Elastic properties of soft tissue-mimicking phantoms assessed by combined use of laser ultrasonics and low coherence interferometry. Opt. Express 19, 10 153–10 163 10.1364/OE.19.010153 (doi:10.1364/OE.19.010153) [DOI] [PubMed] [Google Scholar]
- 23.Kundu T. 2004. Ultrasonic nondestructive evaluation: engineering and biological material characterization. Boca Raton, FL: CRC Press. [Google Scholar]
- 24.Schneider D., Schultrich B., Scheibe H. J., Ziegele H., Griepentrog M. 1998. A laser-acoustic method for testing and classifying hard surface layers. Thin Solid Films 332, 157–163 10.1016/S0040-6090(98)00988-2 (doi:10.1016/S0040-6090(98)00988-2) [DOI] [Google Scholar]
- 25.Glorieux C., Gao W., Kruger S. E., Van de Rostyne K., Lauriks W., Thoen J. 2000. Surface acoustic wave depth profiling of elastically inhomogeneous materials. J. Appl. Phys. 88, 4394–4400 10.1063/1.1290457 (doi:10.1063/1.1290457) [DOI] [Google Scholar]
- 26.Rogers J. A., Maznev A. A., Banet M. J., Nelson K. A. 2000. Optical generation and characterization of acoustic waves in thin films: fundamentals and applications. Annu. Rev. Mater. Sci. 30, 117–157 10.1146/annurev.matsci.30.1.117 (doi:10.1146/annurev.matsci.30.1.117) [DOI] [Google Scholar]
- 27.Lee Y. C., Kim J. O., Achenbach J. D. 1993. Measurement of elastic constants and mass density by acoustic microscopy. IEEE Ultrason. Symp. 1, 607–612 [Google Scholar]
- 28.Scruby C. S., Drain L. E. Laser ultrasonics: techniques and applications. 1990. [Google Scholar]
- 29.Neubrand A., Hess P. 1992. Laser generation and detection of surface acoustic waves: elastic properties of surface layers. J. Appl. Phys. 71, 227–238 10.1063/1.350747 (doi:10.1063/1.350747) [DOI] [Google Scholar]
- 30.Schneider D., Schwarz T. A. 1997. Photoacoustic method for characterising thin films. Surf. Coat. Tech. l91, 136–146 10.1016/S0257-8972(96)03147-7 (doi:10.1016/S0257-8972(96)03147-7) [DOI] [Google Scholar]
- 31.Sohn Y., Krishnaswamy S. 2002. Mass spring lattice modeling of the scanning laser source technique. Ultrasonics 39, 543–551 10.1016/S0041-624X(02)00250-0 (doi:10.1016/S0041-624X(02)00250-0) [DOI] [PubMed] [Google Scholar]
- 32.Wang H. C., Fleming S., Lee Y. C., Law S., Swain M., Xue J. 2009. Laser ultrasonic surface wave dispersion technique for non-destructive evaluation of human dental enamel. Opt. Express 17, 15 592–15 607 10.1364/OE.17.015592 (doi:10.1364/OE.17.015592) [DOI] [PubMed] [Google Scholar]
- 33.Hurley D. H., Spicer J. B. 2004. Line source representation for laser-generated ultrasound in an elastic transversely isotropic half-space. J. Acoust. Soc. Am. 116, 2914–2922 10.1121/1.1791721 (doi:10.1121/1.1791721) [DOI] [Google Scholar]
- 34.Doyle P. A., Scala C. M. 1996. Near-field ultrasonic Rayleigh waves from a laser line source. Ultrasonics 34, 1–8 10.1016/0041-624X(95)00089-L (doi:10.1016/0041-624X(95)00089-L) [DOI] [Google Scholar]
- 35.Kenderian S., Djordjevic B. B., Green R. E., Jr 2001. Point and line source laser generation of ultrasound for inspection of internal and surface flaws in rail and structural materials. Res. Nondestr. Eval. 13, 189–200 [Google Scholar]
- 36.Wang R. K., Nuttall A. L. 2010. Phase-sensitive optical coherence tomography imaging of the tissue motion within the organ of Corti at a sub-nanometer scale: a preliminary study. J. Biomed. Opt. 15, 1–9 [DOI] [PMC free article] [PubMed] [Google Scholar]
- 37.Xua F., Wena T., Lub T. J., Seffena K. A. 2008. Skin biothermomechanics for medical treatments. J. Mech. Behav. Biomech. Mater. 1, 172–187 10.1016/j.jmbbm.2007.09.001 (doi:10.1016/j.jmbbm.2007.09.001) [DOI] [PubMed] [Google Scholar]
- 38.Geerligs M., Breemenb L., Peters G., Ackermans P., Baaijens F., Oomens C. 2011. In vitro indentation to determine the mechanical properties of epidermis. J. Biomech. 44, 1176–1181 10.1016/j.jbiomech.2011.01.015 (doi:10.1016/j.jbiomech.2011.01.015) [DOI] [PubMed] [Google Scholar]
- 39.L'Etang A., Huang Z. Y. 2006. FE simulation of laser generated surface acoustic wave propagation in skin. Ultrasonics 44, e1243–e1247 10.1016/j.ultras.2006.05.077 (doi:10.1016/j.ultras.2006.05.077) [DOI] [PubMed] [Google Scholar]
- 40.Sun W., Peng Y., Xu J. 2008. A de-noising method for laser ultrasonic signal based on EMD. J. Sandong Univ. 38, 1–6 [Google Scholar]
- 41.Krehbiel J. D., Lambros J., Viator J. A., Sottos N. R. 2008. Digital image correlation for improved detection of basal cell carcinoma. Exp. Mech. 50, 813–824 10.1007/s11340-009-9324-8 (doi:10.1007/s11340-009-9324-8) [DOI] [Google Scholar]


