

Abstract
Climate warming over the next century is expected to have a large impact on the interactions between pathogens and their animal and human hosts. Vector-borne diseases are particularly sensitive to warming because temperature changes can alter vector development rates, shift their geographical distribution and alter transmission dynamics. For this reason, African trypanosomiasis (sleeping sickness), a vector-borne disease of humans and animals, was recently identified as one of the 12 infectious diseases likely to spread owing to climate change. We combine a variety of direct effects of temperature on vector ecology, vector biology and vector–parasite interactions via a disease transmission model and extrapolate the potential compounding effects of projected warming on the epidemiology of African trypanosomiasis. The model predicts that epidemics can occur when mean temperatures are between 20.7°C and 26.1°C. Our model does not predict a large-range expansion, but rather a large shift of up to 60 per cent in the geographical extent of the range. The model also predicts that 46–77 million additional people may be at risk of exposure by 2090. Future research could expand our analysis to include other environmental factors that influence tsetse populations and disease transmission such as humidity, as well as changes to human, livestock and wildlife distributions. The modelling approach presented here provides a framework for using the climate-sensitive aspects of vector and pathogen biology to predict changes in disease prevalence and risk owing to climate change.
Keywords: sleeping sickness, trypanosomiasis, disease ecology, vector, climate, global warming
1. Introduction
Climate changes have been implicated in the emergence, re-emergence or range expansion of many wildlife and human diseases in recent years, such as cholera [1,2], West Nile virus [3], malaria [4,5] and amphibian chytridiomycosis [6]. The global mean temperature has increased by 0.7°C during the past 100 years and is predicted to increase by an additional 1.1–6.4°C during the twenty-first century [7]. Additional warming is likely to affect the epidemiology of vector-borne diseases by altering pathogen and vector development rates and generation times, shifting the geographical distribution of vector or reservoir host populations, altering transmission dynamics or modifying host susceptibility to infection [8,9]. Such changes could cause pathogen range expansions and host declines, or release hosts from disease control by interfering with the precise conditions that many parasites require for persistence [10–13]. One vector-borne infectious disease that is expected to respond to climate change is African trypanosomiasis, which the Wildlife Conservation Society recently identified as one among 12 wildlife or zoonotic diseases likely to increase in incidence or expand their geographical range owing to predicted climate changes during the twenty-first century [14].
An estimated 70 000 cases of human African trypanosomiasis, commonly known as sleeping sickness, occur each year, and 60 million people are currently estimated to be at risk of infection in sub-Saharan Africa [15,16]. African trypanosomiasis infections are caused by the parasitic protozoa Trypanosoma brucei gambiense in West and Central Africa and Trypanosoma brucei rhodesiense in East Africa, and can be transmitted to humans through over 20 species of Glossina tsetse flies [17,18]. We focus on T. b. rhodesiense, which occurs in eastern and southern Africa and is vectored by Glossina morsitans morsitans and Glossina pallidipes, along with other species and subspecies classified under the subgenus Morsitans (Glossina sensu stricto Wiedemann) [18–21]. Since the Great Epidemic of the 1900s in eastern Africa that infected half a million people [22–24], intermittent African trypanosomiasis outbreaks have occurred throughout eastern and southern Africa [25]. Outbreaks tend to occur at historical endemic foci where the parasite appears to persist in reservoir populations between outbreaks [26,25]. Since the 1960s, there has been a resurgence in African trypanosomiasis cases in certain historic foci, as well as a spread of the disease into several new areas [27–29] owing to the discontinuation of control programmes, civil disturbances and economic problems [30]. Changes to tsetse range distributions can expose naive animal and human populations to infection. For example, the spread of Glossina fuscipes fuscipes into southeast Uganda in the 1970s and 1980s led to a serious epidemic in the region [17]. The association between shifts in tsetse ranges and epidemic outbreaks of sleeping sickness is relevant because projected changes to the regional climate regime are likely to cause changes in the distribution of certain tsetse species and alter the suitability of the environment for the parasite.
Temperature has a strong influence on tsetse population dynamics [31], and can be one of the strongest abiotic determinants of tsetse distributions [18]. For example, the strongest predictor of G. morsitans distribution in Zimbabwe is the maximum of the mean monthly temperature—correctly predicting the flies' presence/absence over 82 per cent of the country [32]. In West Africa, temperature is the most important variable for describing the distribution of eight different species of Glossina [33], and a combination of temperature, moisture and vegetation variables predicts tsetse ranges with greater than 80 per cent accuracy [18,32–35]. The length of the tsetse pupal development period decreases with increasing temperature, whereas larval production decreases above a certain threshold, and both pupal and adult mortality increase with temperature [31]. Laboratory studies of tsetse physiology have also shown that tsetse survival and metabolic rates are temperature-dependent [36–38]. The importance of meteorological variables, particularly temperature, in determining tsetse abundance and distribution suggests that climate change will probably alter the distribution of suitable tsetse habitat throughout much of sub-Saharan Africa.
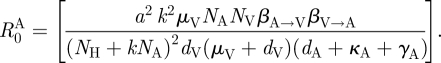
As the evidence for climate impacts on disease has increased, there has been a move towards incorporating climate effects into models of disease transmission and potential distributions of vectors [32,39]. Because climate changes affect multiple parameters involved in the epidemiology of a particular disease—often in different directions and with different intensities—predicting the effect of climate change on disease transmission and risk requires a framework that specifically incorporates the role of each climate-sensitive parameter. One approach, proposed by Rogers & Randolph [39], focuses on understanding the effects of climatic changes on the basic reproductive number, R0, of the parasite. R0 provides a threshold quantity for predicting the pathogen's ability to invade and persist in a host population, and also provides other valuable information regarding the nature of the epidemic [40–42]. Here, we use the approach of Rogers & Randolph [39] to examine the response of African trypanosomiasis to climate change owing to the sensitivity of both the tsetse vector and the parasite to relatively small changes in mean temperature.
Here, we focus on incorporating the effect of mean annual temperature on the important epidemiological parameters in our R0 model of African trypanosomiasis in order to understand the likely impacts of climate change on the geographic range of T. b. rhodesiense in southern and eastern Africa. Our analysis focuses on the effects of temperature on aspects of tsetse biology that influence disease transmission, because the potential changes to wildlife and livestock reservoir populations, as well as the progression of disease within these populations, are too uncertain. We predict a suitable temperature range for T. b. rhodesiense, and then use this range to forecast changes to the parasite's range under several climate change scenarios. We assess the extent of overlap between the current distribution of the Morsitans group of tsetse flies and the current and future T. b. rhodesiense ranges predicted by the model. We also compare the model predictions with the current distribution of the human population in the region to determine how the human risk of exposure might shift during the twenty-first century. Our results demonstrate the importance of addressing the climate-sensitive aspects of vector and pathogen biology for predicting changes in disease risk or incidence owing to climate change.
2. Model
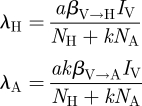
African trypanomiasis epidemiology primarily centres on the interactions between the hosts, which can be either human or animal, and the tsetse vector. We model the transmission dynamics in all three populations—human hosts, animals hosts and the vector, using a commonly used SIR-type framework [43,44]. The populations are divided into several compartments: susceptible and infected for humans; susceptible, infected and recovered for animals; and susceptible, exposed and infected for vectors. The abbreviations S, E, I and R stand for susceptible, exposed, infected and recovered, respectively, and the subscripts H, A and V stand for humans, animals and vectors, respectively (e.g. IH are the number of infected humans). In both human and animal hosts, susceptibles become infected via an infectious tsetse bite, and recover from the infection, at per capita rates λ, and γ, respectively. In humans, recovery follows successful treatment, and recovered individuals are susceptible to future infections [17,45]. In contrast, some animals can recover naturally [46] and recovered individuals may be immune to future infections [47]. For both hosts, newborns are always susceptible, and the per capita birth rate is b, and hosts either die naturally or owing to the disease at per capita rates d and κ, respectively.
Tsetse flies acquire pathogens via infectious hosts during blood meals at a per capita rate λV. Upon successful transmission, the tsetse flies are initially in a non-infectious exposed state. Depending on the pathogen's development rate in the fly, tsetse flies then enter an infected state, capable of transmission. We take this development rate to be μV. Once infectious, we assume that tsetse flies remain in that state for the duration of their lifespan. Per capita tsetse birth and death rates are taken to be bV and dV.
The following set of ordinary differential equations fully describe the epidemic and demographic processes.
 |
2.1 |
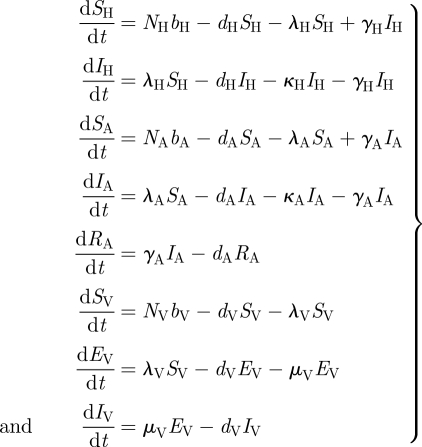
The three forces of infection—λH, λA and λV capture the details of the transmission process. Tsetse flies have a per capita biting rate a. These bites are disproportionately distributed among available human and animal hosts. Therefore, we assume that tsetse have a preference for animal blood meals k times than over human blood meals. When the bite involves a susceptible host and an infectious tsetse or a susceptible tsetse and an infectious host, there is a chance of transmission of the pathogen. The probabilities of such transmission per bite are given by βV→H, βV→A, βH→V and βA→V, depending on the direction of the transmission and the hosts involved. This leads to the following equations for the three forces of infection:
 |
2.1. Calculation of R0 and parameter values
Using the next-generation method described by van den Driessche & Watmough [48] to calculate the basic reproductive number, R0, for the model described by equation (2.1), we arrive at the following formulation:
| 2.2 |
where,
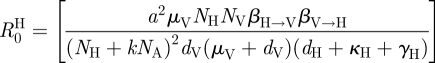 |
and
 |
Parameter values are taken from field studies, laboratory experiments and other African trypanosomiasis models found in the literature (see table 1 for parameter values and appendix A for details on how these values were selected).
Table 1.
SIR model variables, parameters and default estimates used to calculate R0. All rates are expressed as d−1. See text for parameter estimate sources.
| name | description | estimate |
|---|---|---|
| NH | total human population size | 1000 |
| NA | total animal population size | 2000 |
| NV | total tsetse population size | 60 000a |
| bH | natural human birth rate | 1/(365 × 40) |
| dH | natural human death rate | 1/(365 × 40) |
| κH | additional mortality rate of infected humans | 1/108 |
| γH | recovery rate of infected humans | 0.009 |
| bA | natural birth rate of animal host | 1/(365 × 2) |
| dA | natural death rate of animal host | 1/(365 × 2) |
| κA | additional mortality rate of infected animals | 0.0008 |
| γA | recovery rate of infected animals | 1/120 |
| dV | natural death rate of tsetse | 0.041a,b, 0.030a,c |
| μV | parasite maturation rate in tsetse | 1/18a |
| k | relative tsetse preference for animal hosts | 25 |
| a | tsetse biting rate | 0.33a |
| βV→H | probability of transmission upon contact from tsetse to human | 0.0083 |
| βV→A | probability of transmission upon contact from tsetse to animal | 0.0083 |
| βH→V | probability of transmission upon contact from human to tsetse | 0.0355 |
| βA→V | probability of transmission upon contact from animal to tsetse | 0.0355 |
aFor parameters that are temperature-dependent, value in table is for a mean annual temperature of 25°C.
bDenotes G. m. morsitans.
cDenotes G. pallidipes.
2.2. Effect of temperature-dependent parameters on R0
We focus on the effect of climate change on African trypanosomiasis epidemiology by examining the overall effect of several climate components on the net reproductive number, R0 [39]. In particular, R0 = 1 is a threshold for parasite invasion and persistence—when R0 is below this threshold, the parasite cannot persist in the host population. Hence, any effect of climate on R0 should directly affect the ability of the parasite to establish in a host population.
The climate-induced effects can be thought of in two parts: (i) the effect of climate on specific biological or ecological quantities; and (ii) the relative role of each quantity on the epidemiology of the disease. In this paper, we consider temperature as the only climatic driver. Tsetse flies are also susceptible to humidity levels [31], but the effect of changes in humidity is more difficult to quantify and sparsely documented in the literature. We take temperatures as means; although diurnal fluctuations are perhaps relevant [49], it is beyond the scope of this paper.
Evidence suggests that the vector biting rate (a), vector mortality rate (dV) and parasite development rate in the vector (μV) are all sensitive to changes in temperature. In addition, the distribution and abundance of different tsetse species are highly sensitive to temperature [18,50,51]. Because vector abundance appears in equation (2.2), any changes to tsetse abundance will also alter R0. Transmission rates from the vector to human (βV→H) and animal (βV→A) hosts, and from the hosts back to the vector (βA→V, βA→V) may also be affected by temperature, but the data needed to estimate these relationships are lacking, so we assume that all transmission rates are constant. Other aspects of HAT epidemiology, such as wildlife abundance or recovery rates in animals and humans, are also likely to be altered by climate change, but the relationship between climate and these variables is unknown.
The change in R0 with a change in mean temperature can be determined by the sum of the effects of temperature on each temperature-sensitive component of R0 coupled with the corresponding change to R0:
| 2.3 |
The mathematical relationships between R0 and the temperature-sensitive biological parameters are as follows:
| 2.4 |
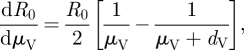 |
2.5 |
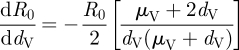 |
2.6 |
| 2.7 |
Equations (2.4)–(2.7) indicate that increases in a, μV or NV will all have a positive effect on R0, while an increase in dV will have a negative effect. However, the quantitative effect of temperature change on R0 will depend on both the individual relationships of these parameters with temperature and their combined impact within the R0 equation. While the relationship between R0 and changes to its various components is relatively straightforward, there is a greater deal of uncertainty in determining the relationship between temperature and the various model parameters, because these parameters often incorporate various aspects of the physiology, behaviour and ecology of tsetse flies and their hosts [20]. In some cases, the directional effect of temperature can be predicted, but even for these parameters an accurate quantitative relationship to temperature is typically not available. In the subsections that follow, we describe the quantitative effects of temperature on several parameters for which plausible estimates can be derived, namely tsetse abundance (NV), tsetse mortality rates (dV), biting rates (a) and the parasite development rate in tsetse (μV). These temperature equations are then coupled with the appropriate equations (2.4)–(2.7) to examine how R0 is influenced by parameter-specific temperature effects.
2.2.1. Tsetse mortality rate (dV) and temperature
Temperature has a nonlinear effect on the mortality rate of tsetse flies; mortality rates are high at both low and high temperatures with optimal rates occurring at intermediate temperatures [31]. Hargrove [52] determined the relationship between temperature and mortality for G. pallidipes and G. m. morsitans via a mark-recapture study on Antelope Island, Lake Kariba, Zimbabwe. Mean temperatures explained the majority of the variance in mortality rates, although the exact relationship between tsetse mortality rates and temperature depends on both the species and sex of the fly. Here, we use the general equation derived by Hargrove [31]:
| 2.8 |
We average the male and female estimates of k1 and k2 derived by Hargrove [31] for each species to get species-specific parameter values (figure 1a). The estimated mean parameter values are k1 = 0.077 and k2 = 0.52 for G. m. morsitans, and k1 = 0.164 and k2 = 2.49 for G. pallidipes. For G. pallidipes, equation (2.8) applies only when  C; when
  C mortality is assumed to be a constant dV = 0.0286 [31]. The derivative of dV with respect to temperature (
 ) is therefore
| 2.9 |
Figure 1.

Relationship between temperature and four different parameters that influence R0. The (a) daily mortality rate of G. m. morsitans (dashed line) and G. pallidipes (dV, solid line), (b) tsetse daily feeding rate a. (c) Daily rate of parasite development in tsetse (μ) and (d) G. m. morsitans and G. pallidipes abundance (NV) as a function of mean annual temperature.
2.2.2. Biting rate (a) and temperature
The biting rate, a, represents the frequency of feeding activity by tsetse flies. As ectotherms, tsetse internal rates of reaction, which affect growth and cellular differentiation, are particularly sensitive to environmental temperatures [53]. The basal metabolic rates of several Glossina species increase log-linearly with temperature [36–38]. Because adult tsetse flies tend to remain inactive in a resting location between blood meals, and only emerge to search for an appropriate host when hungry [20,31], we assume that their feeding rate will show the same rate–temperature response as their metabolic rate. Therefore, the slope for the biting rate–temperature equation is the same as the slope of the relationship between temperature and log metabolic rate for G. m. morsitans and G. pallidipes over a range of 20–32°C as experimentally determined by Terblanche & Chown [37]:
and
where c = 0.031 for G. pallidipes and c = 0.0329 for G. morsitans. The y-intercept, b, is parametrized so that a = 0.25 at 21°C for each species. Although the metabolic rate–temperature response is subject to a maximum tolerance threshold, above which rates can drop rapidly owing to enzyme inactivity [54], the maximum temperature of 32°C in this study is higher than the maximum temperature at which positive population growth rates occur for either species (see §2.2.4), but lower than the temperature of denaturation. Therefore, we assume a log-linear relationship between biting rate and temperature over the range of temperatures considered in this article (figure 1b).
2.2.3. Parasite development rate, μV, and temperature
An early study by Kinghorn & Yorke [55] found that the length of the T. b. rhodesiense development cycle in G. morsitans was negatively correlated with ambient temperatures. Desowitz & Fairbairn [56] found that the development period for Trypanosoma vivax in G. p. palpalis decreased in a linear fashion as temperature increased from 21°C to 30°C. By assuming that the recruitment rate of tsetse flies into the infectious class (μV) is 1/(development period), we derive the following equations from Desowitz & Fairbairn's [56] experimental data:
and
We assume that the development rate of T. b. rhodesiense will show the same quantitative relationship to temperature as T. vivax (figure 1c). We also parametrize the y-intercept so that the development rate is μV = 0.056 d−1 at 25°C to match estimates from a laboratory study of T. b. rhodesiense development in G. m. morsitans by Dale et al. [57].
2.2.4. Tsetse abundance, NV, and temperature
Mean temperature is one of the key influences on the abundance of several tsetse species [18,31,50,51,58,]. Tsetse reproduction, development and mortality rates are all temperature-sensitive [31], so the population growth rate will be influenced by temperature. Here, we calculate the population growth rate from these life-table parameters using the Euler–Lotka equation from Williams et al. [58]:
| 2.10 |
The population growth rate, r, depends on the daily survivorship of pupae (σa), nulliparous adults (σb) and adult flies (σc), as well the number of days spent in each of these age classes, τa, τb and τc, respectively. The population growth rate also depends on the fecundity rate (β), which depends on the larval mortality rate, the length of the inter-larval period and female adult mortality rate. A complete list of the parameters in equation (2.10), and the temperature-response rate of G. morsitans for each of these parameters, is included in table 2. We assume that the equilibrium tsetse abundance is directly correlated to the average population growth rate, with the maximal equilibrium abundance occurring when the growth rate is maximized and a zero abundance if the population growth rate is negative for a given mean annual temperature. The abundance at other temperatures is calculated by scaling abundance proportional to the maximum abundance based on the growth rate relative to the maximum growth rate (figure 1d).
Table 2.
Parameters used to calculate Glossina morsitans population growth rate and density as a function of the mean annual temperature ( ).
).
| parameter | description | temperature response | referencea |
|---|---|---|---|
| β | fecundity rate | β = e(−dL×τc) | [58] |
| dL | larval mortality rate |  |
[31] |
| σa | pupal survival rate | σa = 0.995 | [31,58] |
| σb | nulliparous survival rate |  |
[31] |
| σc | adult survival rate |  |
[31] |
| τa | length pupal period (d) |  |
[31,59,60] |
| τb | nulliparous period (d) |  |
[31,61] |
| τc | length adult lifespan (d) |  |
[31,61] |
aReference column includes references used to estimate parameter values and their sensitivities to temperature.
2.3. Model analysis
The relationships between R0 and temperature described in equations (2.4–2.10) are entered into equation (2.3) to calculate the temperature range where R0 > 1 with either G. m. morsitans or G. pallidipes acting as the primary vector for T. b. rhodesiense. Hide [62] identified 14 specific areas (referred to as foci) in southern and eastern Africa where African trypanosomiasis outbreaks have occurred since 1900. To validate the results regarding the sensitivity of R0 to temperature, we examine whether the current mean annual temperatures at these known African trypanosomiasis foci fall within the predicted suitable range for T. b. rhodesiense. The annual mean temperature from 1950 to 2000 is taken for each historical foci from the appropriate 2.5 arc-minute grid cell in a dataset compiled by Hijmans et al. [63]. The 2.5 arc-minute spatial dataset of 1950–2000 mean annual temperatures is then used to create a map of the suitable range for T. b. rhodesiense in eastern and southern Africa. All spatial analyses are conducted using ArcGIS v. 9.3 (ESRI; San Diego, CA, USA). Because the parasite has a slightly wider temperature range when vectored by G. pallidipes (see §3), all spatial predictions use the temperature range calculated with G. pallidipes as the vector.
The map of the predicted suitable range for T. b. rhodesiense is compared with a map of the predicted areas of suitability for the Morsitans group of tsetse flies created by Wint & Rogers [64]. The Morsitans group consists of tsetse species in the subgenus Glossina s.s.: G. morsitans, G. pallidipes, G. austeni, G. longipalpis and G. swynnertoni [65]. The Morsitans dataset provides a map of the probability of occurrence rather than presence/absence, so for our analysis we use a probability of occurrence of 75 per cent as a threshold for presence/absence. We calculate the percentage of the current Morsitans range predicted also to be suitable for T. b. rhodesiense, as well as the proportion of tsetse habitat either too cold or too hot for the parasite.
Future climate conditions are simulated using results from two general circulation models (GCMs) included in the Fourth Assessment Report of the Intergovernmental Panel on Climate Change (IPCC) [7]. For the GCMs developed by the Hadley Centre (HadCM3) and the National Center for Atmospheric Research (CCSM3), we examined two greenhouse gas (GHG) emissions scenarios: a moderate scenario with intermediate population and economic growth estimates and modest emission controls leading to emissions peaking at mid-century (B1) and a more extreme scenario with high global population, slow economic growth and slow technological changes (A2) [7]. For each GCM and emissions scenario, we use the 20-year mean annual temperature for two periods: 2046–2065 and 2080–2099. The future climate datasets have a coarser spatial resolution (2.5 × 3.75° for HadCM3 and 1.4 × 1.4° for CCSM3) than the current climate dataset; therefore, we overlay the future temperature anomalies over the current climate layer to create a future climate data layer with a spatial resolution of 2.5 arc-minutes. We then determine the predicted suitable geographical range for T. b. rhodesiense for the periods 2046–2065 and 2080–2099 under the A2 and B1 emissions scenarios by averaging the results from the HadCM3 and CCSM3 GCMs. We also examine the proportion of the current Morsitans range that will become too hot for the parasite under each of these scenarios. Because our model does not provide a prediction of how tsetse distributions will shift, we present results regarding the parasite's range expansion without making any assumptions about whether the vector will also shift its geographical distribution.
The number of people currently living within the suitable temperature range for T. b. rhodesiense is calculated using population estimates provided in the Gridded Population of the World [66]. We assume here that the human population size and distribution will remain constant because future population estimates are not yet available at the spatial resolution of our model. Population counts at a spatial resolution of 2.5 arc-minutes were overlaid with current mean annual temperatures, and the future climate scenarios, in order to estimate the number of people currently at risk, the number of additional people who could be at risk under the projected warming scenarios and the number of people living in regions that will likely become too hot for sustained African trypanosomiasis transmission under the various future climate projections.
To calculate R0 as a function of mean temperature, we have used empirically derived fixed parameter values. However, there is an unknown amount of uncertainty associated with each of these values, particularly for those parameters that were estimated from studies of Trypanosoma congolense or Trypanosoma gambiense rather than T. b. rhodesiense. We conducted a sensitivity analysis to determine which parameters had the largest influence on R0 and to determine how sensitive R0 was to changes in the ratio of vectors to hosts and the animal : human host ratio. We also conducted an uncertainty analysis using the Latin hypercube sampling approach described earlier [67,68] to see how sensitive our results were to parameter uncertainty. In particular, we examined the effect of uncertainty in key parameters on the temperature range where R0 > 1. Further methodological details and results of the sensitivity and uncertainty analyses are provided in the electronic supplementary material.
3. Results
Based on the relationships between mean annual temperature and the four temperature-sensitive parameters in equation (2.3), the temperature range where R0 > 1 for T. b. rhodesiense is predicted to be 20.7–26.1°C with G. pallidipes as the primary vector species (figure 2), and 20.9–25.6°C for G. morsitans. A maximum R0 of 1.51 occurs at 24.0°C with G. pallidipes, and a maximum R0 of 1.24 occurs at 23.6°C with G. morsitans. The value of R0 is most sensitive to changes in the tsetse biting and mortality rates (see the electronic supplementary material for further details). All 14 of the historical foci fall within the predicted current suitable range for T. b. rhodesiense (figure 3).
Figure 2.

Relationship between temperature and R0 when T. b. rhodesiense is vectored by G. m. morsitans (dashed line) or G. pallidipes (solid line). R0 = 1 represents a threshold for the successful invasion or persistence of the parasite into a susceptible host community.
Figure 3.

Suitable geographical range for T. b. rhodesiense transmission based on range where R0 > 1 for G. pallidipes. The darker grey region (purple on the online version) represents the portion of the range also predicted to be the ideal habitat for Morsitans group tsetse flies. Lighter grey (blue on the online version) represents the portion of the suitable range currently believed to be unoccupied by Morsitans group tsetse flies. Circles represent locations of previous African trypanosomiasis outbreaks in East Africa [62]. (Online version in colour.)
Our model predicts an expansion in the suitable geographical range of T. b. rhodesiense for the 20-year period 2045–2064 of 10.4 per cent under the B1 emissions scenario, and 11.5 per cent under the A2 emissions scenario (table 3). Both of these predicted expansions are due to moderate shifts in the suitable geographical range (figure 4a). For example, under the A2 scenario, 31.4 per cent of the current suitable range will become too hot by 2055, whereas 38.4 per cent of the future range is in areas currently too cold for the parasite. The predicted suitable geographical range for T. b. rhodesiense shifts even further by 2080–2099. The extent of the predicted range in 2090 is only 85.2 per cent of the current suitable range size under the more severe A2 emissions scenario, a decrease of 23.6 per cent from the predicted 2055 range (figure 4b). Of the current suitable range, 68.5 per cent is predicted to be too hot by 2090, and 63.0 per cent of the 2090 range under the A2 scenario is in areas that are currently predicted to be too cold to support an  for T. b. rhodesiense.
Table 3.
Per cent changes to the suitable geographical range of T. b. rhodesiense in 2046–2065 and 2080–2090. Results are presented for the A2 and B1 climate change scenarios. Range loss is the percentage of the current suitable range that will become too hot by 2046–2065 or 2080–2090, and new proportion of range is the percentage of the predicted future range that is currently too cold for T. b. rhodesiense.
| years | GCM scenario | % of current range | range loss (%) | new proportion (%) |
|---|---|---|---|---|
| 2045–2064 | B1 | 110.4 | 20.2 | 27.7 |
| A2 | 111.5 | 31.4 | 38.4 | |
| 2080–2099 | B1 | 111.8 | 27.8 | 35.4 |
| A2 | 85.2 | 68.5 | 63.0 |
Figure 4.

Suitable geographical range for T. b. rhodesiense transmission in (a) 2055 and (b) 2090 under the A2 emissions scenario using the CCSM3 global circulation model. The predicted range is in black (light blue on the online version), with the white stippled (dark blue on the online version) region representing the existing portion of the predicted range and the unstippled area representing the newly expanded part of the range. Grey (red on the online version) areas on the map represent currently suitable areas predicted to be too hot under future conditions. Circles represent locations of previous outbreaks in East Africa [62]. (Online version in colour.)
About 84.2 per cent of the predicted geographical distribution for the Morsitans group of Glossina also has a suitable temperature for sustained T. b. rhodesiense transmission. Of the Morsitans distribution, 10.4 per cent is colder than the suitable temperature range for T. b. rhodesiense, and 5.4 per cent is currently too hot. The percentage of the Morsitans distribution with annual mean temperatures suitable for T. b. rhodesiense decreases under both the B1 and A2 emissions scenarios, with larger declines occurring under the A2 scenario. Under the B1 scenario, the suitable proportion of the Morsitans distribution falls to 71.1 per cent in 2055 and 64.6 per cent by 2090. Under the A2 scenario, the suitable portion is 58.6 per cent in 2055 and 29.7 per cent in 2090, with over 70 per cent of current Morsitans habitat becoming too hot for T. b. rhodesiense by 2090. Under both scenarios, the portion of unsuitable habitat is almost entirely areas that will become too warm; only the B1 scenario in 2055 predicts that greater than 1 per cent of the current Morsitans geographical range will be too cold (1.5%) for T. b. rhodesiense.
The two historical foci in southwestern Ethiopia are predicted to become too hot for T. b. rhodesiense by 2055 under the B1 emissions scenario, and in addition to these two foci, a third focus in the South Luangwa Valley in Zambia is predicted to be too hot in 2055 under the A2 emissions scenario. The same three foci are also the only foci predicted to be outside the 2090 range under the B1 scenario. However, under the A2 emissions scenario as many as 10 of the 14 foci may become too hot for T. b. rhodesiense by 2090.
The predicted range shift of T. b. rhodesiense corresponds to a significant increase in the number of people potentially exposed to the parasite. A total of 75.7 million people live within the current potential range of T. b. rhodesiense, but over 97.9 and 108.8 million people live within the projected range for 2055 under the B1 and A2 emissions scenarios, respectively. In addition, over 105 million people live within the projected range for 2090 under both emission scenarios. For 2090, this includes 46.4 (B1) to 76.7 (A2) million people within the expanded portion of the range who are not currently predicted to be at risk of infection according to our model.
4. Discussion
Climate change, particularly global warming, is already altering habitat quality, species distributions, biodiversity and many essential ecosystem services [69–71]. In the Northern Hemisphere, species distributions are shifting northwards at a rate of 6.1 km per decade and upwards in elevation by 6.1 m per decade [69]. Climate warming over the next century is also expected to have a large impact on the interactions between pathogens and their animal and human hosts [10,72]. Our model results indicate that projected increases in mean annual temperatures over the next 50–100 years are likely to significantly shift the distribution of T. b. rhodesiense to eastern and southern Africa. These shifts in distribution may lead to an increase in the number of people at risk of infection.
Although our model does not predict a major expansion or contraction in the suitable range for T. b. rhodesiense, our results suggest that there may be a significant shift in the geographical areas at risk of African trypanosomiasis outbreaks. The suitable geographical range for T. b. rhodesiense based on mean annual temperatures is predicted to increase 10–11% by 2055. By the end of the century, the extent of the suitable range is predicted to be 85–111% of its current size depending on assumptions about future GHG emissions. However, under each scenario, we considered that at least 20 per cent of the current suitable range is predicted to become too hot. In addition, 28–38% of the 2055 range, and 35–63% of the 2090 range, is new habitat for the parasite. The greatest amount of warming is predicted under the A2 emissions scenario (an increase of 3.4°C in the global mean temperature by 2090; [7]), which our model predicts will lead to a 15 per cent decrease in the geographical extent of the suitable range by 2090. This occurs because 68.5 per cent of the current suitable range becomes too hot for the parasite. Owing to regional variation in the GCM predictions, some areas in southern Africa are actually predicted to go from being too cold at current temperatures (less than 20.7°C), to being too hot by 2090 (greater than 26.1°C).
Although several recent studies have predicted that the geographical ranges of vector-transmitted pathogens will expand owing to global warming [73], Lafferty [12] suggests that shifts in the suitable range for pathogen transmission and persistence are more likely than large-range expansions. The relationship between climate and habitat suitability for vector-transmitted pathogens is likely to be complex because important epidemiological parameters exhibit nonlinear or contrasting responses to changes in temperature or other climatic variables. For example, our model predicts that tsetse population growth rates and abundance show a unimodal response to temperature, with the highest growth rates occurring at intermediate temperatures (figure 1). Our results in this study largely support Lafferty's hypothesis as the model predicts a large shift in the geographical range of T. b. rhodesiense owing to a considerable contraction of the existing range and a corresponding expansion into new areas. These results suggest that the modelling framework presented here could be an important tool used to predict whether the geographical distributions of other infectious diseases are likely to expand, contract or undergo range shifts under different climate-change scenarios.
Even if the size of the geographical range does not increase significantly, range shifts can lead to changes in the number of people at risk of exposure and disease incidence. For example, Pascual & Bouma [72] point out that the highland plains in East Africa are the most densely populated region on the continent; therefore, an upward shift in the suitable elevation range for malaria would lead to a large increase in the number of people exposed to the disease. This parallels our finding that between 22 and 33 million additional people live in the projected future suitable range for T. b. rhodesiense when compared with its current suitable range, because the distribution is predicted to shift upwards into the East African highlands where there are high population densities. In addition, the expansion of African trypanosomiasis into areas containing immunologically naive wildlife and domestic animal populations could lead to increased transmission rates and a greater risk of spillover from animal reservoirs to humans [74].
The projected suitable geographical ranges for T. b. rhodesiense presented here represent the broadest possible extent of the parasite's distribution, because the distribution of the parasite is dependent on abiotic and biotic factors other than the mean annual temperature. In particular, the parasite is obviously limited to regions where tsetse flies are present. Although mean temperatures are an important determinant of tsetse distributions [18,32], tsetse abundance can also be influenced by many other environmental factors such as relative humidity, minimum and maximum temperatures, vegetation, and host availability [18,32–34,64]. Only 32.2 per cent of T. b. rhodesiense's current suitable geographical range—as predicted by our model—is probably considered Glossina habitat [64]. However, we have presented the entire possible geographical range of the parasite for comparison to its projected ranges in 2055 and 2090 because we do not have predictions of how tsetse distributions will shift in the future, and we do not want to limit our analysis to current tsetse distributions. If tsetse distributions do not adjust to future climate conditions, then reductions in the potential geographical range of T. b. rhodesiense are likely to be significant. We predict that 27–41% of current tsetse habitat in eastern and southern Africa will be too hot to sustain the parasite by 2055, and 35–70% will be too hot by 2090. However, tsetse are unlikely to be limited by their dispersal ability [31], so it is likely that they will be able to shift the elevational and latitudinal extents of their range in regions with suitable climate and habitat conditions. The projected geographical ranges of T. b. rhodesiense presented here should be considered as preliminary risk maps. In areas of specific concern, an assessment of the current and forecasted habitat conditions should be conducted to determine whether future environmental conditions are likely to support both the parasite and its vector(s).
In addition to the presence of at least one Glossina species, T. b. rhodesiense also requires the presence of animal reservoir hosts [75]. Because T. b. rhodesiense cannot be sustained solely by human–fly–human transmission, humans are only at risk if there is a sufficient abundance of potential reservoir hosts [76]. Therefore, the predicted suitable temperature range for the parasite will also be limited by reservoir host distributions. Wildlife hosts were traditionally assumed to be the major reservoir because many wildlife species were thought to be highly trypanotolerant ([77]; but see [78,79] for early counterexamples), but domestic livestock have also been implicated as reservoirs in several recent outbreaks of Rhodesian sleeping sickness [24,29,62,80,81]. In rural areas, where land-use changes have led to increased contact rates between wildlife and domestic livestock, local populations of wildlife and livestock may jointly serve as reservoirs [76]. If tsetse species can shift their distributions as conditions become favourable in southern Africa and the highlands of East Africa, these more densely populated regions that also have large livestock populations may be at particular risk of Rhodesian sleeping sickness outbreaks. However, climate and land-use changes will surely alter the current distribution of wildlife reservoir species and livestock, which may alter the suitable geographical range for trypanosomiasis transmission presented here. Future analyses should try to address how shifts in the distribution and abundance of humans, livestock and wildlife are likely to affect tsetse populations and disease transmission.
The effects of climate change on ecology and epidemiology of human African trypanosomiasis and other diseases are likely to vary in both degree and direction, often in a non-additive fashion [39]. Using parameters related to vector and parasite biology can help refine predictions of disease prevalence and risk owing to climate change. This approach has the potential to not only identify regions of risk as we have done here, but also assess the levels of risk based on R0 values. By formulating a model, one can provide a framework to explore the effects of the complex processes involved in parasite transmission and epidemiology in a systematic manner. Here, we forecasted how African trypanosomiasis epidemiology might respond to changes in mean annual temperature in eastern and southern Africa by incorporating the effects of temperature on several key parameters (tsetse abundance, mortality, feeding activity and trypanosome development rate in tsetse flies). Our results show that combining the effects of climate change on different parameters involved in human African trypanosomiasis epidemiology is essential to obtain a more comprehensive understanding of the overall effect of climate change on disease risk.
Acknowledgements
We thank E. Borer, J. Hargrove, J. Dushoff, J. Pulliam, E. Lungo, W. Getz, T. Porco, J. Lloyd-Smith and two anonymous reviewers for comments and suggestions; and NSF, DIMACS, the African Institute for Mathematics and SACEMA for support. Funding for S.M. provided by an NSF IGERT Fellowship in Ecosystem Informatics (NSF 0333257).
Appendix A. Trypanosomiasis parameter values
Trypanosoma brucei rhodesiense infections in humans typically reach the central nervous system within two months of infection and most (greater than 80%) untreated individuals die within six months of infection [82]. The average duration from onset of symptoms to death during one epidemic in Uganda was 108 days in the absence of treatment [82,83], so we assume that the daily instantaneous mortality rate due to infection is κH = 0.0093 d−1. This rate is only an approximation because it ignores the incubation period prior to the onset of symptoms, as well as additional mortality in treated individuals that can be as high as 10 per cent. Determining a recovery rate in humans is difficult because recovery is possible only through medical treatment of an infection, but the number of undetected cases per detected case may be fairly high [83]. Odiit et al. [83] found that during the 1988–1990 sleeping sickness outbreak in Tororo, Uganda, an estimated 39 per cent of the cases went undetected and untreated (presumably leading to death), 20 per cent were reported during the early stages of illness and 42 per cent did not present symptoms until the later stages. Based on these percentages, and average times from the onset of symptoms to treatment of 45 and 94 days for early and late cases, respectively [83], we have calculated a recovery rate owing to treatment of γH = 0.009 d−1 for humans.
Many domestic livestock and wildlife species can be infected by T. b. rhodesiense [24,75,81], and these species show a wide range of resistance or tolerance to infection [77]. The relative importance of wildlife species versus domestic livestock as a reservoir for T. b. rhodesiense depends on their local densities and proximity to humans and tsetse habitat, but in many regions of East Africa, cattle are increasingly becoming an important reservoir species owing to land-use changes that reduce the abundance of potential wildlife hosts in areas of moderate or heavy human habitation [76]. Following an outbreak of Rhodesian sleeping sickness in the Lambwe Valley of Kenya in the early 1980s, Wellde et al. [80] found that the local breeds of Zebu cattle had high levels of T. b. rhodesiense infection and many showed signs of illness. A subsequent study with several local cattle breeds found that close to 50 per cent of experimentally infected cattle eventually died from the illness, with the time to death ranging from 85 to 1613 days [46]. Based on the results of this study, we have calculated a disease-induced mortality rate for animal hosts of κA = 0.0008 d−1. All of the cattle in the study by Wellde et al. [46] became infected and parasitaemia levels in the blood typically remained high enough to infect tsetse flies for three to five months. Therefore, we assume that the recovery rate of infected reservoir hosts is γA = 0.0083 d−1.
Dale et al. [57] found that the average development period for T. b. rhodesiense in G. m. morsitans was 18 days under laboratory conditions at 25°C, resulting in a parasite development rate of μ = 0.056 d−1. The mortality rate of adult tsetse is species-, sex- and temperature-dependent [31]; therefore, the estimate of tsetse mortality is discussed in more detail in §2.2.1 describing the relationship between tsetse mortality and temperature. A preference of tsetse for non-human over humans hosts of k = 25 was estimated from tsetse blood meal data collected in three districts of southeastern Uganda [84], and human and livestock population estimates for each of these three districts from the 2002 national census and the 2006 livestock census. This strong preference of Glossina for non-human hosts has been observed in other studies of tsetse feeding preferences [85,86].
Field-derived estimates of the probability of infectious tsetse flies transmitting T. brucei are extremely limited. Although previous studies have assumed that the efficiency of transmission from tsetse to competent host species is relatively high, Baylis [87] found that the probabilities of transmission from G. pallidipes and G. longipennis to cattle for T. vivax and T. congolense were only 0.84 and 2.36 per cent, respectively. Because the development of T. brucei in tsetse flies is more similar to that of T. congolense than T. vivax [20], we assume that the probability of transmission of T. b. rhodesiense from tsetse to animals or humans is comparable with the T. congolense transmission efficiency of 0.0236. We could not find any accurate estimates of the average probability of tsetse flies acquiring T.b. rhodesiense from an infected host during a blood meal. However, Baylis [87] found that the susceptibility of G. palpalis to infection with T. b. gambiense was 3.55 per cent, so we assume a transmission probability of 0.0355 from either human or animal hosts to tsetse.
Initial human, animal and tsetse abundances are 1000, 2000 and 60 000, respectively. These values represent abundances for a small village near prime tsetse habitat.
References
- 1.Colwell R. R. 1996. Global climate and infectious disease: the cholera paradigm. Science 274, 2025–2031 10.1126/science.274.5295.2025 (doi:10.1126/science.274.5295.2025) [DOI] [PubMed] [Google Scholar]
- 2.Pascual M., Rodo X., Ellner S. P., Colwell R., Bouma M. J. 2000. Cholera dynamics and El Niño-southern oscillation. Science 289, 1766–1769 10.1126/science.289.5485.1766 (doi:10.1126/science.289.5485.1766) [DOI] [PubMed] [Google Scholar]
- 3.Daszak P., Cunningham A. A., Hyatt A. D. 2000. Emerging infectious diseases of wildlife: threats to biodiversity and human health. Science 287, 443–449 10.1126/science.287.5452.443 (doi:10.1126/science.287.5452.443) [DOI] [PubMed] [Google Scholar]
- 4.Hay S. I., Cox J., Rogers D. J., Randolph S. E., Stern D. I., Shanks G. D., Myers M. F., Snow R. W. 2002. Climate change and the resurgence of malaria in the East African highlands. Nature 415, 905–909 10.1038/415905a (doi:10.1038/415905a) [DOI] [PMC free article] [PubMed] [Google Scholar]
- 5.Pascual M., Ahumada J. A., Chaves L. F., Rodo X., Bouma M. J. 2006. Malaria resurgence in the East African highlands: temperature trends revisited. Proc. Natl Acad. Sci. USA. 103, 5829–5834 10.1073/pnas.0508929103 (doi:10.1073/pnas.0508929103) [DOI] [PMC free article] [PubMed] [Google Scholar]
- 6.Pounds J. A., et al. 2006. Widespread amphibian extinctions from epidemic disease driven by global warming. Nature 439, 161–167 10.1038/nature04246 (doi:10.1038/nature04246) [DOI] [PubMed] [Google Scholar]
- 7.IPCC 2007. Working Group III Fourth Assessment Report, IPCC. See http://www.ipcc.ch/publications_and_data/publications_and_data_reports.shtml [Google Scholar]
- 8.Patz J. A., Graczyk T. K., Geller N., Vittor A. Y. 2000. Effects of environmental change on emerging parasitic diseases. Int. J. Parasitol. 30, 1395–1405 10.1016/S0020-7519(00)00141-7 (doi:10.1016/S0020-7519(00)00141-7) [DOI] [PubMed] [Google Scholar]
- 9.Gubler D. J., Reiter P., Ebi K. L., Yap W., Nasci R., Patz J. A. 2001. Climate variability and change in the United States: potential impacts on vector-and rodent-borne diseases. Environ. Health Perspect. 109, 223–233 10.2307/3435012 (doi:10.2307/3435012) [DOI] [PMC free article] [PubMed] [Google Scholar]
- 10.Harvell C. D., Mitchell C. E., Ward J. R., Altizer S., Dobson A. P., Ostfeld R. S., Samuel M. D. 2002. Climate warming and disease risks for terrestrial and marine biota. Science 296, 2158–2162 10.1126/science.1063699 (doi:10.1126/science.1063699) [DOI] [PubMed] [Google Scholar]
- 11.Harvell C. D., Altizer S., Cattadori I. M., Harrington L., Weil E. 2002. Climate change and wildlife diseases: when does the host matter the most? Ecology 90, 912–920 10.1890/08-0616.1 (doi:10.1890/08-0616.1) [DOI] [PubMed] [Google Scholar]
- 12.Lafferty K. 2009. The ecology of climate change and infectious diseases. Ecology 90, 888–900 10.1890/08-0079.1 (doi:10.1890/08-0079.1) [DOI] [PubMed] [Google Scholar]
- 13.Ostfeld R. S. 2009. Climate change and the distribution and intensity of infectious diseases. Ecology 90, 903–905 10.1890/08-0659.1 (doi:10.1890/08-0659.1) [DOI] [PubMed] [Google Scholar]
- 14.Wildlife Conservation Society 2008. ‘Deadly Dozen’ reports diseases worsened by climate change. Wildlife Conservation Society. See http://www.sciencedaily.com/releases/2008/10/081007073928.htm (accessed 24 January 2011) [Google Scholar]
- 15.WHO 2006. Human African trypanosomiasis (sleeping sickness): epidemiological update. Wkly Epidemiol. Rec. 81, 71–80 [PubMed] [Google Scholar]
- 16.Fèvre E. M., Wissmann Bv., Welburn S. C., Lutumba P. 2008. The burden of human African trypanosomiasis. PLoS Neglect. Tropic. Dis. 2, e333. 10.1371/journal.pntd.0000333 (doi:10.1371/journal.pntd.0000333) [DOI] [PMC free article] [PubMed] [Google Scholar]
- 17.WHO 1998. Control and surveillance of African trypanosomiasis. Geneva: World Health Organization [Google Scholar]
- 18.Rogers D. J., Robinson T. P. 2004. Tsetse distribution. In The trypanosomiases (eds Maudlin I., Holmes P. H., Miles M. A.), pp. 139–180 Wallingford, UK: CABI Publishing [Google Scholar]
- 19.Jordan A. 1993. Tsetse-flies (Glossinidae). In Medical insects and arachnids, pp. 333–388 London, UK: Chapman and Hall [Google Scholar]
- 20.Leak S. G. A. 1999. Tsetse biology and ecology: their role in the epidemiology and control of trypanosomiasis. New York, NY: CABI Publishing [Google Scholar]
- 21.Gooding R., Krafsur E. 2005. Tsetse genetics: contributions to biology, systematics, and control of tsetse flies. Ann. Rev. Entomol. 50, 101–123 10.1146/annurev.ento.50.071803.130443 (doi:10.1146/annurev.ento.50.071803.130443) [DOI] [PMC free article] [PubMed] [Google Scholar]
- 22.Bruce D. 1903. Further report on sleeping sickness in Uganda. Rep. Sleep. Sickness Comm. R. Soc. 4, 3–6 [Google Scholar]
- 23.Christy C. 1903. The epidemiology and etiology of sleeping sickness in Equatorial East Africa, with clinical observations. Rep. Sleep. Sickness Comm. R. Soc. 3, 2–32 [Google Scholar]
- 24.Hide G., Tait A., Maudlin I., Welburn S. 1996. The origins, dynamics and generation of Trypanosoma brucei rhodesiense epidemics in East Africa. Parasitol. Today 12, 50–55 10.1016/0169-4758(96)80654-5 (doi:10.1016/0169-4758(96)80654-5) [DOI] [PubMed] [Google Scholar]
- 25.Berrang-Ford L., Odiit M., Maiso F., Waltner-Toews D., McDermott J. 2006. Sleeping sickness in Uganda: revisiting current and historical distributions. Afr. Health Sci. 6, 223–231 [DOI] [PMC free article] [PubMed] [Google Scholar]
- 26.Welburn S. C., Fèvre E. M., Odiit M., Maudlin I. 2001. Sleeping sickness: a tale of two diseases. Trends Parasitol. 17, 19–24 10.1016/S1471-4922(00)01839-0 (doi:10.1016/S1471-4922(00)01839-0) [DOI] [PubMed] [Google Scholar]
- 27.Fèvre E. M., Coleman P. G., Odiit M., Magona J. W., Welburn S. C., Woolhouse M. E. J. 2001. The origins of a new Trypanosoma brucei rhodesiense sleeping sickness outbreak in eastern Uganda. The Lancet 358, 625–628 10.1016/S0140-6736(01)05778-6 (doi:10.1016/S0140-6736(01)05778-6) [DOI] [PubMed] [Google Scholar]
- 28.Fèvre E. M., Picozzi K., Fyfe J., Waiswa C., Odiit M., Coleman P. G., Welburn S. C. 2005. A burgeoning epidemic of sleeping sickness in Uganda. The Lancet 366, 745–747 10.1016/S0140-6736(05)67179-6 (doi:10.1016/S0140-6736(05)67179-6) [DOI] [PubMed] [Google Scholar]
- 29.Picozzi K., Fevre E. M., Odiit M., Carrington M., Eisler M. C., Maudlin I., Welburn S. C. 2005. Sleeping sickness in Uganda: a thin line between two fatal diseases. Br. Med. J. 331, 1238–1241 10.1136/bmj.331.7527.1238 (doi:10.1136/bmj.331.7527.1238) [DOI] [PMC free article] [PubMed] [Google Scholar]
- 30.Stich A., Abel P. M., Krishna S. 2001. Human African trypanosomiasis. Clin. Rev. 325, 203–206 [DOI] [PMC free article] [PubMed] [Google Scholar]
- 31.Hargrove J. 2004. Tsetse population dynamics. In The trypanosomiases (eds Maudlin I., Holmes P. H., Miles M. A.), pp. 113–138 CABI Publishing, Wallingford, UK. [Google Scholar]
- 32.Rogers D. J., Williams B. G. 1993. Monitoring trypanosomiasis in space and time. Parasitology 106, S77–S92 10.1017/S0031182000086133 (doi:10.1017/S0031182000086133) [DOI] [PubMed] [Google Scholar]
- 33.Rogers D. J., Hay S. I., Packer M. J. 1996. Predicting the distribution of tsetse flies in West Africa using temporal Fourier processed meteorological satellite data. Ann. Trop. Med. Parasitol. 90, 225–242 [DOI] [PubMed] [Google Scholar]
- 34.Robinson T., Rogers D., Williams B. 1997. Mapping tsetse habitat suitability in the common fly belt of southern Africa using multivariate analysis of climate and remotely sensed vegetation data. Med. Vet. Entomol. 11, 235–245 10.1111/j.1365-2915.1997.tb00401.x (doi:10.1111/j.1365-2915.1997.tb00401.x) [DOI] [PubMed] [Google Scholar]
- 35.Robinson T., Rogers D., Williams B. 1997. Univariate analysis of tsetse habitat in the common fly belt of southern Africa using climate and remotely sensed vegetation data. Med. Vet. Entomol. 11, 223–234 10.1111/j.1365-2915.1997.tb00400.x (doi:10.1111/j.1365-2915.1997.tb00400.x) [DOI] [PubMed] [Google Scholar]
- 36.Terblanche J. S., Klok C. J., Chown S. L. 2005. Temperature-dependence of metabolic rate in Glossina morsitans morsitans (Diptera, Glossinidae) does not vary with gender, age, feeding, pregnancy or acclimation. J. Insect Physiol. 51, 861–870 10.1016/j.jinsphys.2005.03.017 (doi:10.1016/j.jinsphys.2005.03.017) [DOI] [PubMed] [Google Scholar]
- 37.Terblanche J. S., Chown S. L. 2007. The effects of temperature, body mass and feeding on metabolic rate in the tsetse fly Glossina morsitans centralis. Physiol. Entomol. 32, 175–180 10.1111/j.1365-3032.2006.00549.x (doi:10.1111/j.1365-3032.2006.00549.x) [DOI] [Google Scholar]
- 38.Terblanche J. S., Clusella-Trullas S., Deere J. A., Chown S. L. 2008. Thermal tolerance in a south-east African population of the tsetse fly Glossina pallidipes (Diptera, Glossinidae): implications for forecasting climate change impacts. J. Insect Physiol. 54, 114–127 10.1016/j.jinsphys.2007.08.007 (doi:10.1016/j.jinsphys.2007.08.007) [DOI] [PubMed] [Google Scholar]
- 39.Rogers D. J., Randolph S. E. 2006. Climate change and vector-borne diseases. Adv. Parasitol. 62, 345–381 10.1016/S0065-308X(05)62010-6 (doi:10.1016/S0065-308X(05)62010-6) [DOI] [PubMed] [Google Scholar]
- 40.Anderson R. M., May R. M. 1979. Population biology of infectious diseases. I. Nature 280, 361–367 10.1038/280361a0 (doi:10.1038/280361a0) [DOI] [PubMed] [Google Scholar]
- 41.May R. M., Anderson R. M. 1979. Population biology of infectious diseases. II. Nature 280, 455–461 10.1038/280455a0 (doi:10.1038/280455a0) [DOI] [PubMed] [Google Scholar]
- 42.Heesterbeek J. A. P. 2002. A brief history of R0 and a recipe for its calculation. Acta Biotheoret. 50, 189–204 10.1023/A:1016599411804 (doi:10.1023/A:1016599411804) [DOI] [PubMed] [Google Scholar]
- 43.Anderson R. M., May R. M. C. 1991. Infectious diseases of humans: dynamics and control. Oxford, UK: Oxford University Press [Google Scholar]
- 44.Hethcote H. W. 2000. The mathematics of infectious diseases. SIAM Rev. 42, 599–653 10.1137/S0036144500371907 (doi:10.1137/S0036144500371907) [DOI] [Google Scholar]
- 45.Brun R., Blum J., Chappuis F., Burri C. 2010. Human African trypanosomiasis. The Lancet 375, 148–159 10.1016/S0140-6736(09)60829-1 (doi:10.1016/S0140-6736(09)60829-1) [DOI] [PubMed] [Google Scholar]
- 46.Wellde B., Reardon M., Kovatch R., Chumo D., Williams J., Boyce W., Hockmeyer W. T., Wykoff D. E. 1989. Experimental infection of cattle with Trypanosoma brucei rhodesiense. Ann. Trop. Med. Parasitol. 83, 133–150 [DOI] [PubMed] [Google Scholar]
- 47.Nantulya V., Musoke A., Rurangirwa F., Moloo S. 1984. Resistance of cattle to tsetse-transmitted challenge with Trypanosoma brucei or Trypanosoma congolense after spontaneous recovery from syringe-passaged infections. Infect. Immun. 43, 735. [DOI] [PMC free article] [PubMed] [Google Scholar]
- 48.van den Driessche P., Watmough J. 2002. Reproduction numbers and sub-threshold endemic equilibria for compartmental models of disease transmission. Math. Biosci. 180, 29–48 10.1016/S0025-5564(02)00108-6 (doi:10.1016/S0025-5564(02)00108-6) [DOI] [PubMed] [Google Scholar]
- 49.Paaijmans K. P., Read A. F., Thomas M. B. 2009. Understanding the link between malaria risk and climate. Proc. Natl Acad. Sci. USA 106, 13 844 –13 849. 10.1073/pnas.0903423106 (doi:10.1073/pnas.0903423106) [DOI] [PMC free article] [PubMed] [Google Scholar]
- 50.Rogers D. J. 1979. Tsetse population dynamics and distribution: a new analytical approach. J. Anim. Ecol. 48, 825–849 10.2307/4197 (doi:10.2307/4197) [DOI] [Google Scholar]
- 51.Rogers D. J. 2000. Satellites, space, time and the African trypanosomiases. Adv. Parasitol. 47, 129–171 10.1016/S0065-308X(00)47008-9 (doi:10.1016/S0065-308X(00)47008-9) [DOI] [PubMed] [Google Scholar]
- 52.Hargrove J. 2001. The effect of climate on density-independent mortality in populations of male Glossina m. morsitans in Zimbabwe and Tanzania. Bull. Entomol. Res. 91, 79–86 [PubMed] [Google Scholar]
- 53.Cossins A. R., Bowler K. 1987. Temperature biology of animals. New York, NY: Chapman and Hall [Google Scholar]
- 54.van der Have T. M., de Jong G. 1996. Adult size in ectotherms: temperature effects on growth and differentiation. J. Theoret. Biol. 183, 329–340 10.1006/jtbi.1996.0224 (doi:10.1006/jtbi.1996.0224) [DOI] [Google Scholar]
- 55.Kinghorn A., Yorke W. 1912. On the influence of meteorological conditions on the development of Trypanosoma rhodesiense in Glossina morsitans. Br. Med. J. 2, 1656. 10.1136/bmj.2.2711.1656 (doi:10.1136/bmj.2.2711.1656) [DOI] [PMC free article] [PubMed] [Google Scholar]
- 56.Desowitz R. S., Fairbairn H. 1955. The influence of temperature on the length of the developmental cycle of Trypanosoma vivax in Glossina palpalis. Ann. Tropic. Med. Parasitol. 49, 161–163 [DOI] [PubMed] [Google Scholar]
- 57.Dale C., Welburn S., Maudlin I., Milligan P. 1995. The kinetics of maturation of trypanosome infections in tsetse. Parasitology 111, 187–191 10.1017/S0031182000064933 (doi:10.1017/S0031182000064933) [DOI] [PubMed] [Google Scholar]
- 58.Williams B., Dransfield R., Brightwell R. 1990. Tsetse fly (Diptera: Glossinidae) population dynamics and the estimation of mortality rates from life-table data. Bull. Entomol. Res. 80, 479–485 10.1017/S0007485300050756 (doi:10.1017/S0007485300050756) [DOI] [Google Scholar]
- 59.Phelps R. J., Burrows P. M. 1969. Puparial duration in Glossina morsitans orientalis under conditions of constant temperature. Entomol. Experiment. Appl. 12, 33–43 10.1111/j.1570-7458.1969.tb02494.x (doi:10.1111/j.1570-7458.1969.tb02494.x) [DOI] [Google Scholar]
- 60.Hargrove J., Williams B. 1998. Optimized simulation as an aid to modelling, with an application to the study of a population of tsetse flies, Glossina morsitans morsitans (Diptera: Glossinidae). Bull. Entomol. Res. 88, 425–435 10.1017/S0007485300042164 (doi:10.1017/S0007485300042164) [DOI] [Google Scholar]
- 61.Hargrove J. 1994. Reproductive rates of tsetse flies in the field in Zimbabwe. Physiol. Entomol. 19, 307. 10.1111/j.1365-3032.1994.tb01057.x (doi:10.1111/j.1365-3032.1994.tb01057.x) [DOI] [Google Scholar]
- 62.Hide G. 1999. History of sleeping sickness in East Africa. Clin. Microbiol. Rev. 12, 112–125 [DOI] [PMC free article] [PubMed] [Google Scholar]
- 63.Hijmans R. J., Cameron S. E., Parra J. L., Jones P. G., Jarvis A. 2005. Very high resolution interpolated climate surfaces for global land areas. Int. J. Climatol. 25, 1965–1978 10.1002/joc.1276 (doi:10.1002/joc.1276) [DOI] [Google Scholar]
- 64.Wint W., Rogers D. 2000. Predicted distributions of tsetse in Africa. In Food and agriculture organization of the United Nations; Consultancy Report for the Animal Health Service of the Animal Production and Health Division of the Food and Agriculture Organization of the United Nations. Rome, Italy: FAO [Google Scholar]
- 65.Jordan A. M. 1993. Tsetse flies (Glossinidae). In Medical insects and arachnids (eds Lane R. P., Crosskey R. W.) pp. 333–388 London, UK: Chapman and Hall [Google Scholar]
- 66.Balk D. L., Deichmann U., Yetman G., Pozzi F., Hay S., Nelson A. 2006. Determining global population distribution: methods, applications and data. Adv. Parasitol. 62, 119–156 10.1016/S0065-308X(05)62004-0 (doi:10.1016/S0065-308X(05)62004-0) [DOI] [PMC free article] [PubMed] [Google Scholar]
- 67.McKay M. D., Beckman R. J., Conover W. J. 1979. A comparison of three methods for selecting values of input variables in the analysis of output from a computer code. Technometrics 21, 239–245 10.2307/1268522 (doi:10.2307/1268522) [DOI] [Google Scholar]
- 68.Blower S., Dowlatabadi H. 1994. Sensitivity and uncertainty analysis of complex models of disease transmission: an HIV model, as an example. Int. Stat. 62, 229–243 [Google Scholar]
- 69.Parmesan C., Yohe G. 2003. A globally coherent fingerprint of climate change impacts across natural systems. Nature 421, 37–42 10.1038/nature01286 (doi:10.1038/nature01286) [DOI] [PubMed] [Google Scholar]
- 70.Root T. L., Price J. T., Hall K. R., Schneider S. H., Rosenzweig C., Pounds J. A. 2003. Fingerprints of global warming on wild animals and plants. Nature 421, 57–60 10.1038/nature01333 (doi:10.1038/nature01333) [DOI] [PubMed] [Google Scholar]
- 71.Parmesan C. 2006. Ecological and evolutionary responses to recent climate change. Ann. Rev. Ecol. Evol. Syst. 37, 637–669 10.1146/annurev.ecolsys.37.091305.110100 (doi:10.1146/annurev.ecolsys.37.091305.110100) [DOI] [Google Scholar]
- 72.Pascual M., Bouma M. J. 2009. Do rising temperatures matter. Ecology 90, 906–912 10.1890/08-0730.1 (doi:10.1890/08-0730.1) [DOI] [PubMed] [Google Scholar]
- 73.Epstein P. R. 2000. Is global warming harmful to health? Scient. Am. 283, 50–57 10.1038/scientificamerican0800-50 (doi:10.1038/scientificamerican0800-50) [DOI] [PubMed] [Google Scholar]
- 74.Dobson A. 2009. Climate variability, global change, immunity, and the dynamics of infectious diseases. Ecology 90, 920–927 10.1890/08-0736.1 (doi:10.1890/08-0736.1) [DOI] [PubMed] [Google Scholar]
- 75.Welburn S. C., Fèvre E. M., Coleman P. G., Maudlin I. 2004. Epidemiology of human African trypanosomiasis. In The trypanosomiases (eds Maudlin I., Holmes P. H., Miles M. A.), pp. 219–231 Wallingford, UK: CABI Publishing [Google Scholar]
- 76.Welburn S. C., Coleman P. G., Maudlin I., Fèvre E. M., Odiit M., Eisler M. C. 2006. Crisis, what crisis? Control of Rhodesian sleeping sickness. Trends Parasitol. 22, 123–128 10.1016/j.pt.2006.01.011 (doi:10.1016/j.pt.2006.01.011) [DOI] [PubMed] [Google Scholar]
- 77.Murray M., Morrison W., Whitelaw D.1982. Host susceptibility to African trypanosomiasis: trypanotolerance. Adv. Parasitol. 21, 1–68 10.1016/S0065-308X(08)60274-2 (doi:10.1016/S0065-308X(08)60274-2) [DOI] [PubMed] [Google Scholar]
- 78.Onyango R., Van Hoeve K., De Raadt K. P. 1966. The epidemiology of Trypanosoma rhodesiense sleeping sickness in alego location, Central Nyanza, Kenya I. Evidence that cattle may act as reservoir hosts of trypanosomes infective to man. Trans. R. Soc. Tropic. Med. Hyg. 60, 175–182 10.1016/0035-9203(66)90024-1 (doi:10.1016/0035-9203(66)90024-1) [DOI] [PubMed] [Google Scholar]
- 79.Ford J. 1971. The role of trypanosomiasis in African ecology: a study of the tsetse fly problem. London, UK: Oxford University Press [Google Scholar]
- 80.Wellde B., Reardon M., Chumo D., Kovatch R., Waema D., Wykoff D., Mwangi J., Boyce W. L., Williams J. S. 1989. Cerebral trypanosomiasis in naturally-infected cattle in the Lambwe Valley, south Nyanza, Kenya. Ann. Tropic. Med. Parasitol. 83, 151–160 [DOI] [PubMed] [Google Scholar]
- 81.Waiswa C., Olaho-Mukani W., Katunguka-Rwakishaya E. 2003. Domestic animals as reservoirs for sleeping sickness in three endemic foci in south-eastern Uganda. Ann. Tropic. Med. Parasitol. 97, 149–155 10.1179/000349803235001688 (doi:10.1179/000349803235001688) [DOI] [PubMed] [Google Scholar]
- 82.Odiit M., Kansiime F., Enyaru J. 1997. Duration of symptoms and case fatality of sleeping sickness caused by Trypanosoma brucei rhodesiense in Tororo, Uganda. East Afr. Med. J. 74, 792–795 [PubMed] [Google Scholar]
- 83.Odiit M., Coleman P. G., Liu W. C., McDermott J. J., Fevre E. M., Welburn S. C., Woolhouse M. E. 2005. Quantifying the level of under-detection of Trypanosoma brucei rhodesiense sleeping sickness cases. Tropic. Med. Int. Health 10, 840–849 10.1111/j.1365-3156.2005.01470.x (doi:10.1111/j.1365-3156.2005.01470.x) [DOI] [PubMed] [Google Scholar]
- 84.Waiswa C., Picozzi K., Katunguka-Rwakishaya E., Olaho-Mukani W., Musoke R., Welburn S. 2006. Glossina fuscipes fuscipes in the trypanosomiasis endemic areas of south-eastern Uganda: apparent density, trypanosome infection rates and host feeding preferences. Acta Tropica 99, 23–29 10.1016/j.actatropica.2006.06.005 (doi:10.1016/j.actatropica.2006.06.005) [DOI] [PubMed] [Google Scholar]
- 85.Weitz B. 1963. The feeding habits of Glossina. Bull. World Health Organ. 28, 711–729 [PMC free article] [PubMed] [Google Scholar]
- 86.Clausen A., Bauer B., Salchow S. 1998. Host preferences of tsetse (Diptera: Glossinidae) based on bloodmeal identifications. Med. Vet. Entomol. 12, 169–180 10.1046/j.1365-2915.1998.00097.x (doi:10.1046/j.1365-2915.1998.00097.x) [DOI] [PubMed] [Google Scholar]
- 87.Baylis M. 1997. The daily feeding rate of tsetse (Diptera: Glossinidae) on cattle at Galana Ranch, Kenya and comparison with trypanosomiasis incidence. Acta Tropica 65, 81–96 10.1016/S0001-706X(97)00655-4 (doi:10.1016/S0001-706X(97)00655-4) [DOI] [PubMed] [Google Scholar]