

Abstract
Background
Visuoperceptual processing is impaired early in the clinical course of Alzheimer’s disease (AD). The 15-Objects Test (15-OT) detects such subtle performance deficits in Mild Cognitive Impairment (MCI) and mild AD. Reduced brain perfusion in the temporal, parietal and prefrontal regions have been found in early AD and MCI patients.
Objectives
To confirm the role of the 15-OT in the diagnosis of MCI and AD, and to investigate the brain perfusion correlates of visuoperceptual dysfunction (15-OT) in subjects with MCI, AD and normal aging.
Methods
Forty-two AD, 42 MCI and 42 healthy elderly control (EC) subjects underwent a brain Single Photon Emission Tomography (SPECT) and separately completed the 15-OT. An analysis of variance compared 15-OT scores between groups. SPM5 was used to analyse the SPECT data.
Results
15-OT performace was impaired in the MCI and AD patients. In terms of the SPECT scans, AD patients showed reduced perfusion in temporal-parietal regions, while the MCI subjects had decreased perfusion in the middle and posterior cingulate. When MCI and AD groups were compared, a significant brain perfusion reduction was found in temporo-parietal regions. In the whole sample, 15-OT performance was significantly correlated with the clinical dementia rating scores, and with the perfusion in the bilateral posterior cingulate and the right temporal pole, with no significant correlation in each separate group.
Conclusion
Our findings suggest that the 15-OT performance provides a useful gradation of impairment from normal aging to AD, and it seems to be related to perfusion in the bilateral posterior cingulate and the right temporal pole.
Keywords: Visuoperception, cerebral perfusion, brain SPECT, Mild Cognitive Impairment, Alzheimer’s disease
INTRODUCTION
Structural and functional neuroimaging has focused on the early detection of Alzheimer’s disease (AD), with a special interest in predicting conversion to dementia by those patients with Mild Cognitive Impairment (MCI) [1-9]. Functional brain imaging studies in mild AD have found significant hypometabolism and reduced cerebral blood flow in the medial temporal lobe, the temporal-parietal cortex, posterior cingulate, precuneus and dorsolateral frontal cortex [6,10-19]. Similar changes have been found in subjects with MCI using Single-Photon Emission Computed Tomography (SPECT) [7,14,20,21], and longitudinal studies have found hypoperfusion in the medial temporal lobe, the posterior cingulate gyrus and precuneus, and the parietal cortex and frontal cortex in MCI patients that later progressed to dementia [6-9].
Changes in brain structure sufficient to be detected by MRI usually follow changes in brain function and behavior (e.g., [22]), which may limit their utility in pre-symptomatic individuals. Thus, cognitive tests that challenge brain functionality may provide greater sensitivity in terms of predicting the change from MCI to AD [23]. For example, impaired performance on tests measuring visuoperception can be detected in patients with amnestic MCI, a condition that in many instances represents very early, prodromal AD [24-26], and these visuoperceptual deficits worsen with disease progression [26,27].
We have reported that the 15-Objects Test (15-OT), a relatively complex test of visuoperceptual processing, detects subtle performance deficits in MCI and mild AD patients who otherwise perform normally on measures of visual discrimination [25]. Our findings indicated that the 15-OT test is sensitive to the clinical progression of the visuoperceptual impairment associated with AD. However, in order to increase the clinical and research utility of the measure, it will be important to understand the relationship between 15-OT performance and measures of brain function.
In this study we investigated the relationship between the 15-OT and brain perfusion (SPECT) in mild AD and MCI patients. To the extent that the 15-OT is mainly a visuoperceptual task, we would predict that performance on the test would be related to perfusion in the temporo-parietal areas. Not only does the 15-OT involve visual perception [28], and thus require the parietal lobes, visual object identification has been found associated with posterior cingulate perfusion using SPECT [29]. We would thus expect that 15-OT performance would be related to cerebral perfusion along the occipito-temporo-parietal axis. This prediction is supported by the hypothesis that there is functional hierarchy in the occipital-temporal pathways in which neuronal properties shift from sensitivity to local object features to a more global and holistic representation (that is, the semantic processing) [30]. Moreover, we would expect that the pathological progression of AD from MCI would have an effect on brain perfusion in these critical regions.
The purpose of the present study was to confirm the role of the 15-OT in the diagnosis of MCI and mild AD, and to investigate the brain perfusion correlates of visuoperceptual dysfunction (as measured by the 15-OT) in subjects with MCI or AD.
METHODS
The data reported in this manuscript were obtained in compliance with the regulations of the Diagnostic Unit of Fundació ACE, and human subject research was completed in accordance with the guidelines of the Helsinki Declaration. A regional ethics committee (Clinical Investigation’s Ethical Committee from Hospital Vall d’Hebron) approved the use of human subjects for this study. Written informed consent was obtained from all control and MCI participants, and from all participants with AD and their caregivers, prior to the procedures described below.
Subjects
We studied a sample of 148 subjects divided into three groups: 51 mild AD patients, 48 MCI subjects and 49 healthy elderly controls (EC). From this original sample, we selected 126 subjects, 42 subjects per group, with equivalent ages and educational level. Age, education and gender distribution were similar among the groups (see Table 1). All subjects were assessed in the Diagnostic Unit of Fundació ACE (Barcelona, Spain), and they received a comprehensive neurobehavioral evaluation as part of their diagnostic work-up.
Table 1.
Demographic characteristics of the participants.
| EC | MCI | AD | Statistics | p | |
|---|---|---|---|---|---|
| N | 42 | 42 | 42 | ||
| Sex n (%) Male | 33.3 | 31 | 26.2 | 0.528 1 | 0.768 |
| Education (n (%)) | |||||
| ▪Middle/Elementary school | 26.2 | 23.8 | 28.6 | ||
| ▪High School/Associate degree | 33.3 | 31 | 16.7 | 8.06 1 | 0.234 |
| ▪Bachelor’s degree | 23.8 | 11.9 | 16.7 | ||
| ▪Less than 3 years | 16.7 | 33.3 | 33.1 | ||
| Age in years (mean/SD) | 74.7/4.4 | 76.8/4.3 | 76.4/4.5 | 2.73 2 | 0.069 |
EC: Elderly Controls; MCI: Mild Cognitive Impairment; AD: Alzheimer’s disease.
MMSE: Mini-Mental State Examination; 15-OT: The 15-Objects test; SD: Standard deviation; 1χ2; 2F.
The AD patients met the National Institute of Neurological and Communicative Disorders and Stroke-Alzheimer’s Disease and Related Disorders Association (NINCDS/ADRDA) criteria for Probable AD [31]. All AD patients had a clinical dementia rating (CDR) score of 1, indicating a mild degree of dementia. All AD patients were taking stable doses of acetylcholinesterase inhibitors (AChEIs) for at least 2 months prior to the study.
The MCI patients fulfilled Petersen’s diagnostic criteria [32], including subjective memory complaints, normal general cognition, preserved performance in activities of daily living, absence of dementia and a measurable impairment in memory function, with or without deficit in other cognitive domains (MCI amnestic single domain or MCI amnestic multiple domain) [33]. All MCI subjects had a CDR rating of 0.5 and none were taking any dementia medication (i.e., AChEIs or memantine).
The control subjects included the patients’ spouses, friends or relatives who agreed to participate. They had no cognitive complaints or other neurologic symptoms reported either by the participant or an informant, and there was no evidence by history of functional impairment due to declining cognition. All of the control subjects had Mini-Mental State Examination (MMSE) [34] scores of at least 26 (the lower limit of the normal range in the Spanish population older than 70 [35]), and normal performance on the neuropsychological battery (detailed elswhere [25] and the RBANS visual memory subtest [36]). Although most of the control subjects did not have any CT or MRI, the subjects were considered as controls when the neurological and neuropsychological exams were normal.
For the whole sample, exclusion criteria were: age younger than 65 years, illiteracy, presence of moderate depressive symptoms (Geriatric Depression Scale ≥10) [37], major depression or other DSM-IV Axis-I psychiatric disorder (except for dementia), neurological disease (other than dementia), structural focal lesion on CT imaging (stroke or tumors, brain traumatic injury, moderate leukoaraiosis or more than one lacunae), history of alcohol or other substance abuse, severe visual abnormalities including glaucoma or cataracts, or significant aphasia.
Neuropsychological assessment
In the 15-OT [38], the subjects were shown a card with 15 overlapping line drawings of common objects. They were asked to say aloud the names of all of the objects that they could see on the card, and the number of correct responses was recorded. Subjects were allowed to take as much time as they needed to identify as many objects as they could. Errors or misidentifications were also recorded (that is, the incorrect interpretation of an object or the incorrect interpretation of a part of an object). To limit the influence of impaired naming, when subjects were unable to name an object that they had correctly identified (i.e., if they were able to define or describe the object), the answer was taken as correct (i.e., “To play tennis” instead of “A racquet”).
As we explained in a previous study [25], the 15-OT was developed by Pillon and coworkers [38] to assess the slowing of cognitive processing (measuring the time needed to complete the task) in Parkinson’s disease (PD), and until our previous study it had only been used in patients with PD [38, 39, 40] and Huntington’s disease [41, 42]. We were the first to use response accuracy of the 15-OT as a measure of performance, and we did so because of the lack of a similar visuoperceptual test to detect subtle changes in the mild stages of AD [25]. Although the 15-OT has not specifically been validated as a visuoperceptual test, it is based on the Poppelreuter paradigm which accurately explores visuoperceptive abilities [28].
The neuropsychological battery administered in the diagnostic procedure included tests sensitive to orientation, attention, verbal learning and memory, language, visual gnosis, praxis and executive functions (see [25] for details) and visual memory (the RBANS visual memory subtest [36]). The MMSE [34] was used as a measure of global cognition. Moreover, depressive symptoms were assessed with the Geriatric Depression Scale [37].
Brain SPECT procedure
Within three weeks following the clinical assessment, a brain SPECT was performed. After lying supine in quiet surroundings, each subject received an intravenous injection of 740 MBq 99mTc-ECD (Neurolite®, Bristol-Myers Squibb). The SPECT acquisition began between 30 and 120 minutes after intravenous injection, in a double-headed gamma camera (Siemens e-Cam) equipped with low-energy, high-resolution collimators. The SPECT acquisition consisted in 30 seconds frames, 1 image / 3°, format 128×128. The studies were reconstructed using filtered back projection (Butterworth 0.4 – 0.5, cut off 7), without Chang attenuation correction.
Image VBM analysis
A voxel-level analysis was performed using Statistical Parametric Mapping (SPM5, using non-attenuation corrected studies), running on Matlab 7.2 (Mathworks Inc, Sherborn, MA). Images were initially converted from DICOM to Analyze format using MRIcro (http://www.mricro.com), and transferred to SPM5. The images were normalized to the Montreal Neurological Institute atlas, and the dimensions of the resulting voxels were 3×3×3 mm. Between-group analyses were performed using ANOVA with the proportional scaling normalization routine to control for individual variation in global brain perfusion. The SPM {T} maps were obtained using a cluster and voxel level threshold corrected for multiple comparisons using a False Discovery Rate (FDR of p< 0.05) [43] and were corregistered to the MRI T1 template from SPM to locate the cluster areas.
Region of interest (ROI) analyses were performed with those clusters that showed significant brain perfusion differences between controls and AD patients using the WFU-Pickatlas software toolbox (http://fMRi.wfubuc.edu/CMS/software). The PickAtlas software toolbox [44, 45] provides a method for generating ROI masks based on the Talairach Daemon database [46, 47], using Brodmann areas, Lobes, Hemispheres, Anatomic Labels (gyral anatomy) and Tissue Type. The atlases have been extended to the vertex in the Montreal Neurological (MNI) space. Eigenvariates were extracted at the peak voxels for identified clusters using the Volume of Interest (VOI) tool within SPM5.
Statistical analysis
Statistical analysis of the clinical variables was performed using SPSS for Windows (version 15.0; SPSS Inc., Chicago, Ill). An analysis of variance (ANOVA) and post-hoc analyses (Bonferroni) were used to compare sociodemographic, clinical and neuropsychological data between the three groups. Pearson’s correlation tests were performed between the 15-OT scores and CDR, MMSE, neuropsychological tests and SPECT data. A linear multiple regression analysis, using the stepwise procedure, was performed to determine which neuropsychological tests were able to predict performance on the 15-OT. Moreover, a Component Analysis with Varimax rotation was carried out using the variables that correlated with the 15-OT in the case of clinical groups.
RESULTS
The scores of the subjects on the neuropsychological tests are shown in Table 2. Performance on the MMSE were progressively lower from EC to MCI and AD patients (see Table 2). The 15-OT performance was significantly different between groups. Scores of MCI and AD patients were significantly lower than those of controls, and the MCI subjects performed significantly better than the AD patients. In the whole sample, the 15-OT performance was significantly correlated with the CDR (r= −0.63; p< 0.001) and the MMSE (r= 0.67; p< 0.001) scores. As detailed in Table 3, the performance of the MCI and AD patients on the 15-OT was highly correlated with performance on the Poppelreuter test, and the measures of visual naming and phonetic verbal fluency.
Table 2.
Neuropsychological performances of the study subjects.
| EC | MCI | AD | F (2, 125) | |
|---|---|---|---|---|
| N (male, female) | 42 (14,28) | 42 (13,29) | 42 (11,31) | |
| 15-OT correct answers | 13.48 (1.33) | 11.14 (2.10) | 9.83 (1.96) | 42.751,2,3 |
| 15-OT errors | 1.45 (1.21) | 3.26 (1.93) | 4.10 (1.34) | 32.961,2,3 |
| Orientation | ||||
| Temporal | 4.98 (0.15) | 3.81 (1.23) | 2.45 (1.48) | 53.571,2,3 |
| Spatial | 5.00 (0.00) | 4.95 (0.22) | 4.88 (0.33) | 2.94 |
| Personal | 5.00 (0.00) | 4.88 (0.33) | 4.45 (0.74) | 15.982,3 |
| Memory | ||||
| Learning Trial 1 WMS-III | 4.79 (1.49) | 3.07 (1.40) | 2.55 (1.25) | 29.961,2 |
| Trial 4 WMS-III | 10.21 (1.37) | 5.98 (1.60) | 4.62 (1.19) | 183.391,2,3 |
| Delayed Recall WMS-III | 8.38 (2.02) | 1.26 (1.40) | 0.17 (0.66) | 386.541,2,3 |
| Visual memory RBANS | 7.62 (1.91) | 3.12 (2.41) | 1.00 (1.54) | 121.241,2,3 |
| Digit Span Forward | 7.86 (1.75) | 7.21 (1.75) | 6.76 (1.49) | 4.582 |
| Digit Span Backwards | 4.95 (1.77) | 4.21 (1.51) | 3.48 (1.40) | 9.342 |
| Praxis | ||||
| Ideomotor | 4.00 (0.00) | 3.95 (0.22) | 3.93 (0.26) | 1.46 |
| Construction | 3.88 (0.33) | 3.14 (1.12) | 2.55 (1.36) | 17.471,2,3 |
| Imitation | 3.95 (0.22) | 3.36 (0.91) | 2.43 (1.11) | 35.491,2,3 |
| Language | ||||
| Comprehension | 6.00 (0.00) | 5.81 (0.40) | 5.62 (0.66) | 7.692 |
| Repetition | 4.00 (0.00) | 4.00 (0.00) | 3.98 (0.15) | 1.00 |
| Visual Naming (15-BNT) | 14.79 (0.52) | 13.38 (1.68) | 12.26 (2.32) | 23.801,2,3 |
| Visual gnosis | ||||
| Poppelreuter test | 9.83 (0.49) | 9.19 (0.94) | 8.83 (1.58) | 8.951,2 |
| Luria’s Clock test* | 3.69 (0.52) | 2.71 (0.92) | 2.12 (1.06) | 35.361,2,3 |
| Executive functions | ||||
| SKT errors | 0.62 (1.01) | 2.17 (2.58) | 4.02 (5.45) | 9,772 |
| Phonetic verbal fluency | 14.64 (4.11) | 11.19 (4.43) | 11.43 (4.57) | 8.161,2 |
| Semantic verbal fluency | 18.19 (4.08) | 11.81 (3.24) | 10.83 (4.07) | 46.011,2 |
| Abstract Reasoning | 11.62 (1.64) | 9.33 (2.75) | 8.19 (2.37) | 24.231,2 |
| Global cognition | ||||
| Clock Test# | 6.90 (0.37) | 5.45 (1.64) | 4.76 (2.09) | 20.901,2 |
| MMSE score | 29.40 (0.94) | 25.71 (1.99) | 23.00 (2.20) | 134.891,2,3 |
EC: Elderly Controls; MCI: Mild Cognitive Impairment; AD: Alzheimer’s disease. 15-OT: The 15-Objects test; WMS-III: Wechsler Memory Scale-III; 15-BNT: 15 items abreviated Boston Naming Test; SKT: Automatic Inhibition subtest of the Syndrom Kurtz Test (number of errors); MMSE: Mini-Mental State Examination.
Significant differences between EC and MCI;
Significant differences between EC and AD;
Significant differences between MCI and AD.
Luria’s Clock test refers to the Clock test from the Luria-Nebraska Neuropsychological Battery (LNNB) [48]
Clock test is included as part of the Spanish version of the 7 Minute Screening neurocognitive battery [49].
Table 3.
Correlations between the scores obtained on the 15-OT and the main neuropsychological tests.
| 15-OT | Learning | Delayed Recall |
Poppelreuter | SKT time |
Visual Naming |
Phonetic verbal fluency |
Semantic verbal fluency |
Abstract Reasoning |
MMSE | |
|---|---|---|---|---|---|---|---|---|---|---|
| 15-OT | - | 0.29 | 0.18 | 0.05 | −0.24 | 0.26 | 0.23 | 0.12 | 0.20 | 0.54** |
| Learning | 0.15 0.15 |
- | 0.61** | 0.05 | −0.47** | 0.25 | 0.20 | 0.47** | 0.26 | 0.34* |
| Delayed Recall | 0.09 0.13 |
0.39** 0.21 |
- | −0.01 | −0.14 | 0.15 | −0.08 | 0.25 | 0.17 | 0.25 |
| Poppelreuter | 0.49** 0.49** |
−0.00 0.16 |
0.09 −0.18 |
- | 0.08 | 0.14 | −0.25 | 0.11 | 0.16 | 0.20 |
| SKT time | −0.37* −0.01 |
−0.23 −0.10 |
0.04 0.13 |
−0.13 −0.02 |
- | −0.33* | −0.42** | −0.53** | −0.053** | −0.09 |
| Visual Naming | 0.41** 0.48** |
0.16 0.37* |
0.14 −0.09 |
0.34* 0.66** |
−0.21 −0.24 |
- | 0.26 | 0.39* | 0.36* | 0.13 |
| Phonetic verbal fluency |
0.41** 0.53** |
0.33* 0.17 |
0.10 0.49 |
0.29 0.20 |
−0.46** −0.47** |
0.32* 0.55** |
- | 0.49** | 0.21 | −0.01 |
| Semantic verbal fluency |
0.18 0.10 |
0.11 | 0.20 0.18 −0.06 |
0.12 0.23 |
−0.14 −0.23 |
0.38* 0.42** |
0.18 0.41** |
- | 0.26 | 0.20 |
| Abstract Reasoning |
0.49** 0.16 |
0.38* 0.18 |
0.19 0.03 |
0.35* −0.06 |
−0.39* −0.37* |
0.58** 0.32* |
0.56** 0.40** |
0.21 0.30 |
- | 0.20 |
| MMSE | 0.37* 0.20 |
0.41** 0.27 |
0.30 0.22 |
0.19 0.23 |
−0.34* −0.20 |
0.28 0.44** |
0.26 0.18 |
0.36* 0.14 |
0.43** 0.40** |
- |
In the upper-right side are reported correlations obtained for the controls; in the lower-left side are correlations obtained for MCI and AD (in italics).
p < 0.05;
p < 0.01.
15-OT: The 15-Objects test; SKT: Automatic Inhibition subtest of the Syndrom Kurtz Test (time);MMSE: Mini-Mental State Examination.
The control group and patients (MCI and AD groups) differed on the relationship between the 15-OT and the other neuropsychological tests. The sense of the correlation values between the 15-OT and the other cognitive tests was the same in the three groups, but in the control group only the MMSE reached the significance. The other correlations were small. Probably, these results were partially determined by a ceiling effect in this group (table 3).
The variables related to visuoperception and language were introduced in the a linear regression analysis to examine the influence of semantic knowledge and visuoperceptual functions on the performance of the 15-OT. We also took into account the results of preliminary correlation analyses between the 15-OT and the neuropsychological tests. The stepwise linear multiple regression analysis (including the 15-BNT, phonetic and semantic verbal fluency, and Poppelreuter tests) executed on the clinical sample (MCI and AD) showed that only phonetic verbal fluency (ß= 0.35, p= 0.0005) and the Poppelreuter test (ß= 0.41; p= 0.0005) were related to the 15-OT. Moreover, a Principal Component Analysis with Varimax rotation was carried out in the MCI and AD patients using the variables that correlated with the 15-OT (See Table 3). The best solution included three dimensions that explained 70.4% of the variance. The first dimension included high factor loadings for the Poppelreuter test (0.85), 15-OT (0.80) and BNT (0.67). The second factor included memory (0.88) and learning (0.79) and the third factor was constituted by phonetic (0.90) and semantic verbal fluencies (0.60).
Significant hypoperfusion was found in AD patients compared to controls in the temporal pole (bilaterally), the parahippocampal gyrus (right), middle and posterior cingulate (bilaterally), angular gyrus, supramarginal gyrus and inferior parietal lobe (right). Compared to MCI subjects, AD patients showed significant brain perfusion reduction in the same areas as the EC-AD comparison, except for bilateral middle and posterior cingulate. This latter structure was the only one found to be significantly hypoperfused in MCI compared to EC (Table 4 and Figure 1).
Table 4.
Brain areas showing significantly lower perfusion in mild AD and MCI patients compared to controls.
| Group comparison |
Region | Cluster size (num.voxels) |
Coordinates (X, Y, Z) |
Z scores of maximum |
p(FDR) Cluster |
p(FDR) Voxel |
|---|---|---|---|---|---|---|
| AD<EC | Temporal pole and parahippocampal (R) | 418 | 45 21 −21 | 5.52 | 0.0001 | 0.001 |
| Angular gyrus, parietal, supramarginalis (R) | 200 | 45 −57 39 | 4.65 | 0.002 | 0.004 | |
| Temporal pole (L) | 86 | −36 18 −27 | 4.02 | 0.055 | 0.015 | |
| Middle and posterior cingulate (Bil) | 73 | 0 −42 33 | 4.46 | 0.083 | 0.006 | |
| MCI<EC | Middle and posterior cingulate (Bil) | 63 | −3 −42 36 | 4.33 | 0.022 | 0.004 |
| (ROI) | ||||||
| AD<MCI | Temporal pole and parahippocampal (R) | 226 | 51 21 −9 | 4.16 | 0.014 | 0.005 |
| (ROI) | Angular gyrus, parietal, supramarginalis (R) | 173 | 60 −51 24 | 3.94 | 0.013 | 0.011 |
| Temporal pole (L) | 167 | −51 21 −12 | 3.67 | 0.048 | 0.016 |
AD: Alzheimer’s disease; EC: Elderly Controls; MCI: Mild Cognitive Impairment; ROI: Regions of interest; R: right; L:left; Bil: Bilateral.
Figure 1.
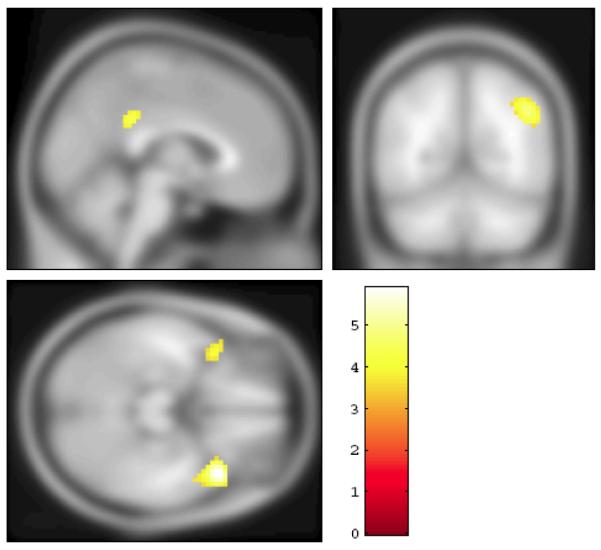
The section rendering of the contrast between the EC and AD groups (SPECT images) projected onto the T1 template image from SPM5. The areas marked in yellow have significantly higher flow in the EC group compared to the AD patients (FDR= 0.05, extent threshold 100 voxels).
The perfusion levels of the MCI patients fell between those of the EC and AD groups. The data from the eigenvariates for the five regions identified in the EC/AD contrast were entered into a MANCOVA, with age as a covariate. The overall model was significant (Hotellings F(10, 234)= 110.3, p<0.001). The differences between all of the groups were significant in each of the five brain regions (p< 0.001) (see Figure 2).
Figure 2.

The mean and standard deviations of the eigenvariates derived from the SPM5 analysis. The values were taken at the peak voxel, with an area including a sphere of 1 voxel radius. The standard deviation was taken from the MANCOVA (controlling for age) and is group-specific.
The differences between all of the groups were significant in each of the five brain regions (p< 0.001).
The correlation between 15-OT performance and perfusion in all 126 participants revealed that regions of the posterior cingulate and the pole of the right temporal lobe were significantly linked to succesful performance. The eigenvariates from these regions were significantly correlated (p< 0.001) with the 15-OT (temporal pole r= 0.48; posterior cingulate r= 0.55), the abbreviated 15-BNT (temporal pole r= 0.40; posterior cingulate r= 0.46), the Poppelreuter test (temporal pole r= 0.34; posterior cingulate r= 0.37) and the MMSE scores (temporal pole r= 0.68; posterior cingulate r= 0.72) even after adjusting for age. As shown graphically in Figure 3, the performance on the 15-OT was more accurate among those MCI patients with higher eigenvariates in the posterior cingulate. However, no significant correlations were found in any of the individual groups. The EC and AD groups did not show statistically significant correlations likely due to ceiling and floor effects.
Figure 3.

Scatterplots of performance on the MMSE (left panel) and the 15-OT (right panel) as a function of the eigenvariate from the posterior cingulate gyrus region of interest. Each point represents a single subject in each group, and the lines represent the best-fit regression lines for each group.
The green lines represent the EC group, the orange the MCI, and the red AD.
DISCUSSION
The results of the present study confirm and extend our understanding of the neuropsychological deficits in MCI and AD, and their neuroanatomical correlates. We replicated our prior findings that performance on the 15-OT is progressively less accurate as subjects move from normal cognition through MCI to AD [25]. Second, we found that performance on the 15-OT was highly related to performance on the Poppelreuter test, and measures of visual naming and phonetic verbal fluency. The 15-OT was also linked to perfusion in the posterior cingulate and anterior temporal cortices. Third, subjects with MCI showed decreased brain perfusion in the posterior cingulate that was between that of the EC and AD groups.
We interpret the pattern of correlations between 15-OT performance and both cerebral perfusion and neuropsychological tests, as reflecting two separate, but related, processes (that is, dementia severity and semantic networks). The first is related to overal dementia severity, and is reflected in the perfusion in the posterior cingulate gyrus. Alteration of the temporal-parietal cortex and posterior cingulate gyrus are strong predictors of conversion to AD from MCI [1, 50]. Longitudinal studies have reported brain perfusion reduction of the posterior cingulate gyrus and precuneus in those MCI subjects who converted to AD [6, 7, 51]. Further, the decreasing perfusion in the posterior cingulate may reflect alterations in the default mode network [51, 52] which is down-regulated in AD. Thus, as posterior cingulate perfusion decreases with increasing severity of the degenerative process, performance on the 15-OT declines. Alternatively, visuoconstructional and visuoperceptual functions may be affected by decreased posterior cingulate perfusion [29]. In addition, we found that performances on the15-OT and another recognized visuoperceptual test (Poppelreuter) were highly related in MCI and AD patients. However, as the degree of atrophy and dysfunction in the posterior cingulate is related to severity of AD [53], we believe that the most parsimonious explanation of these findings is that they reveal the link between 15-OT performance and overall clinical state. In this regard, in our sample the 15-OT was found highly related to the CDR and MMSE scores, which reflects dementia severity.
In terms of the correlation between the 15-OT performances and the 15-BNT scores and the anterior temporal lobe perfusion, there is evidence that this part of the ventral processing stream [54] is involved in processing semantic information [55]. This part of the temporal lobe is generally not affected early in the course of AD and MCI [56], so perhaps the correlation reflects the demands of the 15-OT, in particular identifying objects from a field of overlapping visual information. Moreover, in our clinical sample, the Principal Components Analysis showed that the 15-OT was included in the same dimention than the visuoperceptual (Poppelreuter) and visual naming (15-BNT) tests.
Obviously, these interpretations of the data are speculative, and they must be tested with longitudinal data. If they are correct, we would predict that change in the 15-OT performance would be related to change in perfusion in the posterior cingulate and right temporal pole. As clinical disease becomes more severe, we might find that other brain regions are linked to performance, but our hypotheses require that we are able to predict performance change from these specific alterations in regional perfusion.
Scores on the 15-OT were abnormal in the MCI and AD patients, and the performance deficits were more severe in the AD group relative to the MCI group. Thus, this neuropsychological test provides a useful gradation of visuoperceptual impairment. These findings, in combination with other studies, strongly suggest that MCI may be early identified in elderly using an exhaustive assessment of cognitive functions rather than simply focusing on memory [24, 57-59].
Our SPECT findings are also consistent with previous studies using PET [15, 16, 18] and SPECT [6, 13, 17, 51]. The AD patients had significant hypoperfusion in the temporal lobes, in parietal cortex including the precuneus and angular gyrus, and cingulate. The reductions in perfusion may reflect cortical atrophy and the disconnection of these cerebral regions from the mesial temporal lobe [60].
There are several aspects of this study that need to be kept in mind when interpreting the data. First, the SPECT imaging was done with the subjects at rest and the 15-OT data were obtained at a different time. As such, the correlations between the 15-OT and the SPECT have to be interpreted with caution. Second, we did not have anatomical MRI scans from these subjects. Consequently, although all of the data were spatially normalized to a standard template, we did not perform any atrophy correction. Thus, some of our results may have been related to focal regional atrophy and we cannot determine which structural changes can explain the functional ones. A major concern in the interpretation of the results of the SPECT studies in our healthy elderly control subjects is the absence of structural imaging. Normal cognitive performance could have occurred because of functional compensation despite morphological abnormalities.
In conclusion, our findings suggest that the 15-OT performance provides a useful gradation of impairment from normal aging to AD, and it seems to be related to perfusion in the bilateral posterior cingulate and the right temporal pole. Further longitudinal studies are needed to determine if those amnestic MCI subjects, even healthy elderly, with combined lower performances on the 15-OT and hypoperfusion in some cerebral areas have an increased risk of conversion to AD.
ACKNOWLEDGEMENTS
This study was supported by the Spanish Ministry of Health (FISS PI070739) from Instituto de Salud Carlos III (Madrid), and by the University of Pittsburgh Alzheimer’s Disease Research Center (AG05133).
REFERENCES
- [1].Bell-McGinty S, Lopez OL, Meltzer CC, Scanlon JM, Whyte EM, DeKosky ST, Becker JT. Differential cortical atrophy in subgroups of mild cognitive impairment. Arc Neurol. 2005;62:1393–1397. doi: 10.1001/archneur.62.9.1393. [DOI] [PubMed] [Google Scholar]
- [2].Devanand DP, Pradhaban G, Liu X, Khandji A, De Santi S, Segal S, Rusinek H, Pelton GH, Honig LS, Mayeux R, Stern Y, Tabert MH, de Leon MJ. Hippocampal and entorhinal atrophy in mild cognitive impairment: prediction of Alzheimer disease. Neurology. 2007;68:828–836. doi: 10.1212/01.wnl.0000256697.20968.d7. [DOI] [PubMed] [Google Scholar]
- [3].Whitwell JL, Josephs KA, Murray ME, Kantarci K, Przybelski SA, Weigand SD, Vemuri P, Senjem ML, Parisi JE, Knopman DS, Boeve BF, Petersen RC, Dickson DW, Jack CR. MRI correlates of neurofibrillary tangle pathology at autopsy: A voxel-based morphometry study. Neurology. 2008;71:743–749. doi: 10.1212/01.wnl.0000324924.91351.7d. [DOI] [PMC free article] [PubMed] [Google Scholar]
- [4].Karas G, Sluimer J, Goekoop R, van der Flier W, Rombouts SARB, Vrenken H, Scheltens P, Fox N, Barkhof F. Amnestic mild cognitive impairment: Structural MR Imaging findings predictive of conversion to Alzheimer disease. AJNR Am J Neuroradiol. 2008;29:944–949. doi: 10.3174/ajnr.A0949. [DOI] [PMC free article] [PubMed] [Google Scholar]
- [5].Desikan RS, Cabral HJ, Fischl B, Guttmann CR, Blacker D, Hyman BT, Albert MS, Killiany RJ. Temporoparietal MR imaging measures of atrophy in subjects with mild cognitive impairment that predict subsequent diagnosis of Alzheimer disease. Am J Neuroradiol. 2009;30:532–538. doi: 10.3174/ajnr.A1397. [DOI] [PMC free article] [PubMed] [Google Scholar]
- [6].Matsuda H, Kitayama N, Ohnishi T, Asada T, Nakano S, Sakamoto S, Imabayashi E, Katoh A. Longitudinal evaluation of both morphologic and functional changes in the same individuals with Alzheimer’s disease. J Nucl Med. 2002;43:304–311. [PubMed] [Google Scholar]
- [7].Hirao K, Ohnishi T, Hirata Y, Yamashita F, Mori T, Moriguchi Y, Matsuda H, Nemoto K, Imabayashi E, Yamada M, Iwamoto T, Arima K, Asada T. The prediction of rapid conversion of Alzheimer’s disease in mild cognitive impairment using regional cerebral blood flow SPECT. Neuroimage. 2005;28:1014–1021. doi: 10.1016/j.neuroimage.2005.06.066. [DOI] [PubMed] [Google Scholar]
- [8].Wolf H, Jelic V, Gertz HJ, Nordberg A, Julin P, Wahlund LO. A critical discussion of the role of neuroimaging in mild cognitive impairment. Acta Neurol Scand Suppl. 2003;179:52–76. doi: 10.1034/j.1600-0404.107.s179.10.x. [DOI] [PubMed] [Google Scholar]
- [9].Nobili F, De Carli F, Frisoni GB, Portet F, Verhey F, Rodriguez G, Caroli A, Touchon J, Morbelli S, Guerra UP, Dessi B, Brugnolo A, Visser PJ. SPECT predictors of cognitive decline and Alzheimer’s disease in mild cognitive impairment. J Alzheimers Dis. 2009;17:761–772. doi: 10.3233/JAD-2009-1091. [DOI] [PubMed] [Google Scholar]
- [10].Wang H, Golob E, Bert A, Nie K, Chu Y, Dick MB, Mandelkern M, Su MY. Alterations in regional brain volume and individual MRI-Guided perfusion in normal control, stable mild cognitive impairment, and MCI-AD converter. J Geriatr Psychiatry Neurol. 2009;22:35–45. doi: 10.1177/0891988708328212. [DOI] [PubMed] [Google Scholar]
- [11].Nobili F, Salmaso D, Morbelli S, Girtler N, Piccardo A, Brugnolo A, Dessi B, Larsson SA, Rodriguez G, Pagani M. Principal compent analysis of FDG PET in amnestic MCI. Eur J Nucl Med Imaging. 2008a;35:2191–2202. doi: 10.1007/s00259-008-0869-z. [DOI] [PubMed] [Google Scholar]
- [12].Pearlson GD, Harris GJ, Powers RE, Barta PE, Camargo EE, Chase GA, Noga JT, Tune LE. Quantitative changes in mesial temporal volume, regional cerebral blood flow, and cognition in Alzheimer’s disease. Arch Gen Psychiatry. 1992;49:402–408. doi: 10.1001/archpsyc.1992.01820050066012. [DOI] [PubMed] [Google Scholar]
- [13].Encinas M, De Juan R, Marcos A, Gil P, Barabash A, Fernández C, De Hugarte C, Cabranes JA. Regional cerebral blood flow assessed with 99mTc-ECD SPET as a marker of progression of mild cognitive impairment to Alzheimer’s disease. Eur J Nucl Med Mol Imaging. 2003;30:1473–1480. doi: 10.1007/s00259-003-1277-z. [DOI] [PubMed] [Google Scholar]
- [14].Johnson KA, Jones K, Holman BL, Becker JA, Spiers PA, Satlin A, Albert MS. Preclinical prediction of Alzheimer’s disease using SPECT. Neurology. 1998;50:1563–1571. doi: 10.1212/wnl.50.6.1563. [DOI] [PubMed] [Google Scholar]
- [15].Minoshima S, Giordani B, Berent S, Frey KA, Foster NL, Kuhl DE. Metabolic reduction in the posterior cingulate cortex in very early Alzheimer’s disease. Ann Neurol. 1997;42:85–94. doi: 10.1002/ana.410420114. [DOI] [PubMed] [Google Scholar]
- [16].Ishii K, Sasaki M, Yamaji S, Kitagaki H, Mori E. Demonstration of decreased posterior cingulated perfusion in mild Alzheimer’s disease by means of H215O positron emission tomography. Eur J Nucl Med. 1997;24:670–673. doi: 10.1007/BF00841407. [DOI] [PubMed] [Google Scholar]
- [17].Ashford JW, Shih WJ, Coupal J, Shetty R, Schneider A, Cool C, Aleem A, Kiefer VH, Mendiondo MS, Schmitt FA. Single SPECT measures of cerebral cortical perfusion reflect time-index estimation of dementia severity in Alzheimer’s disease. J Nucl Med. 2000;41:57–64. [PubMed] [Google Scholar]
- [18].Ibañez V, Pietrini P, Alexander GE, Furey ML, Teichberg D, Rajapakse JC, Rapoport SI, Schapiro MB, Horwitz B. Regional glucose metabolic abnormalities are not the results of atrophy in Alzheimer’s disease. Neurology. 1998;50:1585–1593. doi: 10.1212/wnl.50.6.1585. [DOI] [PubMed] [Google Scholar]
- [19].Nestor PJ, Cine D, Fryer TD, Clarke J, Hodges JR. The topography of metabolic deficits in posterior cortical atrophy (the visual variant of Alzheimer’s disease) with FDG-PET. J Neurol Neurosurg Psychiatry. 2003;74:1521–1529. doi: 10.1136/jnnp.74.11.1521. [DOI] [PMC free article] [PubMed] [Google Scholar]
- [20].Kogure D, Matsuda H, Ohnishi T, Asada T, Uno M, Kunihiro T, Nakano S, Takasaki M. Longitudinal evaluation of early Alzheimer’s disease using brain perfusion SPECT. J Nucl Med. 2000;41:1155–1162. [PubMed] [Google Scholar]
- [21].Nobili F, Frisoni GB, Portet F, Verhey F, Rodriguez G, Caroli A, Touchon J, Calvini P, Morbelli S, De Carli F, Guerra UP, Van de Pol LA, Visser PJ. Brain SPECT in subtypes of mild cognitive impairment. Findings from the DESCRIPA multicenter study. J Neurol. 2008b;255:1344–1353. doi: 10.1007/s00415-008-0897-4. [DOI] [PubMed] [Google Scholar]
- [22].Chételat G, Desgranges B, Eustache F. Brain profile of hypometabolism in early Alzheimer’s disease: relationships with cognitive deficits and atrophy] Rev Neurol. 2006;162:945–951. doi: 10.1016/s0035-3787(06)75104-9. [DOI] [PubMed] [Google Scholar]
- [23].Fleischer AD, Sun S, Taylor C, Ward CP, Gamst AC, Petersen RC, Jack CR, Aisen RS, Thal LJ. Volumetric MRI vs clinical predictors of Alzheimer disease in mild cognitive impairment. Neurology. 2008;70:191–199. doi: 10.1212/01.wnl.0000287091.57376.65. [DOI] [PubMed] [Google Scholar]
- [24].Nordlund A, Rolstad S, Hellström P, Sjögren M, Hansen S, Wallin A. The Goteborg MCI study: mild cognitive impairment is a heterogeneous condition. J Neurol Neurosurg Psychiatry. 2005;76:1485–1490. doi: 10.1136/jnnp.2004.050385. [DOI] [PMC free article] [PubMed] [Google Scholar]
- [25].Alegret M, Boada-Rovira M, Vinyes-Junqué G, Valero S, Espinosa A, Hernández I, Modinos G, Rosende-Roca M, Mauleón A, Becker JT, Tárraga L. Detection of visuoperceptual deficits in preclinical and mild Alzheimers disease. J Clin Exp Neuropsychol. 2009;31:860–867. doi: 10.1080/13803390802595568. [DOI] [PMC free article] [PubMed] [Google Scholar]
- [26].Johnson DK, Storandt M, Morris JC, Calvin JE. Longitudinal study of the transition from healthy aging to Alzheimer Disease. Arch Neurol. 2009;66:1254–1259. doi: 10.1001/archneurol.2009.158. [DOI] [PMC free article] [PubMed] [Google Scholar]
- [27].Paxton JL, Peavy GM, Jenkins C, Rice VA, Heindel WC, Salmon DP. Deterioration of visual-perceptual organization in Alzheimer’s disease. Cortex. 2007;43:967–975. doi: 10.1016/s0010-9452(08)70694-4. [DOI] [PubMed] [Google Scholar]
- [28].Lezak MD, Howieson DB, Loring DW. Neuropsychological Assessment. 4th ed Oxford University Press; New York: 2004. [Google Scholar]
- [29].Tippett WJ, Black SE. Regional cerebral blood flow correlated of visuospatial tasks in Alzheimer’s disease. J Int Neuropsychol Soc. 2008;14:1034–1045. doi: 10.1017/S1355617708081241. [DOI] [PubMed] [Google Scholar]
- [30].Lerner Y, Hendler T, Ben-Bashat D, Harel M, Malach R. A hierarchical axis of object processing stages in the human visual cortex. Cereb Cortex. 2001;11:287–297. doi: 10.1093/cercor/11.4.287. [DOI] [PubMed] [Google Scholar]
- [31].McKhann G, Drachman D, Folstein M, Katzman R, Price D, Stadlan EM. Clinical diagnosis of Alzheimer’s disease: report of the NINCDS-ADRDA Work Group under the auspices of Department of Health and Human Services Task Force on Alzheimer’s Disease. Neurology. 1984;34:939–944. doi: 10.1212/wnl.34.7.939. [DOI] [PubMed] [Google Scholar]
- [32].Petersen RC, Smith GE, Waring SC, Ivnik RJ, Tangalos EG, Kokmen E. Mild cognitive impairment. Clinical characterization and outcome. Arch Neurol. 1999;56:303–308. doi: 10.1001/archneur.56.3.303. [DOI] [PubMed] [Google Scholar]
- [33].Petersen RC, Morris JC. Mild cognitive impairment as a clinical entity and treatment target. Arch Neurol. 2005;62:1160–1163. doi: 10.1001/archneur.62.7.1160. [DOI] [PubMed] [Google Scholar]
- [34].Folstein MF, Folstein SE, McHugh PR. Mini-Mental state”. A practical method for grading the cognitive state of patients for the clinician. J Psychiatr Res. 1975;12:189–198. doi: 10.1016/0022-3956(75)90026-6. [DOI] [PubMed] [Google Scholar]
- [35].Blesa R, Pujol M, Aguilar M, Santacruz P, Bertran-Serra I, Hernández G, Sol JM, Peña-Casanova J, NORMACODEM Group Clinical validity of the ‘mini-mental state’ for Spanish speaking communities. Neuropsychologia. 2001;39:1150–1157. doi: 10.1016/s0028-3932(01)00055-0. [DOI] [PubMed] [Google Scholar]
- [36].Randolph C, Tierney MC, Mohr E, Chase TN. The Repeatable Battery for the Assessment of Neuropsychological Status (RBANS): Preliminary clinical validity. J Clin Exp Neuropsychol. 1998;20:310–319. doi: 10.1076/jcen.20.3.310.823. [DOI] [PubMed] [Google Scholar]
- [37].Martínez de la Iglesia J, Vilches MC Onís, Herrero R Dueñas, Colomer C Albert, Taverné C Aguado, Luque R Luque. Versión española del cuestionario de Yesavage abreviado (GDS) para el despistaje de depresión en mayores de 65 años: adaptación y validación. MEDIFAM. 2002;12:620–630. [Google Scholar]
- [38].Pillon B, Dubois B, Bonnet AM, Esteguy M, Guimaraes J, Vigouret JM, Lhermitte F, Agid Y. Cognitive slowing in Parkinson’s disease fails to respond to levodopa treatment: The 15-objects test. Neurology. 1989;39:762–768. doi: 10.1212/wnl.39.6.762. [DOI] [PubMed] [Google Scholar]
- [39].Leroy A, Michelet D, Mahieux F, Geni D, Defer G, Monfort JC, Degos JD, N’Guyen JP, Penschanski M, Cesaro P. Neuropsychological testing of 5 patients with Parkinson’s disease before and after neuron graft. Revue Neurologique (Paris) 1996;152:158–164. [PubMed] [Google Scholar]
- [40].Alegret M, Vendrell P, Junqué C, Valldeoriola F, Nobbe FA, Rumià J, Tolosa E. Effects of unilateral posteroventral pallidotomy on ‘on-off’ cognitive fluctuations in Parkinson’s disease. Neuropsychologia. 2000;38:628–633. doi: 10.1016/s0028-3932(99)00105-0. [DOI] [PubMed] [Google Scholar]
- [41].Gómez-Ansón B, Alegret M, Muñoz E, Monté GC, Alayrach E, Sánchez A, Boada M, Tolosa E. Prefrontal cortex volume reduction on MRI in preclinical Huntington’s disease relates to visuomotor performance and CAG number. Parkinsonism Relat Disord. 2009;15:213–219. doi: 10.1016/j.parkreldis.2008.05.010. [DOI] [PubMed] [Google Scholar]
- [42].Gómez-Ansón B, Alegret M, Muñoz E, Sainz A, Monte GC, Tolosa E. Decreased frontal choline and neuropsychological performance in preclinical Huntington disease. Neurology. 2007;68:906–910. doi: 10.1212/01.wnl.0000257090.01107.2f. [DOI] [PubMed] [Google Scholar]
- [43].Genovese CR, Lazar NA, Nichols T. Thresholding of statistical maps in functional neuroimaging using the false discovery rate. Neuroimage. 2002;15:870–878. doi: 10.1006/nimg.2001.1037. [DOI] [PubMed] [Google Scholar]
- [44].Maldjian JA, Laurienti PJ, Burdette JH. Precentral gyrus discrepancy in electronic versions of the Talairach atlas. Neuroimage. 2004;21:450–455. doi: 10.1016/j.neuroimage.2003.09.032. [DOI] [PubMed] [Google Scholar]
- [45].Maldjian JA, Laurienti PJ, Kraft RA, Burdette JH. An automated method for neuroanatomic and cytoarchitectonic atlas-based interrogation of fMRI data sets. Neuroimage. 2003;19:1233–1239. doi: 10.1016/s1053-8119(03)00169-1. [DOI] [PubMed] [Google Scholar]
- [46].Lancaster JL, Summerln JL, Rainey L, Freitas CS, Fox PT. The Talairach Daemon, a database server for Talairach Atlas Labels. Neuroimage. 1997;5:S633. [Google Scholar]
- [47].Lancaster JL, Woldorff MG, Parsons LM, Liotti M, Freitas CS, Rainey L, Kochunov PV, Nickerson D, Mikiten SA, Fox PT. Automated Talairach atlas labels for functional brain mapping. Hum Brain Mapp. 2000;10:120–131. doi: 10.1002/1097-0193(200007)10:3<120::AID-HBM30>3.0.CO;2-8. [DOI] [PMC free article] [PubMed] [Google Scholar]
- [48].Golden CJ. In reply to Adams “In search of Luria’ s battery : A false start”. J Consult Clin Psychol. 1980;48:517–521. doi: 10.1037//0022-006x.48.4.517. [DOI] [PubMed] [Google Scholar]
- [49].Del Ser T, Sánchez F, García de Yébenes MJ, Otero A, Zunzunegui MV, Muñoz DG. Versión española del Test de los 7 Minutos. Datos normativos de una muestra poblacional de ancianos de más de 70 años. Neurología. 2004;19:344–348. [PubMed] [Google Scholar]
- [50].Chételat G, Desgranges B, de la Sayette V, Viader F, Eustache F, Baron JC. Mild cognitive impairment. Can FDG-PET predict who is to rapidly convert to Alzheimer’s disease? Neurology. 2003;60:1374–1377. doi: 10.1212/01.wnl.0000055847.17752.e6. [DOI] [PubMed] [Google Scholar]
- [51].Okamura N, Arai H, Maruyama M, Higuchi M, Matsui T, Tanji H, Seki T, Hirai H, Chiba H, Itoh M, Sasaki H. Combined analysis of CSF tau levels and [123]Iodoamphetamine SPECT in mild cognitive impairment: Implications for a novel predictor of Alzheimer’s disease. Am J Psychiatry. 2002;159:474–476. doi: 10.1176/appi.ajp.159.3.474. [DOI] [PubMed] [Google Scholar]
- [52].Buckner RL, Andrews-Hanna JR, Schacter DL. The brain’s default network: anatomy, function, and relevance to disease. Ann N Y Acad Sci. 2008;1124:1–38. doi: 10.1196/annals.1440.011. [DOI] [PubMed] [Google Scholar]
- [53].Raichle ME, Snyder AZ. A default mode of brain function: a brief history of an evolving idea. Neuroimage. 2007;37:1083–1090. doi: 10.1016/j.neuroimage.2007.02.041. [DOI] [PubMed] [Google Scholar]
- [54].Mishkin M, Ungerleider LG. Contribution of striate inputs to the visuospatial functions of parieto-preoccipital cortex in monkeys. Behav Brain Res. 1982;6:57–77. doi: 10.1016/0166-4328(82)90081-x. [DOI] [PubMed] [Google Scholar]
- [55].Mummery CJ, Patterson K, Price CJ, Ashburner J, Frackowiak RSJ, Hodges JR. A voxel-based morphometry study of semantic dementia: relationship between temporal lobe atrophy and semantic memory. Ann Neurol. 2000;47:36–45. [PubMed] [Google Scholar]
- [56].Braak H, Braak E. Neuropathological stageing of Alzheimer-related changes. Acta Neuropathol. 1991;82:239–259. doi: 10.1007/BF00308809. [DOI] [PubMed] [Google Scholar]
- [57].Beversdorf DQ, Ferguson JLW, Hillier A, Sharma UK, Nagaraja HN, Bornstein RA, Sharre DW. Problem solving abilitity in patients with mild cognitive impairment. Cogn Behav Neurol. 2007;20:44–47. doi: 10.1097/WNN.0b013e31802e5101. [DOI] [PubMed] [Google Scholar]
- [58].Traykov L, Raoux N, Latour F, Gallo L, Hanon O, Baudic S, Bayle C, Wenisch E, Remy P, Rigaud AS. Executive functions deficit in mild cognitive impairment. Cogn Behav Neurol. 2007;20:219–224. doi: 10.1097/WNN.0b013e31815e6254. [DOI] [PubMed] [Google Scholar]
- [59].Espinosa A, Alegret M, Boada M, Viñas G, Valero S, Martínez-Lage P, Peña-Casanova J, Becker JT, Wilson BA, Tarraga Ll. Ecological assessment of executive functions in Mild Cognitive Impairment and mild Alzheimer’s Disease. J Int Neuropsychol Soc. 2009;15:751–757. doi: 10.1017/S135561770999035X. [DOI] [PMC free article] [PubMed] [Google Scholar]
- [60].Matsuda H. The role of neuroimaging in mild cognitive impairment. Neuropathology. 2007;27:570–577. doi: 10.1111/j.1440-1789.2007.00794.x. [DOI] [PubMed] [Google Scholar]