

Abstract
Background
To hasten cancer drug development, new paradigms are needed to assess therapeutic efficacy. In a randomized phase II study in patients with renal cell carcinoma, 10 μg/kg bevacizumab (Avastin®; Genentech, Inc., South San Francisco, CA) administered every 2 weeks resulted in a longer time to progression but a statistically significant difference in overall survival could not be demonstrated.
Methods
We developed a novel two-phase equation to estimate concomitant rates of tumor regression (regression rate constant) and tumor growth (growth rate constant). This method allows us to assess therapeutic efficacy using tumor measurements gathered while a patient receives therapy in a clinical trial.
Results
The growth rate constants of renal cell carcinomas were significantly lower during therapy with 10 μg/kg bevacizumab than those of tumors in patients receiving placebo. In all cohorts the tumor growth rate constants were correlated with survival. That a survival advantage was not demonstrated with bevacizumab appears to have been a result of early discontinuation of bevacizumab.
Conclusions
Single-agent bevacizumab significantly affects the growth rate constants of renal cell carcinoma. Extrapolating from the growth rate constants, we conclude that the failure to demonstrate a survival advantage in the original study was a result of premature discontinuation of bevacizumab. The mathematical model described herein has applications to many tumor types and should aid in evaluating the relative efficacies of different therapies. Quantitating tumor growth rate constants using data gathered while patients are enrolled in a clinical trial, as in the present study, may streamline and assist in drug development.
Keywords: Bevacizumab, Chemotherapy efficacy, Clear-cell carcinoma, Drug efficacy, Growth rate constant, Premature discontinuation, RECIST, Renal cell carcinoma, Tumor assessment, Tumor measurements
Introduction
Current therapeutic efforts are often focused on patients with advanced cancer, where new therapies are needed. In kidney cancer this approach has borne fruit with the approval of sorafenib, sunitinib, and temsirolimus in 2005–2007 [1-3]. While effective, these therapies are not curative, and oncologists continue to struggle treating patients with advanced kidney cancer. In a randomized phase II trial using the anti–vascular endothelial growth factor antibody bevacizumab (Avastin®; Genentech, Inc., South San Francisco, CA) in patients with advanced kidney cancer, accrual was stopped when a longer progression-free survival time was detected [4]. Ultimately, however, no difference in overall survival was demonstrated. In the present study, we analyze data from the trial as a platform for rationally evaluating drug efficacy in patients participating in clinical trials, using data gathered while patients are enrolled on study. We discuss a novel paradigm using kinetic analyses for predicting drug efficacy applicable where tumor burden can be assessed by serum or radiographic measurements.
Methods
Patient Characteristics
The data for this analysis came from a single clinical trial designed to determine whether either of two bevacizumab doses was superior to placebo in the therapy of renal cell carcinoma [4]. All patients had metastatic renal cell carcinoma and were treated before the approval of sorafenib, sunitinib, and temsirolimus. Treatment was continued until disease progression was documented by demonstrating a 25% increase in the sum of the products of the perpendicular diameters of the measured tumors. Overall survival (OS) was calculated from the on-study date until the date of death. All or the majority of lesions present at the time of enrollment in the study were measured in most patients and for the purposes of this study the values have been assumed to represent the amount of tumor at presentation. Bidimensional measurements were obtained and the data were recorded as the sum of the products of the perpendicular diameters. One hundred two patients were included in the mathematical analysis; 14 without numerical data were not included.
Mathematical Analysis
The Regression–Growth Equation
We developed an equation based on the model that tumor quantity decreases exponentially (i.e., as a first-order process) but that there is also independent exponential regrowth of the tumor reflected in larger tumor quantities. This equation is:
| (1) |
where exp is the base of the natural logarithm, e = 2.7182 … , and f is the tumor measurement at time t in days, normalized to the value at day 0, the time at which treatment is commenced. The rate constant d (decay, in days−1) accounts for the exponential decrease in the sum of tumor measurements, while the rate constant g (growth, also in days−1) represents the exponential regrowth of the tumor during treatment. Figure 1 depicts a set of theoretical lines derived on the basis of this model.
Figure 1.
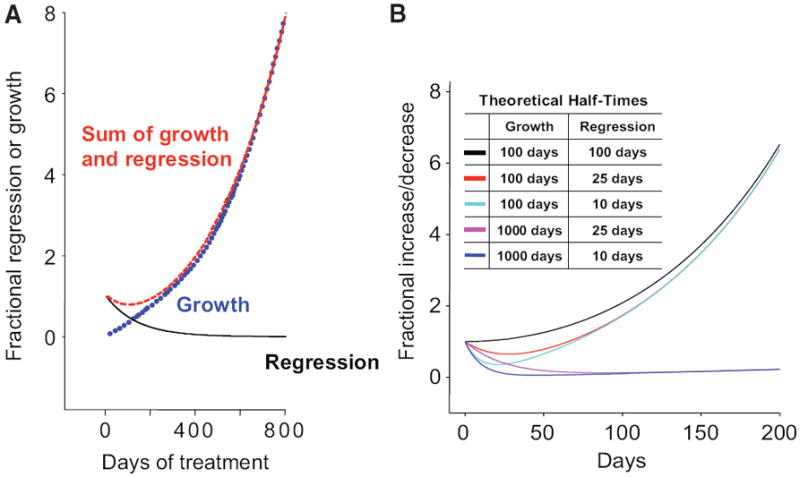
Theoretical plots for the regression/growth model. (A): The curve labeled “Regression” describes that fraction of the tumor that is regressing (decaying) during treatment. The curve depicted is the prediction of this equation with parameter g set to zero (i.e., regression only). The curve labeled “Growth” describes that fraction that grows continuously. The curve depicted is the prediction of this equation with parameter d set to zero (i.e., growth only). The curve labeled “Sum of Growth and Regression” gives the (net) sum of these two processes. The curve depicted is the prediction of the full regression/growth model of equation (1) in the text, with rate constant g set at 100 per day and d set at 10 per day. (B): The sums of concomitant regression and growth for several model tumors with varying regression rate (d) and growth rate (g) constants are depicted, showing that tumor measurements will vary depending on the extent of regression and growth that is occurring concurrently. Several curves are depicted for the “Sum of Growth and Regression.” These curves were generated using the theoretical half-times for growth and regression indicated in the box and demonstrate what the outcome will be for a tumor in which either growth or regression predominates even as the opposite effect is also occurring.
When the data showed a continuous decrease from the time of treatment, equation (1) was replaced by the reduced form:
| (2) |
When tumor measurements showed a continuous increase, equation (1) was again replaced:
| (3) |
Additionally, we used a model for which a fraction (φ) of the tumor was sensitive to the drug, with (1 − φ) being resistant, so that regression of the tumor began at (φ · the initial tumor quantity) and regrowth began at fraction ((1 − φ) · the initial tumor quantity). The appropriate equation is
| (4) |
Additional equations can be found in the online supplementary materials.
Data Analysis
We attempted to fit equation (1) to each of the 102 datasets. Curve fitting was performed using Sigmaplot (Systat Software Inc., San Jose, CA). We extracted the parameters g and d and their associated Student’s t-values and p-values. We declared significance at p < .05. When either g or d was not significant at this level, we used the respective reduced form of equation (1), namely, equation (2) or equation (3).
Statistical Analyses
Data were analyzed in Excel (Microsoft Corporation, Seattle, WA) and in Sigmaplot 9.0. Linear regressions were implemented using the polynomial linear routine of Sigmaplot 9.0. Sample comparisons were performed by Student’s t-test using SigmaStat 3.5 (Systat Software Inc.), with the p-value set at .05 for significance.
Results
Figures 1A and 1B depict several model curves of tumor behavior. Figure 1A demonstrates that the concomitant regression and growth that occur in a tumor are responsible for the measurements obtained in the clinical setting, the latter representing the sum of the fraction of tumor that is regressing and the fraction that is growing. While to the far right in Figure 1A (beyond 200 days), where tumor regression is no longer contributing substantially to the “sum” value, one can easily determine the growth rate; the equations described in the Methods section constitute a kinetic analysis allowing one to discern the growth rate constant when both regression and growth are occurring simultaneously. These equations were derived using an earlier clinical dataset (unpublished observations).
We next used the sum of the bidimensional tumor measurement data collected while patients were enrolled on study to determine the effect of bevacizumab on the kinetics of tumor growth, with an emphasis on the effect therapy had on the regression rate (d) and growth rate (g) constants. We identified four groups (Fig. 2 and online supplementary Fig. S1/S2). For patients randomized to placebo, the dataset from all but four showed a pattern of growth either initially or after a delay and fit equation (3) (Fig. 2A). Datasets from some patients randomized to receive bevacizumab, especially those randomized to low-dose bevacizumab, showed similar patterns. However, datasets from others, including a majority of those randomized to high-dose bevacizumab, were characterized by regression followed by subsequent regrowth and fit equation (1) (Figs. 2B and 2C). For only four of the 102 patients, the measurements showed much scatter and the model did not fit the observed data well (Fig. 2D). The individual growth rate (g) and regression rate (d) constants are depicted in dotplots in Figure 3. For patients on placebo, the mean g value was 10−2.231 day−1 compared with mean values of 10−2.330 day−1 and 10−2.561 day−1 for patients on low-dose and high-dose bevacizumab, respectively. The difference between placebo and high-dose bevacizumab was statistically significant (p < .001), as was that between low-dose and high-dose bevacizumab (p = .010). The difference between placebo and low-dose bevacizumab was not significant (p = .237). Turning to the regression (decay) rate constants, for the patients on placebo, the mean d value was 10−2.332 day−1 compared with mean values of 10−2.265 day−1 and 10−2.138 day−1 for patients on low-dose and high-dose bevacizumab, respectively. Although the regression rate constants were somewhat higher for patients receiving high-dose bevacizumab, this was not statistically significant, possibly a result of the absence of detectable regression in the majority of patients on placebo. Finally, we applied equation (4) to allow the model to estimate both the fraction of tumor sensitive to bevacizumab and its associated growth and regression rate constants. The derived g and d parameters were similar using the two algorithms (see online supplementary Fig. S3).
Figure 2.
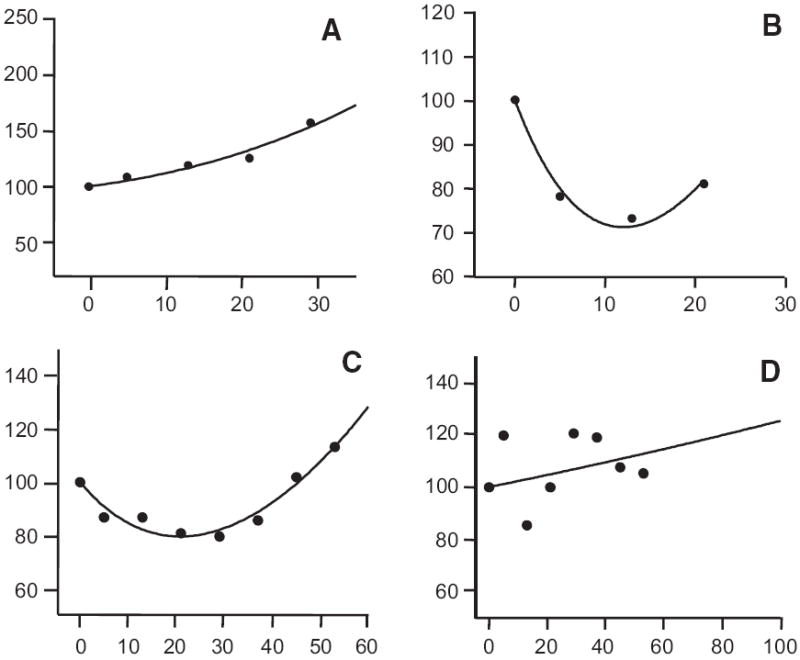
The sum of the perpendicular diameters (as a fraction of the value at the start of treatment assigned a value of one) against time in days for four patients of the 102 for whom sufficient data were available to attempt a full analysis (the full set can be found in online supplementary Figs. S1 and S2). The median number of data points was three per patient and the median time over which data were collected was 147 days. Initially the dataset from each patient was subjected to curve-fitting analysis. For 98 datasets, either g or d (or both) had an associated p < .05. (A) shows the pattern found in all but four of the patients randomized to the placebo arm that fit equation (3)—a pattern of growth either initially as shown in (A) or after a delay. For some of the patients randomized to receive bevacizumab, especially those randomized to the low-dose bevacizumab arm, a similar pattern was obtained. (B) and (C) depict the pattern found in the majority of patients randomized to the high-dose bevacizumab arm that fit equation (1)—regression followed by subsequent regrowth. (D) shows an example where the data showed much scatter and the model did not fit the observed data well—this was only observed in four of the 102 patients, two each from the low-dose and high-dose arms. The lines drawn are the best-fit theoretical predictions of the appropriate equations.
Figure 3.
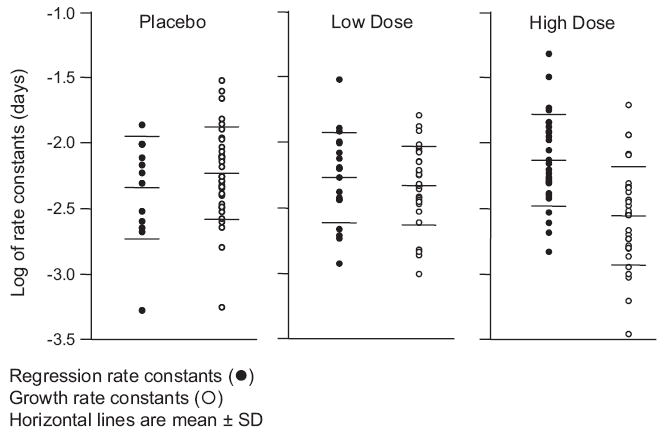
Dotplots of the distribution of the best-fit regression rate constants (d, left side of each panel, filled circles) or growth rate constants (g, right side of each panel, open circles). The horizontal lines in each set are the median values and the 95% confidence intervals. The ordinate is the logarithm of the derived rate constant. Regression rate constants could be measured in a larger number of patients in the bevacizumab arms and consequently the number of filled circles increases as one moves from placebo on the left to high-dose bevacizumab on the right. The values for both d and g varied over a nearly 50-fold range. The regression rate constants, taking all three arms of the study together, were significantly larger (p = .008) than the corresponding set of growth rate constants, with mean values of 10−2.222 day−1 (standard deviation [SD], 100.345) versus 10−2.372 day−1 (SD, 100.360), respectively. For the patients in the placebo arm, the mean g value was 10−2.231 day−1 (SD = 100.342) compared with mean values of 10−2.330 day−1 (SD, 100.289) and 10−2.561 day−1 (SD, 100.364) for patients in the low-dose and high-dose bevacizumab arms, respectively. For patients in the placebo arm, the mean d value was 10−2.332 day−1 (SD, 100.364) compared with mean values of 10−2.265 day−1 (SD, 100.327) and 10−2.138 day−1 (SD, 100.338) for patients in the low-dose and high-dose bevacizumab arms, respectively.
At the time of this analysis, all but four of the 102 patients who participated in the study had died. The median survival times in days for patients in the placebo, low-dose bevacizumab, and high-dose bevacizumab arms were 453 (range, 25%–75%, 225– 825), 450 (range, 25%–75%, 233–721), and 490 (range, 25%–75%, 271–831), respectively; none significantly different by analysis of variance (p = .826). As Figure 1 and the derivations described in the Methods section demonstrate, g represents the growth of the tumor that remains after the regression of any drug-sensitive cells, or in the case of the patients randomized to the placebo arm, g represents the intrinsic growth rate constant of the tumor. We hypothesized that g would correlate with OS, provided patients did not subsequently receive effective therapy. Figure 4A–F depicts graphs plotting patient survival and the two rate constants for the 98 patients in whom the datasets had a g or d (or both) with an associated p < .05. The data for patients in each arm of the study are plotted independently. Survival was strongly correlated with the logarithm of the growth rate constant, but not with the logarithm of the regression rate constant, suggesting that, while therapy may reduce tumor, the critical determinant in survival is the effect of therapy on the tumor growth rate constant.
Figure 4.
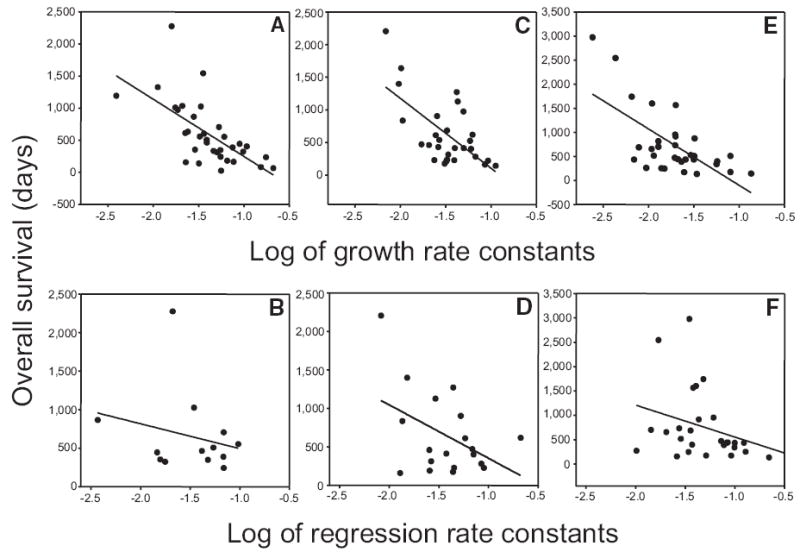
Dependence of patient survival (y-axis in days) on the log of the growth and regression rate constants for patients randomized to each of the three study arms (x-axis). All x-axes are logarithmic scales. Growth rate constants (g, per day) were derived using equation (1) or equation (3) and regression rate constants (d, per day) were derived using equation (1) or equation (2). Survival was strongly correlated (negatively, a higher growth rate being associated with a poorer survival) with the logarithm of the growth rate constant—(A): Pearson’s r = −0.648; p < .001; d.f. = 32; (C): Pearson’s r = −0.643; p = .002; d.f. = 27; (E): Pearson’s r = −0.657; p < .001; d.f. = 30—but not with the logarithm of the regression (decay) rate constant—(B): Pearson’s r = −0.236; p = 0.438; d.f. = 11; (D): Pearson’s r = −0.446; p = .055; d.f. = 17; (F): Pearson’s r = −0.321; p < .096; d.f. = 26. Note that for the correlation with the regression rate constant the curves, while not statistically significant, appear if anything negatively correlated, which is not what would be expected: a higher rate of tumor regression being associated here, if at all, with a poorer survival.
Discussion
The current study underscores the obvious: the growth of treatment-refractory cancer cells is responsible for the death of a patient. But it also demonstrates that, using data gathered while a patient is enrolled in a clinical trial, a growth rate constant can be calculated, and this can be a surrogate for survival in patients with metastatic disease. The growth rate constant provides an independent, unbiased assessment of treatment efficacy that, applied during a clinical trial, may allow a rapid evaluation of drug activity. As discussed below, our data also suggest that therapy with bevacizumab was discontinued prematurely. While, in the present study, we used renal cell carcinoma as a model, the biology described is likely applicable to many cancers wherein measures of tumor load can be obtained.
The observation that the growth rate constants in patients randomized to placebo could predict OS has precedence in other clinical settings. For example, prostate cancer patients followed without treatment after local therapy, and those with metastases who receive ineffective therapies, experience tumor growth unopposed by regression, and this results in a prostate specific antigen doubling time that is comparable to the growth rate constant described in the present study and can predict outcome [5-9]. However, despite ongoing tumor regression, we found similar correlations between the growth rate constant and OS for the patients randomized to bevacizumab. This could be explained by two, not mutually exclusive, possibilities. The first is that therapy selected cells that were resistant to bevacizumab. Because of insensitivity to bevacizumab, the tumor growth rates on therapy and afterwards were similar, and consequently the growth rates computed while in the trial were those that drove the patient’s death. Alternatively, as discussed below, it is possible that the growth rate constant measured on therapy reflects a transient bevacizumab effect, and the growth rate increased after discontinuation of bevacizumab. With this second alternative, the on-study growth rate constants correlate with survival because a substantial portion of the remaining lives of these patients (450–490 days) was spent receiving the study drug (147–175 days) and hence what happened in the study impacted the OS.
Given the significant differences in growth rate constants between patients on placebo and those on 10 μg/kg bevacizumab (Fig. 3), and the correlations between the growth rate constants and survival (Fig. 4), one would expect significant differences in OS. However, the median survival time for patients on placebo (453 days) was not statistically different from that of those on high-dose bevacizumab (490 days). Such a discrepancy could be explained by at least three possibilities. The first is that the study was not powered to detect a difference in survival of 47 days. But in fact, on the basis of the regression line in Figure 4E, with a slope of 1,171 days per unit log g, a log difference of 0.330 in the mean growth rate constant between placebo and high-dose bevacizumab should have translated into at least 386 ± 81 days of added survival, not 47 days, and the study should have been able to detect this difference. A second explanation is that bevacizumab had a detrimental effect on patients and negatively affected survival. This is unlikely given the low incidence of side effects. In fact, the investigators were unable to discern patients receiving placebo from those receiving bevacizumab. (Also see data on survival as a function of time on study in online supplementary Fig. S4.) A third explanation, that we now proceed to develop, is that bevacizumab was discontinued prematurely. We recognize that Figure 5 represents a theoretical exercise, but because it uses study data and makes basic assumptions that might be generally agreed upon, we felt it was arguably valid and might inform future trial designs. To derive the growth rate constants, we used data obtained while patients were on study and these reflect growth of the tumor exposed to therapy. That growth is occurring while patients receive bevacizumab indicates that the tumor is relatively resistant to bevacizumab. In this case, bevacizumab would have some effect on growth and, after discontinuing bevacizumab, growth could increase, negating at least some of bevacizumab’s benefit. Figure 5 plots theoretical predictions based on median data for patients on placebo and high-dose bevacizumab. Because patients on placebo (bold line furthest to the left) received no effective therapy, the measurements reflect inherent “tumor biology” and growth could be predicted to remain on course, provided tumors did not follow Gompertzian kinetics. Because these patients survived a median of 453 days, the median tumor “quantity” at the time of death would have been given by where this bold line intersects the vertical line representing 453 days, namely, 11.42 times their on-study tumor quantity. Although we recognize that, at the very end of life, tumor growth may have slowed or accelerated to some extent, none of the data showed evidence of any other than exponential tumor growth. (See online supplementary Figs. S5 and S6.) The thin solid curve furthest to the right in Figure 5 depicts growth computed from the median results of patients on high-dose bevacizumab. Had the growth rate constant determined using on-study tumor measurements remained unchanged after bevacizumab was discontinued, it would have taken 895 days to intersect the horizontal line at the terminal quantity of 11.42—assuming that for both placebo and high-dose bevacizumab death occurs when a similar amount of tumor is present and if the on-study growth remained unchanged. (Were the final growth curves to be Gompertzian, a lower horizontal line would have been appropriate for the placebo data, but also for the bevacizumab cases, yielding a survival time similar to the figure of 895 days.) But, as we have noted, this predicted OS was not reached because the median survival duration was only 490 days, suggesting that after bevacizumab was discontinued growth accelerated. We would very cautiously note that if, as shown by the dashed line, the tumor growth rate on bevacizumab reverts to the placebo rate after bevacizumab is discontinued, the curve crosses the horizontal line at the quantity of 11.42 at 614 days, substantially closer to the median OS of patients randomized to bevacizumab, but still longer than the 490 days actually observed for the patients on study. This could indicate that, after discontinuing bevacizumab, the growth rate in fact was actually faster—a rebound effect—a possibility also raised for sorafenib and sunitinib [10, 11]. Of the three explanations considered, the last can best explain why a significant difference in OS was not observed despite a statistically significant reduction in the growth rate while on bevacizumab: the tumor growth rate increased from the on-study level after discontinuing bevacizumab. If true, this would indicate that bevacizumab was discontinued prematurely, and a greater effect on survival may have been achieved by continuing therapy. These calculations imply that bevacizumab therapy did not have a permanent effect on the tumor—and did not select for a slower growing clone. This is not unreasonable for a drug such as bevacizumab whose putative target is normal blood vessels, but could also be true for more traditional agents. Lacking curative therapies for most solid tumors, one could argue for indefinitely continuing therapy that alters growth, provided toxicity is acceptable. Prolonged administration of therapy with modest effectiveness has proven beneficial, at least in some settings [12]. These results with renal cancer are likely applicable to a report showing no survival advantage for paclitaxel plus bevacizumab in breast cancer despite a longer progression-free survival time and a higher number of objective responses [13]. Consideration should be given to study designs that include an experimental arm in which patients continue therapy despite disease progression beyond arbitrary endpoints [4].
Figure 5.
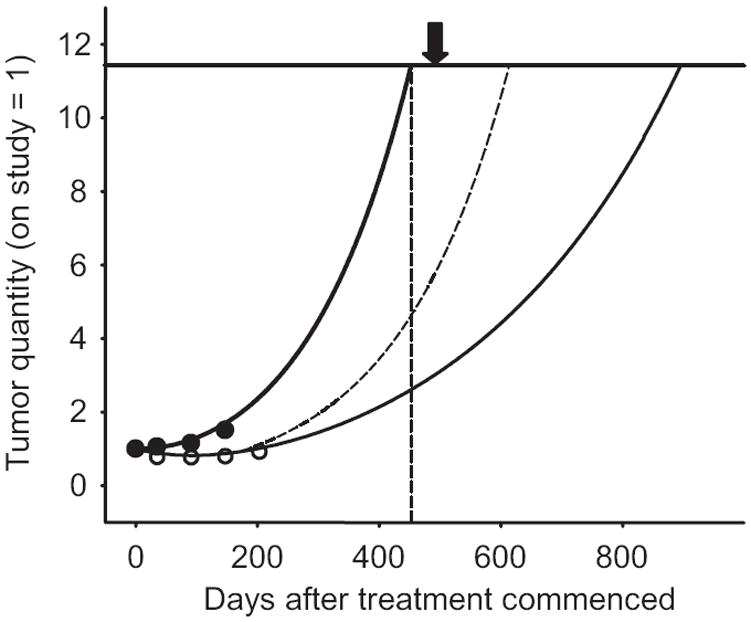
Theoretical predictions based on the median data for patients in the placebo and high-dose bevacizumab arms of the study. This figure is similar to the examples shown in Figure 1B, with the median results here for the sum of the growth and regression curves shown. The x-axis records the number of days after treatment commenced while the y-axis depicts the tumor quantity. The starting quantity of tumor has been arbitrarily assigned a value of 1. The circles are data for two patients—one in each arm—who happened to have actual measured values that approximate the median values for the entire group. Note that, in an individual patient, this would be the curve drawn as a result of the curve fit analysis—in effect a graphic refinement of the raw data. The growth of tumor beginning from an arbitrary starting point of 1 at the time of enrollment in the study to a maximum value of 11.42 at the time of death is shown. The value of 11.42 was estimated by plotting the expected amount of tumor patients in the placebo arm would have had at the time of their death if their tumor continued to grow “off study” at the same rate that it grew while on study and receiving placebo. The bold curve furthest to the left depicting the exponential curve for patients randomized to the placebo arm reaches a value of 11.42 times the on-study value of 1 at 453 days, the median survival time for this group of patients. (The vertical line is set at 453 days and intersects the growth curve at a relative tumor value of 11.42, depicted by the solid horizontal line.) The thin solid curve furthest to the right depicts the median results of the patients randomized to the high-dose bevacizumab arm, again with the starting tumor quantity arbitrarily set as 1. As this was a randomized study, the actual amount would have been expected to be similar to that of the placebo arm and indeed this was the case (33 cm2 for the placebo arm and 37 cm2 for the high-dose bevacizumab arm; difference not significant at p = .643). The thin solid line is what would be predicted for patients randomized to the high-dose bevacizumab arm had their tumors continued to grow at a rate comparable with that measured while they were enrolled in the study and receiving bevacizumab. This is the median overall survival time that one would have predicted for patients in the high-dose bevacizumab arm if one assumed that death occurred in patients when a given amount of tumor was present and if the on-study growth rate constant remained unchanged. The dashed curve shows what the curve would have looked like for patients randomized to the high-dose bevacizumab arm of the study if, after discontinuing bevacizumab therapy, the growth rate of their tumors increased to a value comparable with that of the patients who were randomized to the placebo arm of the study. The arrow at 490 days is the median survival time in days for the patients randomized to the high-dose bevacizumab arm of the study.
The mathematical equation used here recognizes that, during therapy, growth and regression occur simultaneously, and discerns their contributions to growth measured by clinicians. To our surprise, the regression portion of the curve, while needed to accurately describe the data, does not predict survival in these patients with kidney cancer. It is the growing fraction that determines survival. Furthermore, the growth rate constants of tumors of patients receiving high-dose bevacizumab were lower than those of tumors of patients on placebo (p < .001). This indicates that bevacizumab was beneficial and identifies in this small trial an agent with a modest degree of effectiveness that impacts growth. As experience accumulates, it should be possible using this analysis to discern an agent’s effect and compare it as an objective measure with agents evaluated previously.
The analysis here underscores the obvious: a successful therapy must either eradicate the tumor in its entirety or significantly alter the growth rate. It also demonstrates that, given a reliable measure of tumor burden, the growth rate constant can be calculated from data gathered on study. For a homogenous patient population, it ought to be possible to generate a “mean” growth rate constant for a given disease after, for example, failure of second-line therapy. This should allow more rapid discernment of therapies that can prolong survival by altering growth rate constants. Because the growth rate constant has been proposed as a surrogate for survival (this study and an accompanying study [14]), investigators may be able to use this approach to predict the effect an experimental intervention will have on survival. They could also determine whether greater benefit could come from continuing therapy beyond a prescribed, albeit arbitrary, endpoint.
Supplementary Material
Acknowledgments
The authors express their appreciation to Richard Simon for helpful discussions and feedback.
Footnotes
Author Contributions: Conception/Design: Wilfred D. Stein, James Yang, Susan E. Bates, Tito Fojo
Provision of study materials: James Yang
Collection/assembly of data: James Yang
Data analysis: Wilfred D. Stein, James Yang, Susan E. Bates, Tito Fojo
Manuscript writing: Wilfred D. Stein, James Yang, Susan E. Bates, Tito Fojo
Final approval of manuscript: Wilfred D. Stein, James Yang, Susan E. Bates, Tito Fojo
Disclosure: The content of this article has been reviewed by independent peer reviewers to ensure that it is balanced, objective, and free from commercial bias. No financial relationships relevant to the content of this article have been disclosed by the authors, planners, or staff managers.
References
- 1.Escudier B, Eisen T, Stadler WM, et al. TARGET Study Group. Sorafenib in advanced clear-cell renal-cell carcinoma. N Engl J Med. 2007;356:125–134. doi: 10.1056/NEJMoa060655. Erratum in: N Engl J Med 2007;357:203. [DOI] [PubMed] [Google Scholar]
- 2.Motzer RJ, Hutson TE, Tomczak P, et al. Sunitinib versus interferon alfa in metastatic renal-cell carcinoma. N Engl J Med. 2007;356:115–124. doi: 10.1056/NEJMoa065044. [DOI] [PubMed] [Google Scholar]
- 3.Hudes G, Carducci M, Tomczak P, et al. Global ARCC Trial. Temsirolimus, interferon alfa, or both for advanced renal-cell carcinoma. N Engl J Med. 2007;356:2271–2281. doi: 10.1056/NEJMoa066838. [DOI] [PubMed] [Google Scholar]
- 4.Yang JC, Haworth L, Sherry RM, et al. A randomized trial of bevacizumab, an anti-vascular endothelial growth factor antibody, for metastatic renal cancer. N Engl J Med. 2003;349:427–434. doi: 10.1056/NEJMoa021491. [DOI] [PMC free article] [PubMed] [Google Scholar]
- 5.D’Amico AV, Cote K, Loffredo M, et al. Determinants of prostate cancer-specific survival after radiation therapy for patients with clinically localized prostate cancer. J Clin Oncol. 2002;20:4567–4573. doi: 10.1200/JCO.2002.03.061. [DOI] [PubMed] [Google Scholar]
- 6.D’Amico AV, Moul JW, Carroll PR, et al. Surrogate end point for prostate cancer-specific mortality after radical prostatectomy or radiation therapy. J Natl Cancer Inst. 2003;95:1376–1383. doi: 10.1093/jnci/djg043. [DOI] [PubMed] [Google Scholar]
- 7.Zhou P, Chen MH, McLeod D, et al. Predictors of prostate cancer-specific mortality after radical prostatectomy or radiation therapy. J Clin Oncol. 2005;23:6992–6998. doi: 10.1200/JCO.2005.01.2906. [DOI] [PubMed] [Google Scholar]
- 8.D’Amico AV, Chen MH, Roehl KA, et al. Identifying patients at risk for significant versus clinically insignificant postoperative prostate-specific antigen failure. J Clin Oncol. 2005;23:4975–4979. doi: 10.1200/JCO.2005.08.904. [DOI] [PubMed] [Google Scholar]
- 9.Crawford ED, Pauler DK, Tangen CM, et al. Three month change in PSA as a surrogate endpoint for mortality in advanced hormone refractory prostate cancer (HRPC): data from Southwest Oncology Group study S9916. Proc Am Soc Clin Oncol. 2004;23:382. [Google Scholar]
- 10.Flaherty K. Sorafenib in renal cell carcinoma. Clin Cancer Res. 2007;13:747s–752s. doi: 10.1158/1078-0432.CCR-06-2063. [DOI] [PubMed] [Google Scholar]
- 11.Sternberg CN. Molecular pathways and the hope of targeting angiogenesis. Nature Clinical Practice Urology. 2007;4:470–471. doi: 10.1038/ncpuro0858. [DOI] [PubMed] [Google Scholar]
- 12.Sakuramoto S, Sasako M, Yamaguchi T, et al. ACTS-GC Group. Adjuvant chemotherapy for gastric cancer with S-1, an oral fluoropyrimidine. N Engl J Med. 2007;357:1810–1820. doi: 10.1056/NEJMoa072252. [DOI] [PubMed] [Google Scholar]
- 13.Miller K, Wang M, Gralow J, et al. Paclitaxel plus bevacizumab versus paclitaxel alone for metastatic breast cancer. N Engl J Med. 2007;357:2666–2676. doi: 10.1056/NEJMoa072113. [DOI] [PubMed] [Google Scholar]
- 14.Stein WD, Figg WD, Dahut W, et al. Tumor growth rates derived from data for patients in a clinical trial correlate strongly with patient survival: A novel strategy for evaluation of clinical trial data. The Oncologist. 2008;13:1046–1054. doi: 10.1634/theoncologist.2008-0075. [DOI] [PMC free article] [PubMed] [Google Scholar]
Associated Data
This section collects any data citations, data availability statements, or supplementary materials included in this article.