Abstract
Clutter is a noise artifact in ultrasound images that appears as diffuse echoes overlying signals of interest. It is most easily observed in anechoic or hypoechoic regions, such as in cysts, blood vessels, amniotic fluid, and urine-filled bladders. Clutter often obscures targets of interest and complicates anatomical measurements. An analytical expression that characterizes the extent to which clutter degrades lesion contrast was derived and compared to the measured contrast loss due to clutter in a bladder phantom. Simulation and phantom studies were performed to determine ideal and achievable signal-to-clutter ratios. In vivo clutter magnitudes were quantified in simultaneously-acquired fundamental and harmonic bladder images from five volunteers. Clutter magnitudes ranged from −30 dB to 0 dB, relative to the mean signal of the bladder wall. For this range of clutter magnitudes, the analytical expression predicts a contrast loss of 0–45 dB for lesions with clutter-free contrasts of 6–48 dB. A pixel-wise comparison of simultaneously-acquired fundamental and harmonic bladder images from each volunteer revealed an over all signal reduction in harmonic images, with aver age reductions ranging from 11–18 dB in the bladder interior and 9–11 dB in the tissue surrounding the bladder. Harmonic imaging did not reduce clutter in all volunteers.
Keywords: Abdominal imaging, clutter magnitude, contrast loss, harmonic imaging, lesion detectability, ultrasonic clutter
I. Introduction
Clutter is a ubiquitous phenomenon in ultrasonic imaging. It appears as a diffuse haze and is most easily visualized in anechoic or hypoechoic regions. Clutter typically overlays structures or signals of interest and often degrades image contrast. In Doppler blood flow imaging of the heart chambers and blood vessels, clutter from the surrounding tissue and vessel walls is typically 40–100 dB stronger than echoes from blood1 and wall filtering is necessary to observe and measure blood flow. Similarly, in cardiac B-mode imaging, clutter obstructs important diagnostic information and is one of the most problematic noise artifacts.2 In breast imaging, clutter reduces image contrast, limits the depth at which diagnostic information can be obtained, and diminishes the ability to visualize cystic contents, calcifications, and other subtle diagnostic details.3, 4 The important anatomical features of a fetus can also be obscured in the presence of strong clutter noise.5 The appearance of clutter varies from patient to patient; however, it is observed to be more prevalent in overweight or obese individuals.6, 7 Sources of acoustic clutter include sound reverberation in tissue layers, scattering from off-axis structures, ultrasound beam distortion, returning echoes from previously transmitted pulses and random acoustic or electronic noise.2, 3, 7–10
One method reported to reduce clutter is harmonic imaging.7, 11 In this technique, the higher harmonics generated by nonlinear wave propagation through tissue are imaged, as opposed to the first, or fundamental, harmonic of the transmitted pulse.7, 12, 13 These nonlinear waves are not fully developed near the transducer surface, which is one postulated reason why the near-field clutter seen in fundamental images is not as prevalent in harmonic images.14 Other explanations for clutter reduction with harmonic imaging include reduced sensitivity of harmonic beams to phase aberration and suppressed side and grating lobes.14–16 However, harmonic imaging does not reduce clutter in all patients; in some cases, fundamental images exhibit less clutter, while in other cases there is no difference.8, 17
There is a need for greater insight into clutter phenomena in order to design more robust methods for clutter reduction. The goals of this paper are to determine the effect of clutter on lesion detectability and to quantify clutter magnitudes in simulated, phantom, and in vivo data. An analytical expression for contrast loss due to clutter is derived and compared to phantom data. Simulations and phantoms are utilized to quantify the magnitude of clutter resulting from known sources. Images of urine-filled bladders of five volunteers are examined to determine clutter magnitude as a function of distance. The effectiveness of harmonic imaging with respect to clutter reduction is analyzed with contour maps displaying pixel-wise brightness differences between fundamental and harmonic images.
II. Methods
A. Analytical expression for contrast loss due to clutter
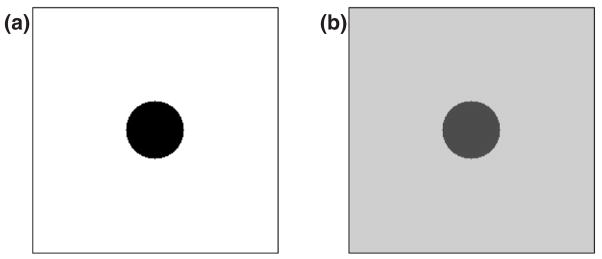
Consider an ultrasound image of a hypoechoic lesion surrounded by a uniform background, as shown in the schematic of figure 1(a). The definition of lesion contrast is taken to be
FIG. 1.
Schematic of a lesion in the (a) absence and (b) presence of a uniform clutter signal that over lays the en tire image.
| (1) |
where SB and SL are the mean envelope-detected radio frequency (rf) signals in the background and lesion, respectively. The contrast can also be defined as
| (2) |
where xB and xL are the background and lesion signals, respectively, in units of dB relative to the background signal. Eq. (2) is the expression for image contrast in the absence of clutter.
When clutter noise is present, as shown in the schematic of figure 1(b), the definition of contrast becomes
| (3) |
where S′B and S′L represent the mean value of the cluttered envelope-detected rf signals in the background and lesion, respectively, and x′B and x′L represent the cluttered background and lesion signals, respectively, in units of dB relative to the cluttered back ground signal.
In the rf domain, clutter noise is assumed to be a zero-mean Gaussian random variable that is uncorrelated with and independent of the speckle in the ‘uncluttered’ ultrasound image. The rf echoes used to form an uncluttered image of a diffuse speckle-generating structure can also be described by a zero-mean Gaussian random variable.18 Assuming that the cluttered image can be modeled as the sum of these two zero-mean Gaussian random variables, the result is a new zero-mean Gaussian random variable that characterizes the rf echoes of the cluttered image. After envelope detection, a zero-mean Gaussian random variable is transformed into a Rayleigh random variable.18–20 Because the clutter and the speckle in the uncluttered image are uncorrelated and independent, the mean of the combined envelope-detected echoes (i.e., the Rayleigh random variable characterizing the cluttered image) can be expressed in terms of the means of the individual Rayleigh random variables,20
| (4) |
where SC is the mean of the signal due solely to clutter.
Using Eq. (4), Eq. (3) can be further refined to give an expression for C′dB in terms of the mean signals of the background, lesion and clutter
| (5) |
The difference between Eqs. (2) and (5) is the contrast loss due to clutter
| (6) |
By definition of the decibel, Eq. (6) can be rewritten as
| (7) |
where xC is the signal due solely to clutter in units of dB relative to the background signal, xB.
B. Field II simulations
Simulations of acoustic clutter in ideal imaging situations were performed using FIELD II.21, 22 A 2.5 MHz, 70% bandwidth, 128-element linear array having elements with 0.48 mm lateral pitch and 1.4 mm height was simulated. The lateral transmit focus of the array was set to 6 cm. A lens provided elevation focusing at 6 cm. Dynamic focusing was applied during receive beamforming. Hanning window apodization was applied to the transmit and receive apertures. The effects of aberration, reverberation and electronic or acoustic noise were not included in the simulations.
Two targets were imaged with the simulated array. The scatterer density of each target was 10 scatterers per resolution volume. The first target was a 1.2 cm (lateral) × 2 cm (axial) × 1 cm (elevation) block of scatterers positioned to the right of the array’s center, such that 0.6 cm of the block and 1.2 cm of anechoic space were imaged. This target was used to measure the clutter generated when scatterers were placed in one lateral tail of the beamformer’s point spread function (PSF). The second target was a 5 cm spherical void within a 13 cm (lateral) × 7 cm (axial) × 6 cm (elevation) block of scatterers. This target was used to simulate the bladder geometry and to measure the clutter generated from both lateral tails of the beamformer’s PSF.
C. Experimental methods
A Siemens Antares™ ultrasound scanner and CH6-2 curvilinear transducer (Siemens Medical Solutions USA, Inc., Issaquah, WA) were used to obtain images of phantoms and in vivo bladders. The scanner was operated in the tissue harmonic imaging mode with a transmit frequency of 2.5 MHz. The Axius Direct Ultrasound Research Interface (Siemens Medical Solutions USA, Inc., Issaquah, WA) was used to acquire raw radio frequency (rf) data without significant time-gain compensation and before the application of nonlinear processing steps. In the harmonic imaging mode, the scanner implements the pulse inversion technique,23, 24 and therefore, the raw rf data consists of both normal and inverted pulse-echo signals. Fundamental images were constructed from the normal pulses and harmonic rf data was obtained by summing the normal and inverted pulse echoes. To form B-mode images, the rf data was envelope detected, normalized to the brightest point, log compressed, limited to a dynamic range of 45 dB and then scan converted.
A commercially-available CIRS (Norfolk, VA) Biometric Fetal Ultrasound Training Phantom (Model 068) and a custom bladder phantom were used to illustrate the imaging system’s capability to display anechoic regions and to provide baseline measurements for the clutter analysis methods. The bladder phantom was created by submerging a water-filled balloon in a graphite, propanol and water solution (RMI (now Gammex, Inc., Middleton, WI) SuperSpheres Model TM-C, discontinued by manufacturer). Clutter was introduced into several phantom images by placing a 1 cm-thick copper wire mesh at the transducer surface.
In vivo human bladder images were acquired from five male volunteers. The lateral span of the transducer was roughly aligned with the transverse plane and angled approximately perpendicular to the abdominal wall. The same data acquisition and image formation methods described for the phantom studies were used in the in vivo study. All image processing and analysis was implemented with MATLAB (The Mathworks Inc., Natick, MA), and all echo magnitude values were measured from the envelope detected rf data. Outlines of the fetal phantom, bladder phantom and in vivo bladder wall were subjectively estimated from B-mode images and displayed as a visual aid during image analysis.
D. Data analysis
Contour plots and graphs of clutter magnitude as a function of distance from echogenic structures were used to assess clutter magnitudes in the simulated, phantom and in vivo images. The contour plots were created from low-pass filtered, envelope-detected data. Low-pass filtering was achieved by convolving the envelope-detected rf data with a rectangular kernel of 201 pixels × 15 pixels, which corresponds to 0.96 mm × 4.2 mm in the simulated block image, 0.96 mm × 7 mm in simulated bladder image and 3.9 mm × 4.5° in the scan-converted phantom and in vivo images. The contour lines were then overlaid on an image of the echogenic border outlines. Each contour line on the plot represents the echo magnitude in units of dB relative to the mean brightness of the contour data contained within each respective outline.
Regional variations in fundamental and harmonic images were assessed with contour maps. Pre-scan-converted, envelope-detected images were low-pass filtered with a rectangular kernel of 151 × 15 pixels (which corresponds to 2.9 mm × 4.5° in the scan-converted image). The pixel-wise ratio between the filtered fundamental and harmonic images was then calculated and discretized into 3 dB intervals ranging from 27 dB to −6 dB.
III. Results
A. Contrast loss due to clutter
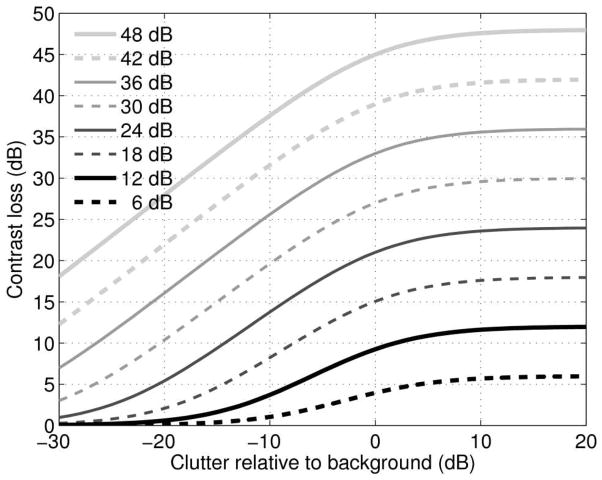
The degree to which clutter degrades lesion contrast, as predicted by Eq. (7), is shown in figure 2. The contrast loss due to clutter is plotted as a function of clutter magnitude relative to the background signal for eight values of ‘uncluttered’ lesion contrast. The loss in contrast increases with increasing clutter levels. Each curve asymptotes to the contrast of the uncluttered lesion.
FIG. 2.
Contrast loss as a function of clutter relative to the background signal for eight values of ‘uncluttered’ lesion contrast.
B. Simulation results
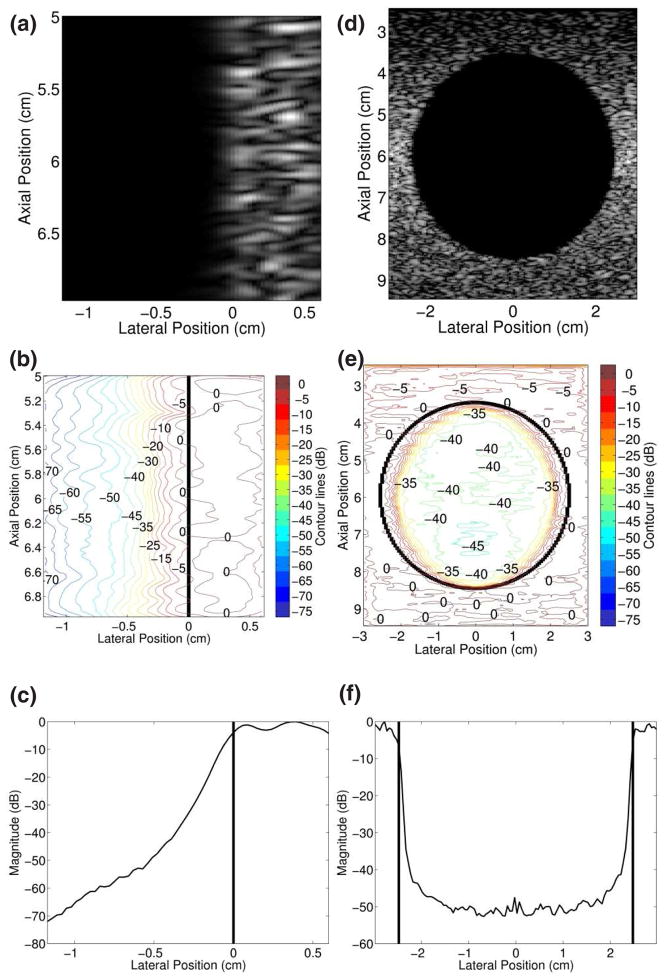
The simulated block image is shown in figure 3(a). The corresponding contour plot (Fig. 3(b)) shows a rapid transition from echogenic to anechoic and the spacing between the contour lines gradually increases at greater distances from the echogenic border. The average magnitude of axial positions 5 cm through 7 cm in the simulated block image is shown in figure 3(c) as a function of lateral position. The minimum signal is −72 dB relative to the maximum of the averaged values and occurs at a distance of 1.2 cm from the block boundary.
FIG. 3.
FIELD II simulated images of (a) a block and (d) a spherical void. The corresponding con tour plots (b and e) are referenced to the mean signal of the respective echogenic borders. The graphs of average signal magnitudes as a function of lateral position (c and f) are referenced to their respective maxima, and the vertical lines delineate echogenic borders. The values in (c) were obtained from averaging axial positions 5–7 cm and (f) shows the average of axial positions 5.5–6.5 cm.
The simulated bladder image is shown in figure 3(d). Unlike the simulated block image, the anechoic space of the simulated bladder image is surrounded by scatterers in the elevation dimension. The contour plot of the simulated bladder image is shown in figure 3(e). There are rapid signal transitions from 0 dB to −35 dB near the echogenic border and the minimum signal is −45 dB further away from the borders. These measurements are relative to the mean signal of the contour data contained within the outlined border. The average magnitude of axial positions 5.5 cm to 6.5 cm is plotted as a function of lateral position in figure 3(f). The minimum signal is −53 dB relative to the maximum of the averaged values.
C. Phantom results
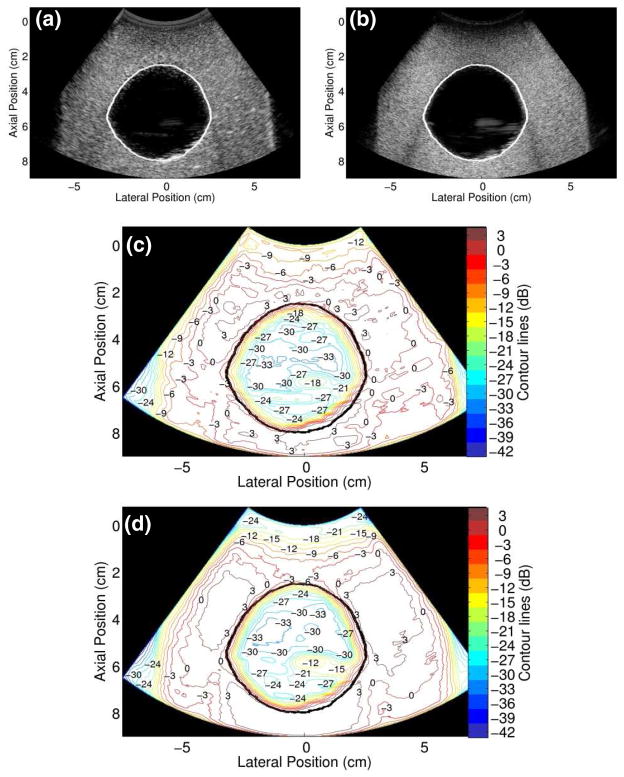
Simultaneously-acquired fundamental and harmonic images of the bladder phantom are shown in figure 4(a) and (b), respectively. Contrast in the fundamental bladder phantom images with and without the clutter layer were calculated using two equally-sized regions (2.6 cm × 0.2 cm) in the bladder and background, at a depth of 1 cm from the proximal bladder boundary. (The image of the bladder phantom with the clutter layer is not shown.) Without the clutter layer, the contrast at the specified location is 29 dB. This contrast is reduced to 9 dB in the presence of the clutter-producing layer, resulting in a contrast loss of 20 dB.
FIG. 4.
Simultaneously-acquired (a) fundamental and (b) harmonic images of the bladder phantom. (c) Contour plot of the fundamental image. (d) Contour plot of the harmonic image.
Contour plots of the fundamental and harmonic bladder phantom images without the clutter-producing layer are shown in figure 4(c) and (d), respectively. Reverberations from the bottom of the water tank that housed the phantom are apparent in both images. The contour plots show rapid signal transitions near the echogenic borders, ranging from 0 dB to −18 dB in the fundamental image and 0 dB to −24 dB in the harmonic image. The minimum signal inside the bladder phantom is −33 dB in both the fundamental and harmonic images.
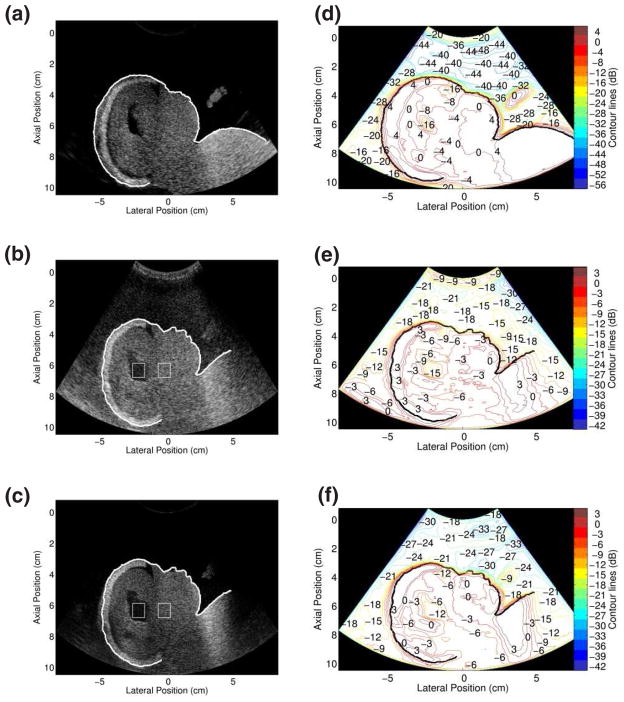
A fundamental image (Fig. 5(a)) of the fetal phantom, simultaneously-acquired fundamental (Fig. 5(b)) and harmonic (Fig. 5(c)) images of the fetal phantom with the clutter-producing layer placed at the transducer surface, and associated contour plots are shown in figure 5. The contour plot corresponding to figure 5(a) shows a steep transition from 0 dB to −36 dB near the fetal face and the dorsal side of the fetal hand. The near-field anechoic region is at most 48 dB down relative to the echogenic border.
FIG. 5.
Images and con tour plots of the fetal phantom in the absence and presence of a clutter-producing layer. (a) Fundamental B-mode image of the fetal phantom. Simultaneously-acquired (b) fundamental and (c) harmonic images with clutter-producing layer placed between the transducer and phantom. The ROIs inside and to the right of the ventricles were used for the contrast calculations de scribed in the text. Accompanying con tour plots: (d) fundamental image in the absence of clutter, (e) fundamental image in the presence of clutter-producing layer and (f) harmonic image in the presence of clutter-producing layer. Note the differences in color scales.
Clutter magnitudes are greater in the hypoechoic regions to the left of the fetal head, in the ventricles of the fetal head, and underneath the fetal hand. Similar results are seen in the contour plot of the harmonic image without the clutter layer (not shown), where the near-field anechoic region is at most 44 dB down relative to the echogenic border.
When the clutter-producing layer is placed between the phantom and transducer, the fundamental image shown in figure 5(b) exhibits a clutter signal that overlays the entire image and is most easily observed in the hypoechoic regions of the phantom. The accompanying contour plot in figure 5(e) reveals that the clutter magnitude in the near-field region is on average 18 dB down relative to the fetal boundary. Clutter magnitudes are greater in the hypoechoic regions to the left of the fetal head and in the ventricles. The clutter-producing layer is visible at 0–1 cm in the fundamental B-mode image and is 9 dB down relative to the fetal boundary. In the corresponding harmonic image (Fig. 5(c)), much of the visible clutter is eliminated and the clutter-producing layer is no longer visualized. The accompanying contour plot in figure 5(f) reveals that the near-field signal is on average 24 dB down relative to the fetal boundary. Clutter magnitudes are greater in the hypoechoic regions to the left of the fetal head, in the ventricles, and underneath the fetal hand.
The contrast between two regions of interest (ROIs) at the same depth, inside and to the right of the ventricles, was measured in the simultaneously-acquired fundamental and harmonic images with the clutter-producing layer. The ROIs were placed in identical locations in the fundamental and harmonic images (see Fig. 5). The measured contrasts (as defined by Eq. (3), with the ventricles representing the ‘lesion’) in the fundamental and harmonic images were 11.8 dB and 11.5 dB, respectively.
D. In vivo results
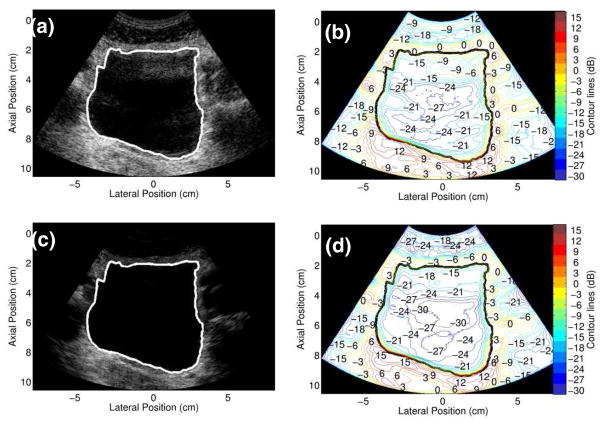
The in vivo study consisted of five volunteers whose ages and body mass indices (BMIs) are recorded in table 1. Volunteer 2 has a BMI of 25.8, which is considered overweight.25 The magnitude and spatial extent of clutter in a bladder image from this volunteer are shown in figure 6. The contour plot of the fundamental image (Fig. 6(b)) shows a gradual decrease in clutter as a function of distance from the proximal bladder wall. Near the lateral and distal bladder walls, the signal transitions are more rapid. Similarly, in the contour plot of the harmonic image (Fig. 6(d)), the rate of signal transitions near the proximal bladder wall is more gradual than the rate of signal transitions near the lateral and distal walls. The minimum clutter magnitudes inside the fundamental and harmonic bladder images are −27 dB and −30 dB, respectively.
TABLE 1.
Volunteer ages and body mass indices (BMIs).
| Volunteer no. | Age | BMI |
|---|---|---|
| 1 | 53 | 30.4 |
| 2 | 31 | 25.8 |
| 3 | 29 | 22.6 |
| 4 | 51 | 23.7 |
| 5 | 41 | 20.7 |
FIG. 6.
Simultaneously-acquired in vivo bladder images ((a) fundamental and (c) harmonic) from Volunteer 2 (age 31, BMI 25.8) and corresponding con tour plots.
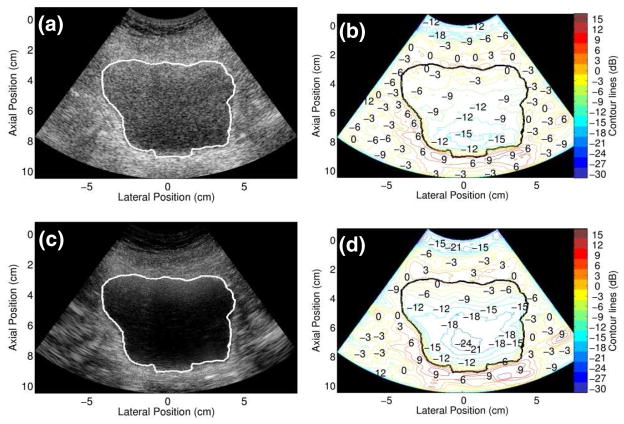
Bladder images and associated contour plots for Volunteer 1, whose BMI (30.4) is indicative of obesity,25 are shown in figure 7. There is more clutter in these bladder images than in those from Volunteer 2 (Fig. 6). As a result, the rate of signal transitions in the contour plots are more gradual in the contour plot of the fundamental image (Fig. 7(b)) than they are in the contour plot of the harmonic image (Fig. 7(d)). Signal transitions near the distal bladder wall are similar in both images. The harmonic image has lower clutter magnitudes than the fundamental image. The minimum magnitude in the fundamental image is −15 dB, whereas the minimum magnitude in the harmonic image is −24 dB.
FIG. 7.
Simultaneously-acquired in vivo bladder images ((a) fundamental and (c) harmonic) from Volunteer 1 (age 53, BMI 30.4) and corresponding con tour plots.
E. Clutter variation with distance
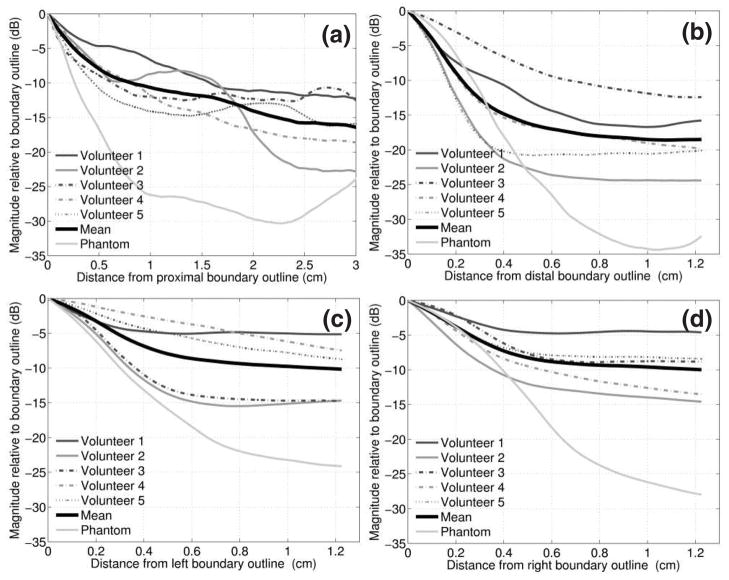
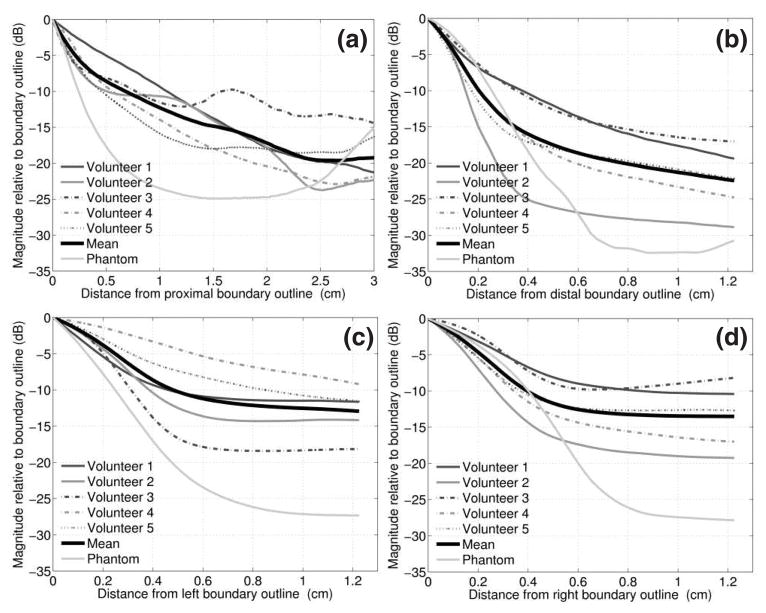
Graphs of clutter magnitude in the fundamental and harmonic images of all volunteers (and of the bladder phantom displayed in Fig. 4) are shown in figures 8 and 9, respectively. These graphs are shown as a function of distance from four locations along the estimated bladder outlines: proximal, distal, left and right. Information for the graphs was extracted from contour-plot data by manually selecting a point (using the computer mouse) on the bladder outline and obtaining contour data along the axial or lateral line emanating from that point. This process was repeated for a minimum of 10 points at each of the four outline locations. To display the extracted results, contour line data for each location were averaged, normalized to the mean contour value of the selected outline points at the specified location and graphed as a function of distance from the corresponding location. For each location, the mean clutter magnitude of the five volunteers was calculated and displayed on the graph.
FIG. 8.
Clutter magnitude in fundamental images of the in vivo bladders and the bladder phantom as a function of distance from the (a) proximal, (b) distal, (c) left and (d) right out line bound aries. The mean of the five volunteers is shown in bold. The phantom data was extracted from the con tour plot data of figure 4(c).
FIG. 9.
Clutter magnitude in harmonic images of the in vivo bladders and the bladder phantom as a function of distance from the (a) proximal, (b) distal, (c) left and (d) right out line bound aries. The mean of the five volunteers is shown in bold. The phantom data was extracted from the con tour plot data of figure 4(d).
Clutter magnitudes as a function of distance from the proximal bladder wall are shown in figure 8(a). This clutter persists well into the bladder and the mean clutter magnitude is 16.5 dB down from the proximal wall at 3 cm. Figure 8(b) shows clutter magnitudes as a function of distance from the distal bladder wall. At comparable distances, the mean magnitude is lower near the distal wall than it is near the proximal wall. For example, the mean magnitude at 1.2 cm from the distal wall is −18.5 dB, which is 7.2 dB less than the mean magnitude at 1.2 cm from the proximal wall. Clutter magnitudes as a function of distance from the lateral bladder walls are shown in figure 8(c) and (d). The means for the five volunteers are within 0.2 dB at a distance of 1.2 cm from the left and right bladder walls.
The clutter magnitudes of the obese volunteer (Volunteer 1, BMI 30.4) are consistently greater than the mean of the five volunteers. The overweight volunteer (Volunteer 2, BMI 25.8) has greater clutter magnitudes than the normal-weight volunteers as a function of distance from the proximal bladder wall, up to about 1.6 cm.
Analogous plots for the simultaneously-acquired harmonic images are shown in figure 9. Similar to the plots for the fundamental images, the mean signal is greater at comparable distances from the proximal bladder wall (Fig. 9(a)) when compared to the distal bladder wall (Fig. 9(b)). Additionally, the mean clutter magnitudes as a function of distance from the lateral bladder walls (Figs. 9(c) and (d)) are within 0.6 dB at a distance of 1.2 cm.
Figures 8 and 9 can be used to compare relative clutter magnitudes in fundamental and harmonic images. For each of the four bladder wall locations, the mean clutter magnitude is lower in the harmonic images. For example, at a distance of 3 cm from the proximal bladder wall, the mean clutter magnitude is approximately 3 dB lower in the harmonic image (Fig. 9(a)) than in the fundamental image (Fig. 8(a)). At a distance of 1.2 cm from the distal bladder wall, the mean signal is 3.9 dB lower in the harmonic image (Fig. 9(b)) than in the fundamental image (Fig. 8(b)). However, when the results are compared on an individual basis, clutter reduction is greater than the mean in some volunteers and close to zero in others. For example, the fundamental image of Volunteer 1 has a clutter magnitude of −12.3 dB at a distance of 3 cm from the proximal bladder wall whereas the harmonic image has a magnitude of −21.3 dB at this same distance, a 9 dB reduction in clutter. Conversely, the clutter reduction for Volunteer 5 is less than 1 dB at 3 cm from the proximal bladder wall.
F. Clutter reduction with harmonic imaging
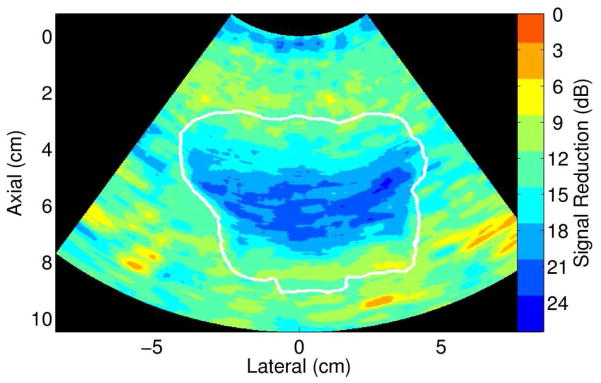
Clutter in fundamental and harmonic images were compared on a pixel-wise basis with contour maps illustrating the measured signal reductions in harmonic images. A representative contour map for Volunteer 1 is shown in figure 10. The clutter adjacent to the distal and proximal bladder walls experiences similar reductions to the surrounding tissue, in the range of 9–15 dB. The mean signal reduction in the tissue surrounding the bladders of the five volunteers ranges from 8–11 dB, and the average of the means is 10 ± 1.
FIG. 10.
Map of regional signal reductions in the harmonic image of Volunteer 1. These measurements are based on the simultaneously-acquired fundamental and harmonic images shown in figure 7(a) and (c), respectively.
The clutter in the interior bladder region experiences greater reductions than the surrounding tissue. This clutter is lower by 18 to 21 dB in the harmonic image of Volunteer 1 (Fig. 10), similar to signal reductions at the top of the image where higher-order harmonics are not fully developed. The mean clutter reduction in the bladder interior of the five volunteers ranges from 11–18 dB, and the average of the means is 15 ± 3 dB.
IV. DISCUSSION
A. Impact and magnitude of clutter
The presence of clutter degrades ultrasound image quality. Often, diagnoses are made using subtle brightness differences in B-mode images, where lesion contrast is on the order of 1–10 dB.26 The presence of clutter is therefore a serious problem, particularly when imaging small, low-contrast lesions. Clutter noise contributes to these low contrast values and the extent to which it reduces contrast is characterized by Eq. (7).
The measured signals in the simulated data show clutter resulting from the isochronous volume of the beamformer’s point spread function (PSF) and represent clutter magnitudes in anechoic regions under ideal imaging conditions. When the block of diffuse scatterers was imaged, the magnitude of the anechoic region to the left of the block was −72 dB at 1.2 cm from the echogenic boundary. This is the lowest signal observed in our study and represents the clutter resulting from the presence of scatterers in only one lateral tail of the beamfomer’s PSF. The minimum magnitude in the simulated bladder image was −45 dB, and this represents the clutter as sociated with both lateral tails and the elevation response of the beamformer’s PSF. Hence, when beamforming under ideal imaging conditions (i.e., no aberration, no reverberation), the resulting PSF does not introduce a significant amount of clutter.
In addition to the clutter associated with beamforming discussed above, the phantom images include clutter originating from random acoustic and electric noise, acoustic reverberation within the transducer lens and between the transducer lens and phantom structures, echoes from previously-transmitted pulses and non-idealities in the system beamformer. The simulated bladder and the bladder phantom have comparable geometries, yet the minimum clutter magnitude in the contour plot of the simulated bladder image is 12 dB less than the minimum clutter magnitude in fundamental and harmonic bladder phantom images. The difference between minimum clutter magnitudes in the simulated and phantom images is likely due to the additional mechanisms for clutter generation.
The measured clutter magnitudes would be expected to vary with different realizations of transmit and receive apodization. An investigation of the optimal transmit and receive weighting functions is beyond the scope of this paper. However, the same imaging parameters, and hence the same weighting functions, were used for phantom and in vivo images, such that comparisons among them are independent of apodization. Similarly, comparisons between the two simulated images are independent of apodization.
The minimum clutter magnitudes in the in vivo bladder images are greater than those in the phantom images. The in vivo clutter magnitudes are also different among the five volunteers, likely due to differences in bladder shapes and sizes. These differences likely contribute to differences in acoustic interaction with the surrounding tissue. For example, in figure 3, the magnitude at 1.2 cm to the left of the simulated block is approximately 30 dB less than magnitudes at the same distance from the lateral borders of the simulated bladder, evidence that shape and size differences contribute to differences in clutter magnitudes. Differences in volunteer BMIs and in abdominal wall fat-to-muscle ratios may also be a source of the clutter magnitude differences.14, 27
There were large differences in clutter magnitudes between some of the simultaneously-acquired fundamental and harmonic in vivo images, which is not true for the simultaneously-acquired fundamental and harmonic phantom images without the clutter-producing layer. The inclusion of the wire mesh yielded similar clutter magnitudes, similar clutter magnitude differences between simultaneously-acquired fundamental and harmonic images and similar clutter reductions with harmonic imaging, when compared to some of the in vivo bladder images. These similarities suggest that near-field layers are a significant source of clutter.
B. Comparison of predicted and measured contrast losses due to clutter
The analytical result depicted in figure 2 can be compared to empirical measurements by using the relevant ‘uncluttered’ contrast curve to predict the contrast loss due to clutter. The analytical result contains an expression for clutter magnitudes relative to the background of an uncluttered image, xC-xB. However, this information is unavailable when clutter noise overlays the entire image, and two assumptions must be made in order to predict the contrast loss in such cases. The first assumption is that the cluttered image contains an anechoic region corrupted by clutter noise, which can be used to measure the signal due solely to clutter (i.e. xC ~ x′L). Secondly, one must assume that the uncluttered background signal is much larger than the signal due solely to clutter, such that the background signals in the cluttered and uncluttered images are approximately the same (i.e. if SB ≫ SC, then S′B ~ SB, as follows from Eq. (4)). If these assumptions are true, the clutter magnitude in an anechoic region can be compared to the background signal in the cluttered image (i.e., xC - xB ~ x′L - x′B; notice xC - xB ~ C′dB).
The above-stated assumptions are valid when the bladder phantom images with and without the wire mesh are taken to be the ‘cluttered’ and ‘un cluttered’ images, respectively. The bladder phantom is filled with water, which is known to be anechoic, and the measured envelope-detected background signals in the bladder phantom images with and without the clutter-producing layer are comparable. The measurements for CdB, C′dB, and contrast loss at 1 cm from the proximal boundary were 29 dB, 9 dB, and 20 dB, respectively. According to the analytical result, on a 29 dB ‘uncluttered’ contrast curve, the contrast loss for a clutter magnitude of −9 dB is predicted to be 20 dB. The analytical prediction is therefore in good agreement with the empirical result. The analytical result in figure 2 can also be used to predict the contrast loss due to clutter in in vivo images (see following section).
C. Importance of clutter reduction in abdominal images
The in vivo bladder likely represents a ‘best case’ scenario for clutter magnitudes in abdominal images. The nearby tissues that cause clutter are farther apart in the center of the filled bladder than they are in other abdominal organs, such as the liver or kidney. By similar reasoning, clutter magnitudes in lesions and other small structures in abdominal organs are likely greater than clutter magnitudes in bladder images. The high clutter magnitudes measured in in vivo bladder images can be problematic in numerous abdominal imaging environments, such as in fetal imaging or in viewing subtle hepatic or renal masses.
Even though the urine-filled bladder is much larger than cysts, blood vessels and other similarly-sized hypoechoic structures, figures 8 and 9 show high clutter magnitudes at distances comparable to typical lesion sizes. Clutter magnitudes at these distances serve as rough estimates of the minimum clutter magnitude within small structures (e.g., cysts, tumors, blood vessels) in abdominal images.
Clutter magnitudes in in vivo bladder images range from −30 dB to nearly 0 dB relative to the mean signal in the bladder wall, and as described above, this range is taken to be the minimum amount of clutter overlaying other abdominal organs. Figure 2 shows that there is a loss of 0–45 dB in contrast for the range of clutter magnitudes observed in in vivo bladder images, where the exact value depends on the contrast that would exist if clutter were not present. Removing this clutter would improve image contrast.
D. Clutter reduction with harmonic imaging
The fetal phantom images with the clutter-producing layer show the extent to which harmonic imaging removes clutter generated by near-field sources. The harmonic image with the wire mesh placed at the transducer surface (Fig. 5(c)) appears similar to the fundamental image without the wire mesh (Fig. 5(a)), especially in the near field. Additionally, the wire mesh is barely visible in the harmonic image. Results reported by van Wijk and Thijssen17 show that harmonic imaging improves the near-field tissue-to-clutter ratio (TCR), as defined by Eq. (3). Existing literature14, 28 postulates that harmonic waves are not fully developed near the transducer surface and hence, they are not as sensitive to clutter-producing structures in this region. These theories are consistent with the reduced near-field clutter magnitudes and the diminished visibility of the clutter-producing layer. Further away from the transducer surface, there is less clutter reduction with harmonic imaging. Comparison of the contour plots in figure 5 reveals that harmonic imaging does not restore the near-field hypoechoic regions to magnitudes that were present be fore the clutter layer was introduced.
In the phantom and in vivo data, there were instances where harmonic imaging did not reduce clutter, consistent with previous studies.8, 17 The measured contrast, or TCR, in the ventricles of the fetal head is similar in the fundamental and harmonic fetal phantom images with the clutter layer, indicating that harmonic imaging did not reduce clutter in this hypoechoic region. The apparent clutter suppression in the corresponding B-mode image (Fig. 5(c)) is possibly due to image display settings. The dynamic range of the displayed images is limited to 45 dB. The clutter magnitude in the ventricles of the fundamental image is within the 45 dB limit while the clutter magnitude in the ventricles of the harmonic image is not. When the dynamic range is limited to 55 dB in the fundamental and harmonic images, the clutter in the ventricles no longer appears suppressed in the harmonic image, while the clutter in the near-field is still suppressed.
In the fetal phantom image without the clutter layer, the minimum magnitude in the fundamental image (−48 dB) is lower than the minimum magnitude in the simultaneously-acquired harmonic image (−44 dB). In the bladder phantom without the clutter layer (Fig. 4), harmonic imaging reduced clutter magnitudes near the echogenic border, but it did not lower the minimum clutter magnitude in the anechoic region. The in vivo results also show that there are some instances where clutter reduction with harmonic imaging is minimal.
Typical findings in literature report that harmonic images have 10–20 dB less rf signal strength than fundamental images.14, 28 The results represented by figure 10 support these measurements and the average signal reduction in the tissue surrounding the in vivo bladders is 10 ± 1 dB for the five volunteers. Although the high average (15 ± 3 dB) for clutter reduction in the bladder interiors suggests that images from all volunteers experience clutter reduction with harmonic imaging, several images show minimal clutter reduction when the signal reduction in the surrounding tissue is considered.
E. Relationship between clutter and body mass indices (BMIs)
Clinicians have observed that clutter is more apparent in overweight or obese individuals. According to standards set by the NIH National Heart, Lung, and Blood Institute,25 our experimental study contains one obese volunteer (Volunteer 1, BMI 30.4), one overweight volunteer (Volunteer 2, BMI 25.8), and three normal-weight volunteers. The clutter magnitudes in figures 8 and 9 are somewhat consistent with the clinical observations, especially near the proximal bladder wall. More volunteers in each BMI category are needed to determine the relationship between BMIs and the appearance of clutter in ultrasound images.
V. Conclusion
Clutter is an inherent property of many ultrasound images. It degrades contrast and corrupts diagnostic information. In this paper, we derived an analytical expression for contrast degradation due to clutter and compared analytical results to the measured contrast in a bladder phantom with and without a clutter-producing layer. Contour plots and graphs derived from contour-plot data were used to quantitatively assess clutter magnitudes in simulated, phantom, and in vivo data. The simulations were performed to determine clutter magnitudes under ideal imaging conditions. Clutter magnitudes were less than ideal in fundamental and harmonic phantom and in vivo images.
The low clutter magnitudes measured in the simulated data indicate that the beamformer’s PSF, under ideal imaging conditions, is not a significant source of clutter. The similarities between in vivo images and phantom images with the clutter-producing layer suggest that near-field layers are a more significant source of clutter.
Clinicians have observed that clutter is more apparent in overweight or obese individuals. Due to the limited sample size of overweight and obese individuals, we are not able to draw conclusive remarks about the correlation between BMIs and clutter magnitudes in obese, overweight, and normal-weight volunteers.
References
- 1.Bjaerum S, Torp H, Kristoffersen K. Clutter filter design for ultrasound color flow imaging. IEEE Trans Ultrason Ferroelec Freq Contr. 2002;49:204–216. doi: 10.1109/58.985705. [DOI] [PubMed] [Google Scholar]
- 2.Zwirn G, Akselrod S. Stationary clutter rejection in echocardiography. Ultrasound Med Biol. 2006;32:43–52. doi: 10.1016/j.ultrasmedbio.2005.08.012. [DOI] [PubMed] [Google Scholar]
- 3.Huber S, Wagner M, Medl M, Czembirek H. Real-time spatial compound imaging in breast ultrasound. Ultrasound Med Biol. 2002;28:155–163. doi: 10.1016/s0301-5629(01)00490-2. [DOI] [PubMed] [Google Scholar]
- 4.Entrekin R, Jackson P, Jago JR, Porter BA. Real time spatial compound imaging in breast ultrasound: technology and early clinical experience. Medicamundi. 1999;43:35–43. [Google Scholar]
- 5.Miyashita S. Efficacy of dynamic flow ultrasonography in fetal vascular imaging. Medikaru Rebyu. 2002;26:20–25. [Google Scholar]
- 6.Lencioni R, Cioni D, Bartolozzi C. Tissue harmonic and contrast-specific imaging: back to gray scale in ultrasound. Euro Radiol. 2002;12:151–165. doi: 10.1007/s003300101022. [DOI] [PubMed] [Google Scholar]
- 7.Tranquart F, Grenier N, Eder V, Pourcelot L. Clinical use of ultrasound tissue harmonic imaging. Ultrasound Med Biol. 1999;25:889–894. doi: 10.1016/s0301-5629(99)00060-5. [DOI] [PubMed] [Google Scholar]
- 8.Spencer KT, Bednarz J, Rafter PG, Korcarz C, Lang RM. Use of harmonic imaging without echocardiographic contrast to improve two-dimensional image quality. Am J Cardiol. 1998;82:794–799. doi: 10.1016/s0002-9149(98)00457-3. [DOI] [PubMed] [Google Scholar]
- 9.Bylund NE, Ressner M, Knutsson H. 3D wiener filtering to reduce reverberations in ultrasound image sequences. Proc Scand Conf Image Anal. 2003:579–586. [Google Scholar]
- 10.Viola F, Ellis MA, Walker WF. Time-domain optimized near-field estimator for ultrasound imaging: initial development and results. IEEE Trans Med Imag. 2008;27:99–110. doi: 10.1109/TMI.2007.903579. [DOI] [PMC free article] [PubMed] [Google Scholar]
- 11.Shapiro RS, Wagreich J, Parsons RB, Stancato-Pasik A, Yeh HC, Lao R. Tissue harmonic imaging sonography: evaluation of image quality compared with conventional sonography. Amer J Roentgen. 1998;171:1203–1206. doi: 10.2214/ajr.171.5.9798848. [DOI] [PubMed] [Google Scholar]
- 12.Muir TG, Carstensen EL. Prediction of nonlinear acoustic effects at biomedical frequencies and intensities. Ultrasound Med Biol. 1980;6:345–357. doi: 10.1016/0301-5629(80)90004-6. [DOI] [PubMed] [Google Scholar]
- 13.Starritt HC, Duck FA, Hawkins AJ, Humphrey VF. The development of harmonic distortion in pulsed finite-amplitude ultrasound passing through liver. Phys Med Biol. 1986;31:1401–1409. doi: 10.1088/0031-9155/31/12/007. [DOI] [PubMed] [Google Scholar]
- 14.Averkiou MA. Tissue harmonic imaging. Proc IEEE Ultrasonics Symposium; 2000. pp. 1563–1572. IEEE cat. no. 00CH37121. [Google Scholar]
- 15.Duck FA. Nonlinear acoustics in diagnostic ultrasound. Ultrasound Med Biol. 2002;28:1–18. doi: 10.1016/s0301-5629(01)00463-x. [DOI] [PubMed] [Google Scholar]
- 16.Ward B, Baker, Humphrey VF. Nonlinear propagation applied to the improvement of resolution in diagnostic medical ultrasound. J Acoust Soc Amer. 1997;101:143–154. doi: 10.1121/1.417977. [DOI] [PubMed] [Google Scholar]
- 17.van Wijk MC, Thijssen JM. Performance testing of medical ultrasound equipment: fundamental vs. harmonic mode. Ultrasonics. 2002;40:585–591. doi: 10.1016/s0041-624x(02)00177-4. [DOI] [PubMed] [Google Scholar]
- 18.Wagner RF, Smith SW, Sandrik JM, Lopez H. Statistics of speckle in ultrasound B-scans. IEEE Trans Sonics Ultrason. 1983;30:156–163. [Google Scholar]
- 19.Goodman JW. Statistical Optics. John Wiley and Sons, Inc; 1985. [Google Scholar]
- 20.Papoulis A. Probability, Random Variables, and Stochastic Processes. McGraw-Hill; 1965. [Google Scholar]
- 21.Jensen JA, Svendsen NB. Calculation of pressure fields from arbitrarily shaped, apodized, and excited ultrasound transducers. IEEE Trans Ultrason Ferroelec Freq Contr. 1992;39:262–267. doi: 10.1109/58.139123. [DOI] [PubMed] [Google Scholar]
- 22.Jensen JA. Field: A program for simulating ultrasound systems. Proc 10th Nordic Baltic Conf Biomed Imag; 1996. pp. 351–353. [Google Scholar]
- 23.Ma Q, Ma Y, Gong X, Zhang D. Improvement of tissue harmonic imaging using the pulse-inversion technique. Ultrasound Med Biol. 2005;31:889–94. doi: 10.1016/j.ultrasmedbio.2005.03.006. [DOI] [PubMed] [Google Scholar]
- 24.Simpson DH, Chin CT, Burns PN. Pulse inversion Doppler: a new method for detecting nonlinearechoes from microbubble contrast agents. IEEE Trans Ultrason Ferroelec Freq Contr. 1999;46:372–382. doi: 10.1109/58.753026. [DOI] [PubMed] [Google Scholar]
- 25.Settings M. Executive summary of the clinical guidelines on the identification, evaluation, and treatment of overweight and obesity in adults. J Ameri Dietetic Assoc. 1998;98:1178–1191. [Google Scholar]
- 26.Fahey BJ, Nelson RC, Bradway DP, Hsu SJ, Dumont DM, Trahey GE. In vivo visualization of abdominal malignancies with acoustic radiation force elastography. Phys Med Biol. 2008;53:279–293. doi: 10.1088/0031-9155/53/1/020. [DOI] [PMC free article] [PubMed] [Google Scholar]
- 27.Hinkelman LM, Mast TD, Metlay LA, Waag RC. The effect of abdominal wall morphology on ultrasonic pulse distortion. Part I. Measurements. J Acoust Soc Amer. 1998;104:3635–3649. doi: 10.1121/1.423946. [DOI] [PubMed] [Google Scholar]
- 28.Thomas JD, Rubin DN. Tissue harmonic imaging: why does it work? J Am Soc Echocardiogr. 1998;11:803–8. doi: 10.1016/s0894-7317(98)70055-0. [DOI] [PubMed] [Google Scholar]


