

Abstract
Amyloid-β (Aβ) plaques occur in close apposition to thickened or swollen cholinergic and galaninergic neurites within the neocortex and hippocampus in Alzheimer’s disease (AD). Despite this observation, the effect of Aβ deposition upon cholinergic and galaninergic dystrophic neurite formation remains unclear. Therefore, the purpose of this study was to evaluate the interaction between Aβ deposition within the neocortex and hippocampus upon cholinergic and galaninergic dystrophic neurite formation. Neocortical and hippocampal tissue harvested from 3- and 12-month-old amyloid-β protein precursor (AβPP)swe/PS1ΔE9 transgenic (tg) mice were dual-immunolabeled with antibodies against either choline acetyltransferace (ChAT) and Aβ (10D5) or galanin (Gal) and Aβ. Stereology was used to quantify amyloid plaques and cholinergic or galaninergic dystrophic neurites. Plaque number was assessed using the optical fractionator; plaque area was calculated with the Cavalieri estimator, and dystrophic neurite numbers and thickness were manually measured. Neither amyloid nor dystrophic neuritic profiles were seen in the brains of 3-month-old tg mice. In contrast, quantitative analysis revealed significantly more plaques in neocortex than hippocampus, with no difference in regional plaque size in 12-month-old tg mice. Significantly more cholinergic than galaninergic dystrophic neurites-per-plaque occurred in the neocortex and hippocampus. Additionally, cholinergic dystrophic neurites were thicker than galaninergic dystrophic neurites in both regions. These data suggest that amyloid plaque deposition has a greater impact upon cholinergic than galaninergic dystrophic neurite formation in the neocortex and hippocampus in AβPPswe/PS1ΔE9 tg mice. These data are also compatible with the hypothesis that galanin is neuroprotective and reduces dystrophic neurite formation in the face of amyloid toxicity.
Keywords: Alzheimer’s disease, cholinergic, galanin, amyloid, neocortex, hippocampus, neurites, plaques, transgenic mouse
Introduction
Alzheimer’s disease (AD) is a progressive neurodegenerative condition that, in over 95% of cases, afflicts individuals over the age of 65. Pathologically, the disease is marked by extracellular protein aggregations in the form of insoluble amyloid plaques, and neurofibrillary tangles (NFTs) consisting of hyperphosphorylated tau [1,2]. Accompanying these classic pathologic lesions are neuritic dystrophy and axonal hypertrophy of various neurotransmitter and neuromodulatory fiber systems within the cerebral neocortex and hippocampus in AD [3,4,5,6,7,8] as well as in animal models of this disease [9,10]. Human clinical pathologic investigations have shown that neuritic pathology correlates with the progression of dementia in the elderly [11].
A prominent neurotransmitter system that displays both cellular and neuritic degeneration in AD is the cholinergic basal forebrain (CBF) projection system, which provides the primary cholinergic innervation to the entire neocortex and hippocampus [12,13,14,15,16,17]. Degeneration of this system correlates with cognitive decline and disease severity in AD [15,16,18,19,20]. While cholinergic deficits have been most extensively investigated in parallel with amyloid deposition [9], limited information is available regarding the effect of amyloid plaque formation upon neuromodulatory systems in AD. In this regard, fibers containing the neuromodulator galanin (Gal), a 29 amino acid peptide (30 in humans) become hypertrophic and display dystrophic neurite pathology within the CBF and neocortex in late-stage AD [3,4,7,21,22,23]. Similarly, Gal dystrophic neurites were described in the neocortex and hippocampus of an amyloid-β protein precursor (AβPP) transgenic (tg) mouse model of AD [24], suggesting that galaninergic dystrophic neurite formation is also a response to amyloid plaque deposition. Gal is widely distributed in the mammalian central nervous system [25]) and may play a critical role in cognitive processes such as memory and attention through an inhibitory modulation of basal forebrain activity [26]. However, whether galaninergic and cholinergic fibers react to fibrillar amyloid deposition in a similar fashion remain unknown.
Despite reports of alterations in neocortical cholinergic activity in old AβPPswe/PS1ΔE9 amyloid plaque over-expressing tg mice [10], there are no detailed comparative investigations of the effect of amyloid plaques upon cholinergic and galaninergic dystrophic formation in this tg mouse model of AD. We therefore performed quantitative stereologic and morphologic analyses of neocortical and hippocampal cholinergic and galaninergic dystrophic neurites associated with amyloid plaques in AβPPswe/PS1ΔE9 tg mice. Stereologic analysis provides an unbiased method to quantify the total number of plaques within the neocortex or hippocampus. By counting a fraction of the region with “windows” systematically placed throughout the entire rostrocaudal, dorsoventral, and mediolateral extent of the neocortex or hippocampus, estimates of total regional plaque number are derived which are inter-regionally comparable.
The result of this investigation is timely in light of the recent observations that removal of amyloid deposition alone may not prevent cognitive decline in AD [27], suggesting the need for a greater understanding of the interaction between amyloid plaque formation and other brain pathologies including the formation of neurotransmitter/neuromodulator neurite pathology. Although amyloid plaque pathology fails to correlate with cognitive decline in AD, dystrophic neurites are associated with cognitive impairment early in the course of AD [28]. Since AD likely begins years before the onset of clinical symptoms, it is possible that some form of amyloid triggers the formation of cholinergic and galaninergic neurites early in the disease process. Once this process is initiated, removal of amyloid is not functionally efficacious. Therefore, understanding which neurotransmitter systems are most prone to neuritic degeneration would be beneficial for the development of novel drugs for the treatment of AD.
Materials and Methods
Transgenic mice
The animals used in this study (four female and two male 12-month-old, and three female and three male 3-month-old) were heterozygous AβPPswe/PS1ΔE9 tg mice, which co-express mutant presenilin 1 (PS1) with deletion of exon 9, and chimeric mouse-human AβPP695 with mutations linked to Swedish familial AD pedigrees (K595N, M596L; AβPPswe), maintained on a C3/B6HeJ background. A mouse prion protein promoter drove both transgenes [29,30]. Generation of these mice was accomplished by co-injection of both transgenes with one integration site [31,32].
All mice were maintained on a 12:12 light:dark cycle, had ad libidum access to food and water and were minimally handled. Animal care and all procedures were conducted in accordance with the National Institutes of Health Guide for the Care and Use of Laboratory Animals.
Tissue processing
All mice were anesthetized by intraperitoneal injection of a ketamine:xylazine (90mg/kg:9.5mg/kg) solution, then transcardially perfused with ice-cold 0.9 % sodium chloride followed by a fixative solution containing 4 % paraformaldehyde and 0.1 % glutaraldehyde. Each brain was removed from the calvarium, placed in the same fixative for 24 h and cryoprotected in 30% sucrose. Brains were sectioned at 40 μm in the coronal plane on a freezing sliding microtome into six parallel series and stored in a cryoprotectant solution (30 % glycerol, 30 % ethylene glycol, 40 % phosphate buffer) at 4° C until processing for immunohistochemistry.
Immunohistochemistry
A full series of sections from each animal was first incubated either with a goat polyclonal choline acetyltransferase (ChAT; 1:1000; Millipore, CA) or a rabbit polyclonal Gal antibody (1:5000 of 200 μl lyophilized undiluted antiserum reconstituted in 400 μl dH2O; a gift from Dr. E. Theodorsson, Sweden). The specificity of these antibodies has been reported previously [24,33]. Briefly, tissue was washed in phosphate buffer (PB, 11.29 g dibasic sodium phosphate, 2.76 g monobasic sodium phosphate in 1 l dH2O) to remove excess cryoprotectant, rinsed in a Tris-buffered saline (TBS) buffer, and incubated in sodium (meta)periodate to inhibit endogenous peroxidase activity. To improve penetrance of the primary antibody throughout the full depth of the section, tissue was washed in TBS with 0.25 % Triton X-100, followed by rinses in a solution consisting of 3 % serum (host animal of secondary antibody) diluted in TBS/Triton X-100 to prevent nonspecific binding. Tissue was then incubated overnight in either the ChAT or Gal antibody in TBS/Triton X-100 + 1 % serum. All washes and incubations were performed at room temperature on a shaker table, including overnight incubations with primary antibodies. Sections were then incubated for 1 h with biotinylated IgG (H+L) against the host animal of each primary antibody (Vector Laboratories Burlingame, CA) and placed in an avidin-biotin-complex solution for 1 h (Vector Laboratories). Tissue was washed in a sodium imidazole acetate buffer (0.68 g imidazole, 6.8 g sodium acetate trihydrate in 1 l distilled water, pH to 7.4 with glacial acetic acid). Subsequently, antibody staining for ChAT and Gal were visualized with 0.05 % 3,3′-diaminobenzidine tetrahydrochochloride (DAB, Sigma, MO) with 1 % nickel (II) ammonium sulfate hexahydrate and 0.0015 % H2O2 resulting in a black reaction product (see Fig. 1). The reaction was terminated using the imidazole-acetate buffer solution. After immunoprocessing for either ChAT or Gal, sections were rinsed and incubated with an antiserum raised against N-terminal residues 1-16 of Aβ (10D5; 1:10,000; gift from Elan Pharmaceuticals) [34,35]. Tissue was processed similar to that described above with the exception of the use of NovaRED (Vector Laboratories, Burlingame, CA) as the chromogen according to the manufacturer’s protocol, resulting in a red/orange reaction product (see Fig. 2). Sections were mounted on chrome-alum-subbed slides, dried overnight at room temperature, dehydrated in a graded series of ethanol (70, 90, 100 %), cleared in xylenes and cover-slipped with DPX mounting medium. For each neurochemical, staining of all sections was performed at the same time to reduce batch-to-batch variation.
Figure 1.
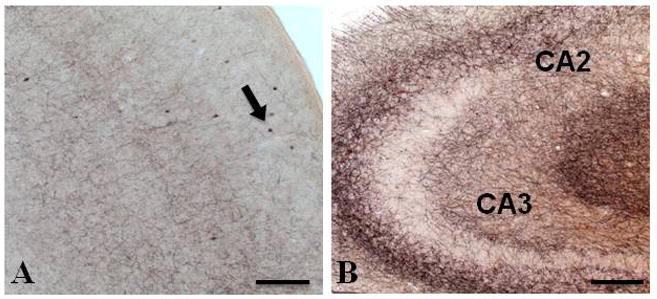
Photomicrographs of dual immunostained tissue showing a lack of amyloid plaques (red/orange) and ChAT-positive dystrophic neurites (black) in the neocortex (A) and hippocampus (B) in a 3-month-old APPswe/PS1ΔE9 mouse. Arrow in panel A indicates ChAT-positive interneurons. Abbreviations: CA2, CA3; cornu ammonis fields of the hippocampus. Scale bar = 100 μm.
Figure 2.
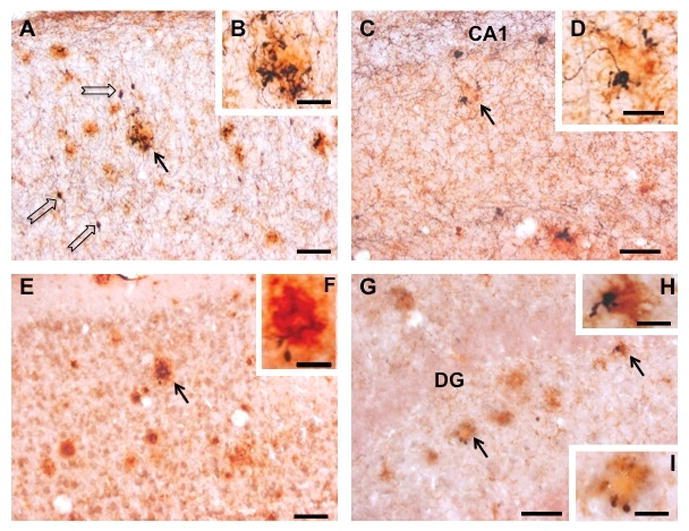
Photomicrographs showing neocortical (A, B, E, F) and hippocampal (C, D, G, H, I) sections dual immunostained for either Aβ (red/orange) and ChAT (black; A – D) or Aβ and Gal (E – I) in a 12-month-old APPswe/PS1ΔE9 mouse. Black arrows indicate the location of plaques displaying either ChAT-ir (A and C) or Gal-ir (E and G) dystrophic neurites. Insets show detail of these profiles at a higher magnification (ChAT and amyloid, B, D; Gal and amyloid, F, H, I). Note that cholinergic neocortical (B) and hippocampal (D) dystrophic neurites associated with plaques are more conspicuous than galaninergic dystrophic neurites (neocortex, F; hippocampus, H, I). Open arrows in panel A indicate neocortical cholinergic interneurons. Abbreviations: CA1, cornu ammonis field 1 of the hippocampus proper; DG, dentate gyrus. Scale bars = 50 μm (A, C, E, G), 20 μm (B, D, F), 10 μm (H) and 15 μm (I).
Immunofluorescence
Immunofluorescence was conducted on additional sections using modification of a previously reported procedure [36]. Briefly, sections were double labeled for ChAT (1:50) and Gal (1:200) using Cy3-conjugated donkey anti-goat and Cy2-conjugated donkey anti-rabbit IgG (1:200; (Jackson ImmunoResearch, West Grove, PA) as secondary antibodies, respectively Immunofluorescence was visualized with the aid of a Zeiss Axioplan 2 microscope.
Stereology
Total number of neocortical and hippocampal Aβ-immunoreactive (ir) plaques in 12-month-old APPswe/PS1ΔE9 mice was determined as previously described [37]. Stereological estimations were conducted using the Optical Fractionator with Stereo Investigator software (version 8.11; MicroBrightField, Williston, VT) installed on a standard computer. The thickness of each section was assessed empirically. The counting frame area was 6400 μm2; upper and lower guard zones of between 2 and 3 μm were established. A minimum plaque size was set at 15-μm diameter. Determination of the necessary sampling rate needed to capture all of the intra-individual variability [38] resulted in an average of 7385 neocortical and 5687 hippocampal sampling sites per animal (CE m = 1, averages per animal: 0.10 ChAT neocortex and hippocampus, 0.08 Gal neocortex, 0.09 Gal hippocampus). Sampling occurred throughout the entire rostrocaudal, dorsoventral, and mediolateral extent of the regions. The same investigator (CMK) performed all analyses.
Demarcation of regions of interest
Regions of interest were manually outlined using a 1x lens (numerical aperture (NA) 0.04) with aid of a Nikon Optiphot-2 microscope connected to a camera (CX9000) and a motorized stage (MicroBrightField, Williston, VT). The rostrocaudal extent of the neocortical regions examined extended from Bregma 3.2 mm to −5.02 mm, which included frontal-parietal, cingulate, orbital and primary visual cortex defined by Paxinos and Franklin [39]. The entire hippocampal formation including the subiculum was evaluated.
Plaque cross-sectional area analysis
Plaque cross-sectional areas of the previously counted lesions were measured using the Optical Fractionator. This provided a systematic random sampling paradigm and resulted in measuring of over 150 plaques per animal per brain region (neocortex, average of 199 plaques per animal; hippocampus, average of 171 plaques per animal). The Cavalieri point-estimator was used with a grid distance of 5 μm. Prior to calculations, Cavalieri estimates of area were compared with planimetry estimates (area of a contour drawn around plaque) revealing a correlation of 0.999 (30 plaques sampled, size ranged from 280 – 2500 μm2). Because of the irregular shape of some plaques, the Cavalieri estimator was used.
Plaque burden
Percentage of region occupied by plaques, plaque burden (Bp) was calculated using the formula: Bp = ApQ/Ar. Mean plaque cross-sectional area (Ap (μm2), derived from the Cavalieri estimator) was multiplied by the total number of plaques (derived from the optical fractionator) divided by six (Q). Dividing the total number of plaques by six provided the plaque count in one series (estimates reported elsewhere are for the entire region). This product was then divided by regional area (Ar (μm2)). Regional area was derived by planimetry of contours drawn around the region throughout one series of sections.
Dystrophic neurite-per-plaque analysis
Dystrophic neurite-per-plaque number was derived by manually counting ChAT- and Gal-ir dystrophic neurites. Dystrophic neurites have been described elsewhere [10] and were operationally defined as swollen fibers with a thickness greater than 1 μm (see Fig. 2). The sampling for these objects was the same as used for the cross-sectional area estimate. Plaques with overlapping dystrophic neurites were revisited with a 60x oil-immersion lens and dystrophic neurites manually counted. To ensure that neurites were not counted twice, fiduciary landmarks were used throughout the z-axis. The dystrophic neurite-per-plaque number was correlated with plaque size, as derived by the Cavalieri estimator.
Dystrophic neurite thickness
To determine average thickness of dystrophic neurites associated with plaques, 100 dystrophic neurites throughout the region of interest were examined. Plaques associated with dystrophic neurites were identified with a 10x objective lens (NA 0.45). Sampling was conducted throughout the rostrocaudal and dorsoventral extent of the neocortex and hippocampus (demarcations as outlined above). Plaques were then revisited with a 60x oil-immersion lens. Using the Stereo Investigator software, one-dimensional measurement (μm) of dystrophic neurite thickness was determined. Measurements from 100 dystrophic neurite sites per region were averaged across each animal; animals were averaged for a group estimate. A minimum neurite thickness of 1 μm was set to ensure that only pathological neurites were sampled. This value was based on the observation of normal fibers in the neocortex and hippocampus and on ultrastructural measurements of murine healthy fibers [40].
Statistical analysis
For all analyses, with the exception of correlations, data were averaged within each mouse, then across all mice. This was to prevent any mouse with a high plaque-load from contributing unduly to the final analysis. The nonparametric Wilcoxon signed-rank test was conducted using SPSS (version 15.0 IBM, IL) for all analyses. Regional analyses were conducted for number of plaques, plaque cross-sectional area, and plaque burden (area occupied by plaques). Regional and neurochemical comparisons were made for percentage of plaques with dystrophic neurites, dystrophic neurites per plaque for those plaques with dystrophic neurites, and dystrophic fiber size. Additionally, plaque cross-sectional area was analyzed as a function of presence or absence of dystrophic neurites for each region and neurochemical marker. Level of significance was set at p < 0.05. Correlations were analyzed using the nonparametric Spearman ρ and linear slope. Data was plotted with dystrophic neurites-per-plaque on the ordinate and plaque cross-sectional area on the abscissa.
Results
Plaque and dystrophic neurite pathology in APPswe/PS1ΔE9 mice
Dual immunohistochemical staining did not reveal amyloid plaques in the neocortex or hippocampus, or ChAT- and Gal-ir dystrophic neurites in 3-month-old AβPPswe/PS1ΔE9 tg mice (Fig. 1). In contrast, at 12 months, light microscopic analysis of tissue stained with 10D5 antiserum revealed amyloid-positive plaques scattered throughout all regions of the neocortex and hippocampus in AβPPswe/PS1ΔE9 tg mice (Fig. 2). Previous studies have shown that 10D5-immunostained plaques were thioflavine-S-positive indicating the compact/neuritic nature of the deposits in these mutant mice [10,41,42]. Virtually all 10D5-positive plaques exhibited a round or oval shape and a few displayed finger-like extensions [10].
Tissue dual immunostained for amyloid (10D5) and ChAT or amyloid and Gal displayed similar amyloid plaque pathology but also revealed additional neuritic dystrophy in the neocortex and hippocampus in the 12-month-old tg mice (Fig. 2), with no dystrophic neurites seen in 3-month-old tg mice. In general, ChAT- and Gal-ir dystrophic neurites appeared around the periphery and within the plaque proper as enlarged bulbous formations or with swollen varicosities only in the older tg mice (Fig. 2B, D, F, H, I). Dystrophic neurites for both systems displayed an altered geometry and trajectory Furthermore, dystrophic neurites were distinguishable from the thin straight ChAT- or Gal-ir fibers found in plaque-free zones of the neocortex and hippocampus. Interestingly, we observed ChAT- and Gal-ir fibers coursing in close apposition to plaques, which lacked neuritic pathology (data not shown).
Regional differences in amyloid plaque number
To analyze amyloid plaque pathology in the neocortex and hippocampus of 12-month-old APPswe/PS1ΔE9 mice, tissue was immunostained with the amyloid antibody 10D5. Stereological analysis revealed a significantly greater estimated number of total plaques in the neocortex (median 78,375) than in the hippocampus (median 14,010, p < 0.05; Fig. 3A,B). There was no apparent difference in plaque morphology in the two regions (see Fig. 2). Quantification revealed no difference in mean plaque cross-sectional area (neocortex 858 ± 45 μm2; hippocampus 928 ± 78 μm2, p = 0.249; Fig. 3C) or total plaque burden (neocortex, 2.11 ± 0.45 %; hippocampus 1.61 ± 0.20 %, p = 0.116) between the neocortex and hippocampus in 12-month-old AβPPswe/PS1ΔE9 tg mice. There was no difference across the rostral-caudal extent or dorsal-ventral axis in plaque number or plaque size for either region examined (data not shown).
Figure 3.
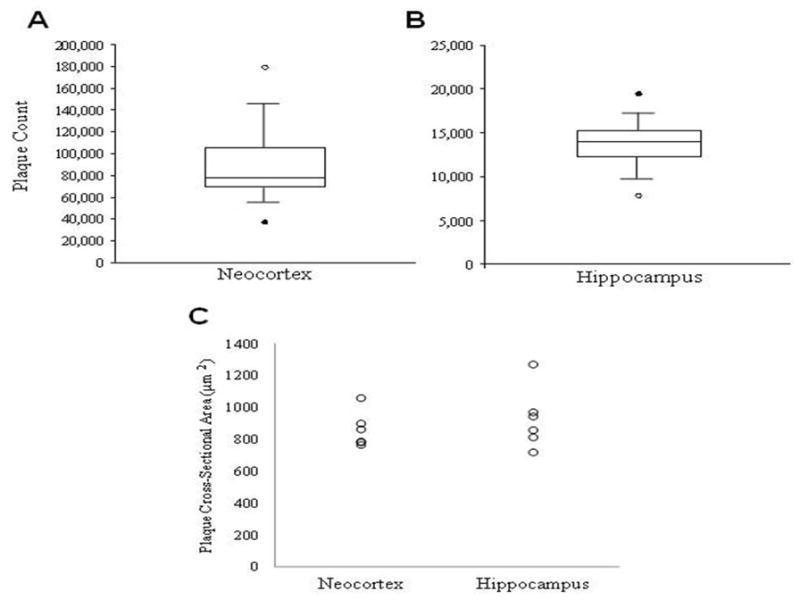
Box-plots show a significant greater number of amyloid-positive plaques in the neocortex (A) compared to the hippocampus (B) in 12-month APPswe/PS1ΔE9 mice (C) Scatterplot showing no regional difference in mean cross-sectional area of amyloid plaques in 12-month APPswe/PS1ΔE9 mice (Wilcoxon signed-rank; p < 0.05).
Plaque size versus dystrophic neurite pathology in APPswe/PS1ΔE9 mice
The Cavalieri estimator was used to determine the association of ChAT- and Gal-ir dystrophic neurites with amyloid plaque cross-sectional area in the neocortex and hippocampus. Quantification revealed no difference in mean plaque cross-sectional area for neocortical plaques with (675 ± 36 μm2) and without (513 ± 94 μm2, p = 0.225) ChAT-ir dystrophic neurites as well as no difference between hippocampal plaques with (729 ± 47 μm2) and without (735 ± 117 μm2, p = 0.600; Fig. 4A) ChAT-ir dystrophic neurites. Contrary to the observations for plaques with and without cholinergic pathology, an association between amyloid deposition and galaninergic neuritic pathology was observed for both the neocortex and the hippocampus. A significantly larger plaque size was associated with the presence of Gal-ir dystrophic neurites in both the neocortex (with, 1035 ± 76 μm2; without, 808 ± 42 μm2, p < 0.05) and the hippocampus (with, 1070 ± 118 μm2; without, 865 ± 62 μm2, p < 0.05; Fig. 4B).
Figure 4.
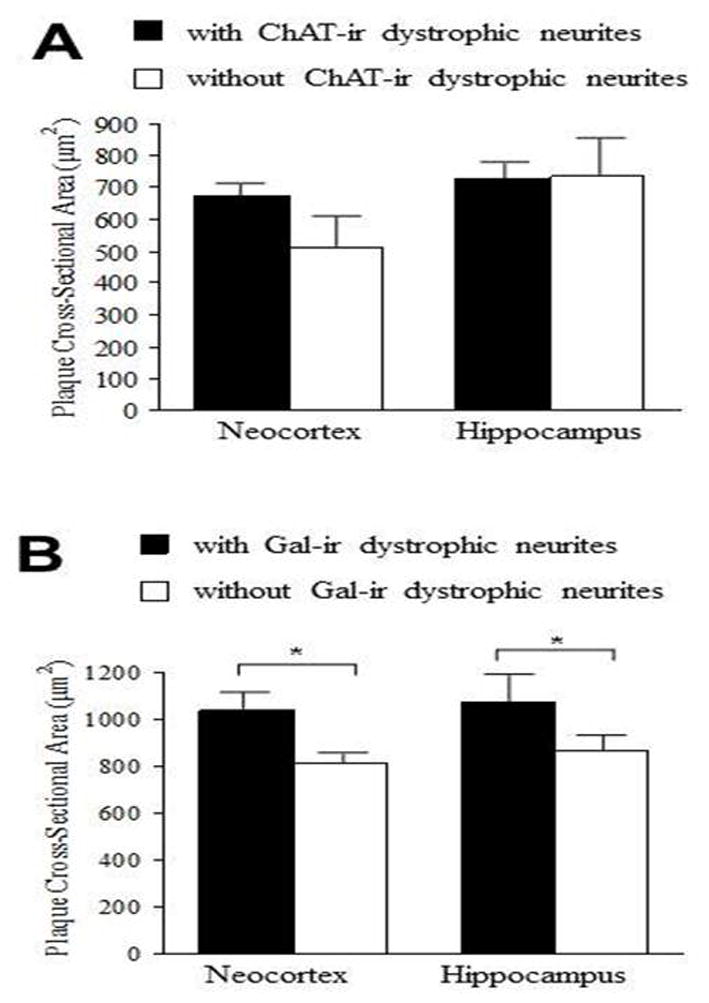
(A) Bar graph illustrating no difference in mean plaque cross-sectional area for plaques with or without ChAT-ir dystrophic neurite pathology in the neocortex and hippocampus of 12-month APPswe/PS1ΔE9 mice. (B) By contrast, significantly greater plaque cross-sectional area is associated with Gal-ir dystrophic neurite presence in the neocortex and hippocampus in these older mutant mice. An average of 199 neocortical plaques and 171 hippocampal plaques per each subject were measured. Error bars represent standard error of the mean (SEM). Wilcoxon signed-rank test;* p < 0.05
Additional correlation analyses revealed an incremental increase in neocortical ChAT-ir dystrophic neurites-per-plaque for every additional 112 μm2 of plaque cross-sectional area (linear slope, m = 0.0089, ρ = 0.55); whereas, hippocampal ChAT-ir dystrophic neurites showed an incremental increase in dystrophic neurites-per-plaque for every additional 189 μm2 of plaque cross-sectional area (linear slope, m = 0.0053, ρ = 0.20). Conversely, an incremental increase in Gal-ir dystrophic neurites-per-plaque was associated with an average increase in neocortical plaque size of 1429 μm2 (linear slope, m = 0.0007, ρ = 0.23) and hippocampal plaque size of 833 μm2 (linear slope, m = 0.0012, ρ = 0.34;data not shown).
Regional and neurochemical differences in amyloid-associated neuritic pathology
To further examine the extent of the neurochemical-specific pathology associated with amyloid deposition, the number of plaques with neuritic pathology was assessed as a percentage of total plaque count (Fig. 5A). The number of plaques associated with Gal-ir dystrophic neurites pathology was significantly lower in both the neocortex, 20.5 ± 3.2 %, and hippocampus, 30.4 ± 1.7 %, than for plaques with ChAT-ir pathology (neocortex, 94.3 ± 1.9 %; hippocampus, 95.0 ± 1.3 %, p < 0.05). Additionally, for plaques associated with ChAT-ir dystrophic neurites, there was no regional difference (neocortex versus hippocampus, p = 0.917); while, there was a significant regional difference for plaques associated with Gal-ir dystrophic neuritic pathology (p < 0.05).
Figure 5.
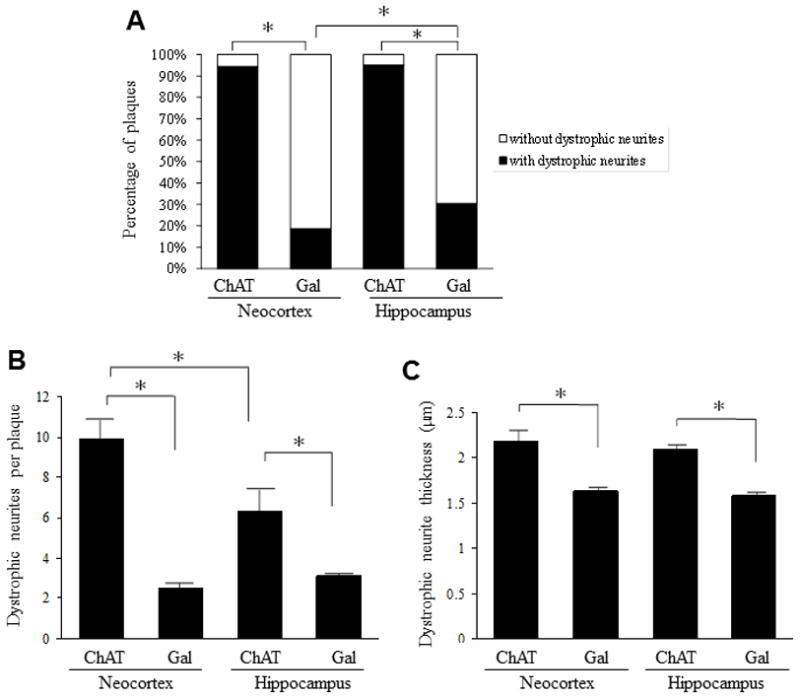
(A) Bar graph illustrating a significantly greater percentage of amyloid-positive plaques displaying ChAT compared to Gal-ir dystrophic neurites in the neocortex and hippocampus of 12-month APPswe/PS1ΔE9 mice. (B) In 12-month APPswe/PS1ΔE9 mice, the number of ChAT-ir dystrophic neurites-per-plaque was significantly greater than the number of Gal-ir dystrophic neurites-per-plaquefor both the neocortex and the hippocampus. In addition, the number of neocortical ChAT-ir dystrophic neurites-per-plaque was significantly greater than the number of hippocampal ChAT-ir dystrophic neurites-per-plaque.. (C) For both neocortex and hippocampus, ChAT-ir dystrophic neurites were significantly thicker than Gal-ir dystrophic neurites in 12-month APPswe/PS1ΔE9 mice. One hundred dystrophic neurites per subject were sampled for each region to derive these data. Error bars represent SEM, * p < 0.05. Wilcoxon signed-rank test.
To determine whether there was a difference in the quantity of dystrophic neurites per plaque, independent of plaque size, we quantified the number of ChAT- and Gal-ir dystrophic neurites associated with each plaque sampled with the optical fractionator probe. Quantitative analysis revealed significantly more ChAT-ir dystrophic neurites-per-plaque in the neocortex (9.9 ± 1.0) than in the hippocampus (6.3 ± 1.1, p < 0.05; 5B). Additionally, there were significantly more ChAT-ir dystrophic neurites-per-plaque than Gal-ir dystrophic neurites in both the neocortex and the hippocampus (p < 0.05). A non-significant difference was seen between the two regions for the quantity of Gal-ir dystrophic neurites associated with amyloid plaques (neocortex, 2.5 ± 0.2; hippocampus, 3.1 ± 0.1, p = 0.075; Fig. 5B). One hundred dystrophic neurites per animal from the neocortex and hippocampus were sampled, and their thickness measured. A minimum thickness of 1 μm was set to ensure that only pathological neurites were examined. Quantitation revealed that cholinergic dystrophic neurites were significantly thicker than galaninergic dystrophic neurites in the neocortex (ChAT 2.19 ± 0.12 μm, Gal 1.63 ± 0.05 μm, p < 0.05) and hippocampus (ChAT 2.10 ± 0.04 μm, Gal 1.59 ± 0.04 μm, p < 0.05), but no regional difference was observed (Fig. 5C).
Differentiation of galaninergic and cholinergic profiles
To determine whether galaninergic and cholinergic profiles overlap in the cortex and hippocampus double immunofluorescence was preformed for Gal and ChAT. Fluorescent microscopic analysis of hippocampal tissue double labeled for ChAT and Gal revealed separate populations of fibers and dystrophic neurites within the hippocampus (Fig. 6), supporting the concept that Gal innervation arises in part from non-cholinergic neurons, most likely the noradrenergic neurons of the locus coeruleus (LC) [43]. In addition to differences in the quantity of amyloid-associated dystrophic neurite pathology for the two-neurochemical fiber systems examined, there was a difference in fiber size. One hundred dystrophic neurites per animal from the neocortex and hippocampus were sampled, and their thickness measured. A minimum thickness of 1 μm was set to ensure that only pathological neurites were examined. Quantitation revealed that cholinergic dystrophic neurites were significantly thicker than galaninergic dystrophic neurites in the neocortex (ChAT 2.19 ± 0.12 μm, Gal 1.63 ± 0.05 μm, p < 0.05) and hippocampus (ChAT 2.10 ± 0.04 μm, Gal 1.59 ± 0.04 μm, p < 0.05), but no regional difference was observed (Fig. 5C).
Figure 6.
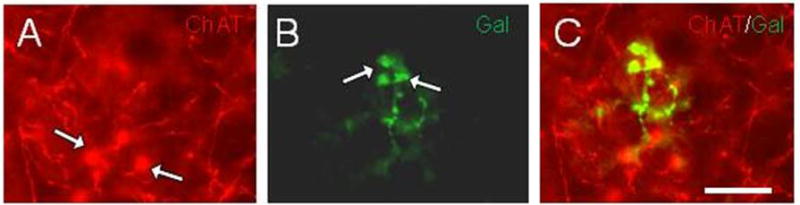
Fluorescence images of hippocampal tissue dual stained for (A) ChAT (red) and (B) Gal (green) showing fibers and dystrophic neurites (white arrows in A and B) in a 9-month-old APPswe/PS1ΔE9 mouse. (C) Merged image showing Gal-ir, but ChAT immunonegative dystrophic neurites. Scale bar=15μm.
Discussion
Several neurotransmitter and neuromodulatory systems display pronounced alterations within the human AD neocortex and hippocampus as well as in animal models of the disease including cholinergic [20,25,44,45,46] and galaninergic [23,47] fibers. It is believed that chronic exposure to Aβ species for several decades [2,48] drives the disruption of these chemical systems in AD. Similarly, in mouse models of AD, chronic exposure to elevated levels of AβPP and derivative Aβ species begins months, if not years, before neurite pathology [27,49]. Previously, we demonstrated amyloid plaque and cholinergic neurite swellings in the neocortex and hippocampus at as early as 2–3 months in an AβPPswe/PS1ΔE9 tg mouse line generated by crossing two single transgenic strains [10]. In contrast, we did not observe AD-type lesions in 3-month-old APPswePS1ΔE9 animals generated by transgene co-injection into pronuclei. We have also noted differences in cerebellar plaque pathology between these strains of AβPPswe/PS1ΔE9 mice (data not shown). These variations may be due to differences in the sites of integration of the different transgenes.
In the present study, using an unbiased stereological probe, we found a difference in the number of Aβ plaques between the neocortex and hippocampus in 12-month-old AβPPswe/PS1ΔE9 mice, although the overall plaque burden was similar between the two regions. The larger neocortical plaque count may be related to the volumetric difference between the two regions; however, because comparable plaque burdens were observed, an increase in hippocampal plaque size would be expected. Interestingly, there was no significant difference in average plaque size between the two regions. This may be a consequence of a high inter-individual variability. Photon microscopy performed in living amyloid-over-expressing mutant mice suggests that plaque size remains relatively constant throughout the life of the plaque [509,51]. Using in vivo microscopy in young (5–6-month) AβPPswe/PS1ΔE9 mice, plaque formation was shown to be a rapid but rare event, with no change in plaque size occurring after the first 24 hours of appearance [52]. This group also observed the formation of dystrophic neurites within days to weeks of plaque deposition. We found that the neocortex and hippocampus had similar plaque burdens and plaque size. However, examination of plaques with and without dystrophic neurites revealed a difference in plaque size depending on the extent of galaninergic versus cholinergic innervation. Larger neocortical and hippocampal plaques were associated with one or more Gal-ir dystrophic neurites, whereas, ChAT-ir dystrophic neurite number was independent of plaque size. These observations suggest that these two neurochemical systems respond differently to amyloid pathology.
We observed a greater number of cholinergic dystrophic neurites-per-plaque as well as a greater degree of cholinergic neuritic pathology, determined by fiber thickness, within the neocortex and hippocampus than for galaninergic pathology. We also found a greater than 3-fold increase in the percentage of plaques displaying ChAT than Gal-ir neuritic pathology in both regions examined. Interestingly, it has been suggested that the neuroanatomical origin of a fiber system plays a role in whether a peri-plaque dystrophic neurite profile forms. For example, glutamatergic corticocortical fibers will course through amyloid plaques; while, thalamocortical projections appear to avoid plaques through increased curvature and subsequent adoption of a more tortuous path around the lesion [53,54]. It is interesting that not all cholinergic or galaninergic fibers display neuritic pathology despite being in close proximity to an amyloid plaque, suggesting that other factors contribute to neuritic pathology. In this regard, defects in anterograde or retrograde axonal transport mechanisms [55,56] and decreased or altered microtubule assembly [57,58,59] may contribute to the bulbous/swollen appearance of neuritic pathology. Recent studies suggest a selective vulnerability of various neurotransmitter systems to amyloid pathology [9,60]. These studies suggest a timeline wherein cholinergic terminals appear to be the most vulnerable, followed by glutamatergic, whereas gamma-aminobutyric acid (GABA) terminals are more resistant to amyloid deposition [9,60]. Therefore, it is possible that the decreased galaninergic dystrophic neurite pathology found in the present study is a consequence of an inherent resistance to Aβ toxicity. Moreover, the galaninergic alterations may be due to a general injury response to amyloid [61,62,63,64]. In this regard, in the AD brain, increased transcription of Gal is associated with increased transcription of survival and anti-apoptotic genes, and CBF areas with the highest increases in Gal show the least amount of cell loss [3,26,65]. Additionally, the neurotrophic substance nerve growth factor induces Gal transcription [66,67]. It is also possible that the onset of Gal hypertrophic or dystrophic neurite expression seen in older AβPPswe/PS1ΔE9 mice represents a response to neuronal damage induced by increased Aβ levels, and variability between mice reflects differing degrees of damage and plaque load. Whether Gal or ChAT fiber dystrophy is a response to intra- or extracellular amyloid or to a form of oligomeric Aβ remains unknown. Cuello and coworkers [68] demonstrated an increase in cholinergic terminal density prior to plaque formation in Tg2576 (AβPPswe/PS1M146L) amyloid over-expressing mice suggesting that exposure to soluble monomeric or oligomeric forms of Aβ peptide prior to frank plaque pathology can trigger the formation of axonal dystrophy. Since the removal of amyloid by immunotherapy has not prevented or slowed cognitive decline in mild to moderate human AD patients [27], it is imperative that we gain a better understanding of the putative toxic effect(s) of amyloid upon the disruption of neural networks in the diseased brain. It is now accepted that AD pathology begins years before clinical symptoms, suggesting that some form of amyloid/oligomeric factor triggers dystrophic neurite formation (e.g. cholinergic and galaninergic dystrophic neurites) in the early phases of the disease. It is possible that once this process has started, amylogenic based therapies may not be functionally efficacious. However, detailing which neurotransmitter systems most prone to neuritic degeneration would be beneficial for the development of novel drugs for the treatment of axonal degeneration in AD. Interestingly, several reports have shown that Gal reduces amyloid-induced toxicity in cell culture models of AD-like pathology [69,70,71,72] suggesting that this neuropeptide is neuroprotective against amyloid toxicity. Therefore, understanding interaction of Gal with amyloid in AD pathogenesis is an intriguing question in the quest for the development of novel drug therapies for AD.
Whether the pathological differences we observed between the cholinergic and galaninergic systems are present in human AD has yet to be systematically investigated. For the most part, neocortical and hippocampal cholinergic innervation patterns overlap between rodents [73,74,75] and primates, including humans [76,77]. Although a reduction in ChAT activity is not observed until the later stages of AD [20, 46,78], dystrophic ChAT-ir fibers similar in appearance to those described in our mutant mice occur in people who died with a preclinical Braak stage I and II neuropathological diagnosis [79,80], suggesting that cellular neurodegeneration has been initiated. On the other hand, Gal neocortical and hippocampal fiber innervation most likely arises from galaninergic neurons of the LC, which are also the source of noradrenergic fibers to these regions [7,25]. Gal binds to Gal receptor 1 (GalR1), GalR2 and GalR3 for its functional activity [26,81]. Since there is an almost complete overlap between the expression of Gal and noradrenergic LC neurons in the rodent, it is likely that many of the Gal neurites also would be positive for the noradrenergic marker, tyrosine hydroxylase [43]. Recent studies have shown that noradrenergic depletion induced by chemical lesion of the LC potentiates amyloid pathology in AD transgenic mouse models of amyloidosis suggesting that this brainstem noradrenergic projection system plays a role in plaque formation [82,83]. It is possible that LC neuronal loss in AD is permissive for neuronal death due to alterations in amyloid deposition. However, the interaction of Gal and noradrenergic systems upon the formation of amyloid plaques in AD remains an intriguing question.
Interestingly, the extensive Gal neocortical and hippocampal innervation visualized by immunohistochemistry in the rodent [25] has not been reported in the aged human or AD brain [84]. This discrepancy may be related to use of the microtubule destabilizer, colchicine, to enhance the visualization of peptides in the animal brain [25]. In contrast to the extensive neocortical and hippocampal cholinergic dystrophic neuritic formation, Gal fiber hypertrophy is found in close apposition to surviving CBF and LC neurons in AD [3, 7]. This observation has lead to the suggestion that Gal is neuroprotective for, at least, CBF neurons [7, 85]. However, in both animal models of AD and in the human disease galaninergic and cholinergic fibers display axonal dystrophy, which in both cases may be related to some form of amyloid-based triggering mechanisms or other as yet unknown causal factor(s). On the other hand, Gal may be neuroprotective resulting in a reduction in dystrophic neurite formation in the face of amyloid toxicity.
Acknowledgments
We thank by Dr. O. Lazarov for providing the tg mice. Supported by RO1AG10668 (EJM), Shapiro Fiundatin (EJM) and the Wellcome Fund (DW).
References
- 1.Bancher C, Brunner C, Lassmann H, Budka H, Jellinger K, Seitelberger F, Grundke-Iqbal I, Iqbal K, Wisniewski HM. Tau and ubiquitin immunoreactivity at different stages of formation of Alzheimer neurofibrillary tangles. Prog Clin Biol Res. 1989;317:837–848. [PubMed] [Google Scholar]
- 2.Bobinski M, Wegiel J, Tarnawski M, de Leon MJ, Reisberg B, Miller DC, Wisniewski HM. Duration of neurofibrillary changes in the hippocampal pyramidal neurons. Brain Res. 1998;799:156–158. doi: 10.1016/s0006-8993(98)00441-7. [DOI] [PubMed] [Google Scholar]
- 3.Chan-Palay V. Galanin hyperinnervates surviving neurons of the human basal nucleus of Meynert in dementias of Alzheimer’s and Parkinson’s disease: a hypothesis for the role of galanin in accentuating cholinergic dysfunction in dementia. J Comp Neurol. 1988;273:543–557. doi: 10.1002/cne.902730409. [DOI] [PubMed] [Google Scholar]
- 4.Chan-Palay V. Hyperinnervation of surviving neurons of the human basal nucleus of meynert by galanin in dementias of Alzheimer’s and Parkinson’s disease. Adv Neurol. 1990;51:253–255. [PubMed] [Google Scholar]
- 5.Benzing WC, Kordower JH, Mufson EJ. Galanin immunoreactivity within the primate basal forebrain: evolutionary change between monkeys and apes. J Comp Neurol. 1993;336:31–39. doi: 10.1002/cne.903360103. [DOI] [PubMed] [Google Scholar]
- 6.Benzing WC, Brady DR, Mufson EJ, Armstrong DM. Evidence that transmitter-containing dystrophic neurites precede those containing paired helical filaments within senile plaques in the entorhinal cortex of nondemented elderly and Alzheimer’s disease patients. Brain Res. 1993;619:55–68. doi: 10.1016/0006-8993(93)91595-j. [DOI] [PubMed] [Google Scholar]
- 7.Mufson EJ, Cochran E, Benzing W, Kordower JH. Galaninergic innervation of the cholinergic vertical limb of the diagonal band (Ch2) and bed nucleus of the stria terminalis in aging, Alzheimer’s disease and Down’s syndrome. Dementia. 1993;4:237–250. doi: 10.1159/000107329. [DOI] [PubMed] [Google Scholar]
- 8.Bierer LM, Haroutunian V, Gabriel S, Knott PJ, Carlin LS, Purohit DP, Perl DP, Schmeidler J, Kanof P, Davis KL. Neurochemical correlates of dementia severity in Alzheimer’s disease: relative importance of the cholinergic deficits. J Neurochem. 1995;64:749–760. doi: 10.1046/j.1471-4159.1995.64020749.x. [DOI] [PubMed] [Google Scholar]
- 9.Bell KF, Ducatenzeiler A, Ribeiro-da-Silva A, Duff K, Bennett DA, Cuello AC. The amyloid pathology progresses in a neurotransmitter-specific manner. Neurobiol Aging. 2006;27:1644–1657. doi: 10.1016/j.neurobiolaging.2005.09.034. [DOI] [PubMed] [Google Scholar]
- 10.Perez SE, Dar S, Ikonomovic MD, DeKosky ST, Mufson EJ. Cholinergic forebrain degeneration in the AβPPswe/PS1DeltaE9 transgenic mouse. Neurobiol Dis. 2007;28:3–15. doi: 10.1016/j.nbd.2007.06.015. [DOI] [PMC free article] [PubMed] [Google Scholar]
- 11.Mitchell TW, Mufson EJ, Schneider JA, Cochran EJ, Nissanov J, Han LY, Bienias JL, Lee VM, Trojanowski JQ, Bennett DA, Arnold SE. Parahippocampal tau pathology in healthy aging, mild cognitive impairment, and early Alzheimer’s disease. Ann Neurol. 2002;51:182–189. doi: 10.1002/ana.10086. [DOI] [PubMed] [Google Scholar]
- 12.Lewis PR, Shute CC. The cholinergic limbic system: projections to hippocampal formation, medial cortex, nuclei of the ascending cholinergic reticular system, and the subfornical organ and supra-optic crest. Brain. 1967;90:521–540. doi: 10.1093/brain/90.3.521. [DOI] [PubMed] [Google Scholar]
- 13.Whitehouse PJ, Price DL, Clark AW, Coyle JT, DeLong MR. Alzheimer disease: evidence for selective loss of cholinergic neurons in the nucleus basalis. Ann Neurol. 1981;10:122–126. doi: 10.1002/ana.410100203. [DOI] [PubMed] [Google Scholar]
- 14.Davies P, Maloney AJ. Selective loss of central cholinergic neurons in Alzheimer’s disease. Lancet. 1976;2:1403. doi: 10.1016/s0140-6736(76)91936-x. [DOI] [PubMed] [Google Scholar]
- 15.Bowen DM, Smith CB, White P, Davison AN. Neurotransmitter-related enzymes and indices of hypoxia in senile dementia and other abiotrophies. Brain. 1976;99:459–496. doi: 10.1093/brain/99.3.459. [DOI] [PubMed] [Google Scholar]
- 16.Perry EK, Perry RH, Gibson PH, Blessed G, Tomlinson BE. A cholinergic connection between normal aging and senile dementia in the human hippocampus. Neurosci Lett. 1977;6:85–89. doi: 10.1016/0304-3940(77)90070-2. [DOI] [PubMed] [Google Scholar]
- 17.Mesulam MM, Mufson EJ, Levey AI, Wainer BH. Cholinergic innervation of cortex by the basal forebrain: cytochemistry and cortical connections of the septal area, diagonal band nuclei, nucleus basalis (substantia innominata), and hypothalamus in the rhesus monkey. J Comp Neurol. 1983;214:170–197. doi: 10.1002/cne.902140206. [DOI] [PubMed] [Google Scholar]
- 18.White P, Hiley CR, Goodhardt MJ, Carrasco LH, Keet JP, Williams IE, Bowen DM. Neocortical cholinergic neurons in elderly people. Lancet. 1977;1:668–671. doi: 10.1016/s0140-6736(77)92114-6. [DOI] [PubMed] [Google Scholar]
- 19.DeKosky ST, Harbaugh RE, Schmitt FA, Bakay RA, Chui HC, Knopman DS, Reeder TM, Shetter AG, Senter HJ, Markesbery WR. Cortical biopsy in Alzheimer’s disease: diagnostic accuracy and neurochemical, neuropathological, and cognitive correlations. Intraventricular Bethanecol Study Group. Ann Neurol. 1992;32:625–632. doi: 10.1002/ana.410320505. [DOI] [PubMed] [Google Scholar]
- 20.DeKosky ST, Ikonomovic MD, Styren SD, Beckett L, Wisniewski S, Bennett DA, Cochran EJ, Kordower JH, Mufson EJ. Upregulation of choline acetyltransferase activity in hippocampus and frontal cortex of elderly subjects with mild cognitive impairment. Ann Neurol. 2002;51:145–155. doi: 10.1002/ana.10069. [DOI] [PubMed] [Google Scholar]
- 21.Gabriel SM, Bierer LM, Davidson M, Purohit DP, Perl DP, Harotunian V. Galanin-like immunoreactivity is increased in the postmortem cerebral cortex from patients with Alzheimer’s disease. J Neurochem. 1994;62:1516–1523. doi: 10.1046/j.1471-4159.1994.62041516.x. [DOI] [PubMed] [Google Scholar]
- 22.Kowall NW, Beal MF. Galanin-like immunoreactivity is present in human substantia innominata and in senile plaques in Alzheimer’s disease. Neurosci Lett. 1989;98:118–123. doi: 10.1016/0304-3940(89)90384-4. [DOI] [PubMed] [Google Scholar]
- 23.Counts SE, Chen EY, Che S, Ikonomovic MD, Wuu J, Ginsberg SD, Dekosky ST, Mufson EJ. Galanin fiber hypertrophy within the cholinergic nucleus basalis during the progression of Alzheimer’s disease. Dement Geriatr Cogn Disord. 2006;21:205–214. doi: 10.1159/000090906. [DOI] [PubMed] [Google Scholar]
- 24.Diez M, Danner S, Frey P, Sommer B, Staufenbiel M, Wiederhold KH, Hökfelt T. Neuropeptide alterations in the hippocampal formation and cortex of transgenic mice overexpressing beta-amyloid precursor protein (APP) with the Swedish double mutation (APP23) Neurobiol Dis. 2003;14:579–594. doi: 10.1016/j.nbd.2003.08.003. [DOI] [PubMed] [Google Scholar]
- 25.Pérez SE, Wynick D, Steiner RA, Mufson EJ. Distribution of galaninergic immunoreactivity in the brain of the mouse. J Comp Neurol. 2001;434:158–185. doi: 10.1002/cne.1171. [DOI] [PubMed] [Google Scholar]
- 26.Counts SE, Perez SE, Mufson EJ. Galanin in Alzheimer’s disease: neuroinhibitory or neuroprotective? Cell Mol Life Sci. 2008;65:1842–1853. doi: 10.1007/s00018-008-8159-2. [DOI] [PMC free article] [PubMed] [Google Scholar]
- 27.Holmes C, Boche D, Wilkinson D, Yadegarfar G, Hopkins V, Bayer A, Jones RW, Bullock R, Love S, Neal JW, Zotova E, Nicoll JA. Long-term effects of Abeta42 immunisation in Alzheimer’s disease: follow-up of a randomised, placebo-controlled phase I trial. Lancet. 2008;372:216–223. doi: 10.1016/S0140-6736(08)61075-2. [DOI] [PubMed] [Google Scholar]
- 28.Forman MS, Mufson EJ, Leurgans S, Pratico D, Joyce S, Leight S, Lee VM, Trojanowski JQ. Cortical biochemistry in MCI and Alzheimer disease: lack of correlation with clinical diagnosis. Neurology. 2007;68:757–763. doi: 10.1212/01.wnl.0000256373.39415.b1. [DOI] [PubMed] [Google Scholar]
- 29.Borchelt DR, Thinakaran G, Eckman CB, Lee MK, Davenport F, Ratovitsky T, Prada CM, Kim G, Seekins S, Yager D, Slunt HH, Wang R, Seeger M, Levey AI, Gandy SE, Copeland NG, Jenkins NA, Price DL, Younkin SG, Sisodia SS. Familial Alzheimer’s disease-linked presenilin 1 variants elevate Abeta1-42/1-40 ratio in vitro and in vivo. Neuron. 1996;17:1005–1013. doi: 10.1016/s0896-6273(00)80230-5. [DOI] [PubMed] [Google Scholar]
- 30.Borchelt DR, Ratovitski T, van Lare J, Lee MK, Gonzales V, Jenkins NA, Copeland NG, Price DL, Sisodia SS. Accelerated amyloid deposition in the brains of transgenic mice coexpressing mutant presenilin 1 and amyloid precursor proteins. Neuron. 1997;19:939–945. doi: 10.1016/s0896-6273(00)80974-5. [DOI] [PubMed] [Google Scholar]
- 31.Jankowsky JL, Slunt HH, Ratovitski T, Jenkins NA, Copeland NG, Borchelt DR. Co-expression of multiple transgenes in mouse CNS: a comparison of strategies. Biomol Eng. 2001;17:157–165. doi: 10.1016/s1389-0344(01)00067-3. [DOI] [PubMed] [Google Scholar]
- 32.Hu YS, Xu P, Pigino G, Brady ST, Larson J, Lazarov O. Complex environment experience rescues impaired neurogenesis, enhances synaptic plasticity, and attenuates neuropathology in familial Alzheimer’s disease-linked APPswe/PS1DeltaE9 mice. FASEB J. 2010;24:1667–1681. doi: 10.1096/fj.09-136945. [DOI] [PMC free article] [PubMed] [Google Scholar]
- 33.Jaffar S, Counts SE, Ma SY, Dadko E, Gordon MN, Morgan D, Mufson EJ. Neuropathology of mice carrying mutant APP(swe) and/or PS1(M146L) transgenes: alterations in the p75(NTR) cholinergic basal forebrain septohippocampal pathway. Exp Neurol. 2001;170:227–243. doi: 10.1006/exnr.2001.7710. [DOI] [PubMed] [Google Scholar]
- 34.Masters CL, Simms G, Weinman NA, Multhaup G, McDonald BL, Beyreuther K. Amyloid plaque core protein in Alzheimer disease and Down syndrome. Proc Natl Acad Sci U S A. 1985;82:4245–4249. doi: 10.1073/pnas.82.12.4245. [DOI] [PMC free article] [PubMed] [Google Scholar]
- 35.Haass C, Schlossmacher MG, Hung AY, Vigo-Pelfrey C, Mellon A, Ostaszewski BL, Lieberburg I, Koo EH, Schenk D, Teplow DB, Selkoe DJ. Amyloid beta-peptide is produced by cultured cells during normal metabolism. Nature. 1992;359:322–325. doi: 10.1038/359322a0. [DOI] [PubMed] [Google Scholar]
- 36.Oh KJ, Perez SE, Lagalwar S, Vana L, Binder L, Mufson EJ. Staging of Alzheimer’s pathology in triple transgenic mice: a light and electron microscopic analysis. Int J Alzheimers Dis. 2010;15 doi: 10.4061/2010/780102. pii:780102. [DOI] [PMC free article] [PubMed] [Google Scholar]
- 37.Perez SE, He B, Muhammad N, Oh KJ, Fahnestock M, Ikonomovic MD, Mufson EJ. Cholinotrophic basal forebrain system alterations in 3xTg-AD transgenic mice. Neurobiol Dis. 2010 doi: 10.1016/j.nbd.2010.10.002. [Epub ahead of print] [DOI] [PMC free article] [PubMed] [Google Scholar]
- 38.Gundersen HJ, Jensen EB, Kiêu K, Nielsen J. The efficiency of systematic sampling in stereology--reconsidered. J Microsc. 1999;193:199–211. doi: 10.1046/j.1365-2818.1999.00457.x. [DOI] [PubMed] [Google Scholar]
- 39.Paxinos G, Franklin KBJ. The Mouse Brain in Stereotaxic Coordinate. 2. Academic Press; San Diego: 2001. [Google Scholar]
- 40.Livy DJ, Schalomon PM, Roy M, Zacharias MC, Pimenta J, Lent R, Wahlsten D. Increased axon number in the anterior commissure of mice lacking a corpus callosum. Exp Neurol. 1997;146:491–501. doi: 10.1006/exnr.1997.6564. [DOI] [PubMed] [Google Scholar]
- 41.Lazarov O, Lee M, Peterson DA, Sisodia SS. Evidence that synaptically released beta-amyloid accumulates as extracellular deposits in the hippocampus of transgenic mice. J Neurosci. 2002;22:9785–9793. doi: 10.1523/JNEUROSCI.22-22-09785.2002. [DOI] [PMC free article] [PubMed] [Google Scholar]
- 42.Perez SE, Lazarov O, Koprich JB, Chen EY, Rodriguez-Menendez V, Lipton JW, Sisodia SS, Mufson EJ. Nigrostriatal dysfunction in familial Alzheimer’s disease-linked APPswe/PS1DeltaE9 transgenic mice. J Neurosci. 2005;25:10220–10229. doi: 10.1523/JNEUROSCI.2773-05.2005. [DOI] [PMC free article] [PubMed] [Google Scholar]
- 43.Melander T, Hökfelt T, Rökaeus A, Cuello AC, Oertel WH, Verhofstad A, Goldstein M. Coexistence of galanin-like immunoreactivity with catecholamines, 5-hydroxytryptamine, GABA and neuropeptides in the rat CNS. J Neurosci. 1986;6:3640–3654. doi: 10.1523/JNEUROSCI.06-12-03640.1986. [DOI] [PMC free article] [PubMed] [Google Scholar]
- 44.Ikonomovic MD, Mufson EJ, Wuu J, Cochran EJ, Bennett DA, DeKosky ST. Cholinergic plasticity in hippocampus of individuals with mild cognitive impairment: correlation with Alzheimer’s neuropathology. J Alzheimers Dis. 2003;5:39–48. doi: 10.3233/jad-2003-5106. [DOI] [PubMed] [Google Scholar]
- 45.Peterson DA, Dickinson-Anson HA, Leppert JT, Lee KF, Gage FH. Central neuronal loss and behavioral impairment in mice lacking neurotrophin receptor p75. J Comp Neurol. 1999;404:1–20. doi: 10.1002/(sici)1096-9861(19990201)404:1<1::aid-cne1>3.0.co;2-#. [DOI] [PubMed] [Google Scholar]
- 46.Gilmor ML, Erickson JD, Varoqui H, Hersh LB, Bennett DA, Cochran EJ, Mufson EJ, Levey AI. Preservation of nucleus basalis neurons containing choline acetyltransferase and the vesicular acetylcholine transporter in the elderly with mild cognitive impairment and early Alzheimer’s disease. J Comp Neurol. 1999;411:693–704. [PubMed] [Google Scholar]
- 47.Diez M, Koistinaho J, Kahn K, Games D, Hökfelt T. Neuropeptides in hippocampus and cortex in transgenic mice overexpressing V717F beta-amyloid precursor protein--initial observations. Neuroscience. 2000;100:259–286. doi: 10.1016/s0306-4522(00)00261-x. [DOI] [PubMed] [Google Scholar]
- 48.Jack CR, Jr, Lowe VJ, Weigand SD, Wiste HJ, Senjem ML, Knopman DS, Shiung MM, Gunter JL, Boeve BF, Kemp BJ, Weiner M, Petersen RC Alzheimer’s Disease Neuroimaging Initiative . Serial PIB and MRI in normal, mild cognitive impairment and Alzheimer’s disease: implications for sequence of pathological events in Alzheimer’s disease. Brain. 2009;132:1355–1365. doi: 10.1093/brain/awp062. [DOI] [PMC free article] [PubMed] [Google Scholar]
- 49.Verret L, Jankowsky JL, Xu GM, Borchelt DR, Rampon C. Alzheimer’s-type amyloidosis in transgenic mice impairs survival of newborn neurons derived from adult hippocampal neurogenesis. J Neurosci. 2007;27:6771–6780. doi: 10.1523/JNEUROSCI.5564-06.2007. [DOI] [PMC free article] [PubMed] [Google Scholar]
- 50.Christie RH, Bacskai BJ, Zipfel WR, Williams RM, Kajdasz ST, Webb WW, Hyman BT. Growth arrest of individual senile plaques in a model of Alzheimer’s disease observed by in vivo multiphoton microscopy. J Neurosci. 2001;21:858–864. doi: 10.1523/JNEUROSCI.21-03-00858.2001. [DOI] [PMC free article] [PubMed] [Google Scholar]
- 51.Spires TL, Meyer-Luehmann M, Stern EA, McLean PJ, Skoch J, Nguyen PT, Bacskai BJ, Hyman BT. Dendritic spine abnormalities in amyloid precursor protein transgenic mice demonstrated by gene transfer and intravital multiphoton microscopy. J Neurosci. 2005;25:7278–7287. doi: 10.1523/JNEUROSCI.1879-05.2005. [DOI] [PMC free article] [PubMed] [Google Scholar]
- 52.Meyer-Luehmann M, Spires-Jones TL, Prada C, Garcia-Alloza M, de Calignon A, Rozkalne A, Koenigsknecht-Talboo J, Holtzman DM, Bacskai BJ, Hyman BT. Rapid appearance and local toxicity of amyloid-beta plaques in a mouse model of Alzheimer’s disease. Nature. 2008;451:720–724. doi: 10.1038/nature06616. [DOI] [PMC free article] [PubMed] [Google Scholar]
- 53.Delatour B, Blanchard V, Pradier L, Duyckaerts C. Alzheimer pathology disorganizes cortico-cortical circuitry: direct evidence from a transgenic animal model. Neurobiol Dis. 2004;16:41–47. doi: 10.1016/j.nbd.2004.01.008. [DOI] [PubMed] [Google Scholar]
- 54.Delatour B, Guégan M, Volk A, Dhenain M. In vivo MRI and histological evaluation of brain atrophy in APP/PS1 transgenic mice. Neurobiol Aging. 2006;27:835–847. doi: 10.1016/j.neurobiolaging.2005.04.011. [DOI] [PubMed] [Google Scholar]
- 55.Cooper JD, Salehi A, Delcroix JD, Howe CL, Belichenko PV, Chua-Couzens J, Kilbridge JF, Carlson EJ, Epstein CJ, Mobley WC. Failed retrograde transport of NGF in a mouse model of Down’s syndrome: reversal of cholinergic neurodegenerative phenotypes following NGF infusion. Proc Natl Acad Sci U S A. 2001;98:10439–10444. doi: 10.1073/pnas.181219298. [DOI] [PMC free article] [PubMed] [Google Scholar]
- 56.Stokin GB, Lillo C, Falzone TL, Brusch RG, Rockenstein E, Mount SL, Raman R, Davies P, Masliah E, Williams DS, Goldstein LS. Axonopathy and transport deficits early in the pathogenesis of Alzheimer’s disease. Science. 2005;307:1282–1288. doi: 10.1126/science.1105681. [DOI] [PubMed] [Google Scholar]
- 57.Iqbal K, Grundke-Iqbal I, Zaidi T, Merz PA, Wen GY, Shaikh SS, Wisniewski HM, Alafuzoff I, Winblad B. Defective brain microtubule assembly in Alzheimer’s disease. Lancet. 1986;2:421–426. doi: 10.1016/s0140-6736(86)92134-3. Erratum in: Lancet 2, 1174. [DOI] [PubMed] [Google Scholar]
- 58.Cash AD, Aliev G, Siedlak SL, Nunomura A, Fujioka H, Zhu X, Raina AK, Vinters HV, Tabaton M, Johnson AB, Paula-Barbosa M, Avíla J, Jones PK, Castellani RJ, Smith MA, Perry G. Microtubule reduction in Alzheimer’s disease and aging is independent of tau filament formation. Am J Pathol. 2003;162:1623–1627. doi: 10.1016/s0002-9440(10)64296-4. [DOI] [PMC free article] [PubMed] [Google Scholar]
- 59.Stokin GB, Goldstein LS. Axonal transport and Alzheimer’s disease. Annu Rev Biochem. 2006;75:607–627. doi: 10.1146/annurev.biochem.75.103004.142637. [DOI] [PubMed] [Google Scholar]
- 60.Bell KF, de Kort GJ, Steggerda S, Shigemoto R, Ribeiro-da-Silva A, Cuello AC. Structural involvement of the glutamatergic presynaptic boutons in a transgenic mouse model expressing early onset amyloid pathology. Neurosci Lett. 2003;353:143–147. doi: 10.1016/j.neulet.2003.09.027. [DOI] [PubMed] [Google Scholar]
- 61.Cortés R, Villar MJ, Verhofstad A, Hökfelt T. Effects of central nervous system lesions on the expression of galanin: a comparative in situ hybridization and immunohistochemical study. Proc Natl Acad Sci U S A. 1990;87:7742–7746. doi: 10.1073/pnas.87.19.7742. [DOI] [PMC free article] [PubMed] [Google Scholar]
- 62.Holmes PV, Crawley JN. Olfactory bulbectomy increases prepro-galanin mRNA levels in the rat locus coeruleus. Brain Res Mol Brain Res. 1996;36:184–188. doi: 10.1016/0169-328x(95)00295-4. [DOI] [PubMed] [Google Scholar]
- 63.Wang LH, Lu YJ, Bao L, Zhang X. Peripheral nerve injury induces reorganization of galanin-containing afferents in the superficial dorsal horn of monkey spinal cord. Eur J Neurosci. 2007;25:1087–1096. doi: 10.1111/j.1460-9568.2007.05372.x. [DOI] [PubMed] [Google Scholar]
- 64.Wynick D, Thompson SW, McMahon SB. The role of galanin as a multi-functional neuropeptide in the nervous system. Curr Opin Pharmacol. 2001;1:73–77. doi: 10.1016/s1471-4892(01)00006-6. [DOI] [PubMed] [Google Scholar]
- 65.Mufson EJ, Deecher DC, Basile M, Izenwasse S, Mash DC. Galanin receptor plasticity within the nucleus basalis in early and late Alzheimer’s disease: an in vitro autoradiographic analysis. Neuropharmacology. 2000;39:1404–1412. doi: 10.1016/s0028-3908(00)00011-3. [DOI] [PubMed] [Google Scholar]
- 66.Planas B, Kolb PE, Raskind MA, Miller MA. Nerve growth factor induces galanin gene expression in the rat basal forebrain: implications for the treatment of cholinergic dysfunction. J Comp Neurol. 1997;379:563–570. [PubMed] [Google Scholar]
- 67.Liu H, Liu Z, Xu X, Yang X, Wang H, Li Z. Nerve growth factor regulates galanin and neuropeptide Y expression in primary cultured superior cervical ganglion neurons. Pharmazie. 2010;65:219–223. [PubMed] [Google Scholar]
- 68.Wong TP, Debeir T, Duff K, Cuello AC. Reorganization of cholinergic terminals in the cerebral cortex and hippocampus in transgenic mice carrying mutated presenilin-1 and amyloid precursor protein transgenes. J Neurosci. 1999;19:2706–2716. doi: 10.1523/JNEUROSCI.19-07-02706.1999. [DOI] [PMC free article] [PubMed] [Google Scholar]
- 69.Ding X, MacTavish D, Kar S, Jhamandas JH. Galanin attenuates beta-amyloid (Abeta) toxicity in rat cholinergic basal forebrain neurons. Neurobiol Dis. 2006;21:413–420. doi: 10.1016/j.nbd.2005.08.016. [DOI] [PubMed] [Google Scholar]
- 70.Cui J, Chen Q, Yue X, Jiang X, Gao GF, Yu LC, Zhang Y. Galanin protects against intracellular amyloid toxicity in human primary neurons. J Alzheimers Dis. 2010;19:529–544. doi: 10.3233/JAD-2010-1246. [DOI] [PubMed] [Google Scholar]
- 71.Elliott-Hunt CR, Holmes FE, Hartley DM, Perez S, Mufson EJ, Wynick D. Endogenous galanin is neuroprotective against amyloid toxicity in mouse hippocampal neurons via activation of the second galanin receptor. J Alz Dis. doi: 10.3233/JAD-2011-110011. In press. [DOI] [PMC free article] [PubMed] [Google Scholar]
- 72.Counts SE, Mufson EJ. Noradrenaline activation of neurotrophic pathways protects against neuronal amyloid toxicity. J Neurochem. 2010;113:649–660. doi: 10.1111/j.1471-4159.2010.06622.x. [DOI] [PMC free article] [PubMed] [Google Scholar]
- 73.Armstrong DM, Saper CB, Levey AI, Wainer BH, Terry RD. Distribution of cholinergic neurons in rat brain: demonstrated by the immunocytochemical localization of choline acetyltransferase. J Comp Neurol. 1983;216:53–68. doi: 10.1002/cne.902160106. [DOI] [PubMed] [Google Scholar]
- 74.Rye DB, Wainer BH, Mesulam MM, Mufson EJ, Saper CB. Cortical projections arising from the basal forebrain: a study of cholinergic and noncholinergic components employing combined retrograde tracing and immunohistochemical localization of choline acetyltransferase. Neuroscience. 1984;13:627–643. doi: 10.1016/0306-4522(84)90083-6. [DOI] [PubMed] [Google Scholar]
- 75.Woolf NJ, Eckenstein F, Butcher LL. Cholinergic systems in the rat brain: I. projections to the limbic telencephalon. Brain Res Bull. 1984;13:751–784. doi: 10.1016/0361-9230(84)90236-3. [DOI] [PubMed] [Google Scholar]
- 76.Mesulam MM, Geula C. Nucleus basalis (Ch4) and cortical cholinergic innervation in the human brain: observations based on the distribution of acetylcholinesterase and choline acetyltransferase. J Comp Neurol. 1988;275:216–240. doi: 10.1002/cne.902750205. [DOI] [PubMed] [Google Scholar]
- 77.Mufson EJ, Bothwell M, Hersh LB, Kordower JH. Nerve growth factor receptor immunoreactive profiles in the normal, aged human basal forebrain: colocalization with cholinergic neurons. J Comp Neurol. 1989;285:196–217. doi: 10.1002/cne.902850204. [DOI] [PubMed] [Google Scholar]
- 78.Davies P. Challenging the cholinergic hypothesis in Alzheimer disease. JAMA. 1999;281:1433–1434. doi: 10.1001/jama.281.15.1433. [DOI] [PubMed] [Google Scholar]
- 79.Braak H, Braak E. Neuropathological stageing of Alzheimer-related changes. Acta Neuropathol. 1991;82:239–259. doi: 10.1007/BF00308809. [DOI] [PubMed] [Google Scholar]
- 80.Sassin I, Schultz C, Thal DR, Rüb U, Arai K, Braak E, Braak H. Evolution of Alzheimer’s disease-related cytoskeletal changes in the basal nucleus of Meynert. Acta Neuropathol. 2000;100:259–269. doi: 10.1007/s004019900178. [DOI] [PubMed] [Google Scholar]
- 81.Bartfai T, Langel U, Bedecs K, Andell S, Land T, Gregersen S, Ahrén B, Girotti P, Consolo S, Corwin R, et al. Galanin-receptor ligand M40 peptide distinguishes between putative galanin-receptor subtypes. Proc Natl Acad Sci U S A. 1993;90:11287–11291. doi: 10.1073/pnas.90.23.11287. [DOI] [PMC free article] [PubMed] [Google Scholar]
- 82.Heneka MT, Ramanathan M, Jacobs AH, Dumitrescu-Ozimek L, Bilkei-Gorzo A, Debeir T, Sastre M, Galldiks N, Zimmer A, Hoehn M, Heiss WD, Klockgether T, Staufenbiel M. Locus ceruleus degeneration promotes Alzheimer pathogenesis in amyloid precursor protein 23 transgenic mice. J Neurosci. 2006;26:1343–1354. doi: 10.1523/JNEUROSCI.4236-05.2006. [DOI] [PMC free article] [PubMed] [Google Scholar]
- 83.Kalinin S, Gavrilyuk V, Polak PE, Vasser R, Zhao J, Heneka MT, Feinstein DL. Noradrenaline deficiency in brain increases beta-amyloid plaque burden in an animal model of Alzheimer’s disease. Neurobiol Aging. 2007;28:1206–1214. doi: 10.1016/j.neurobiolaging.2006.06.003. [DOI] [PubMed] [Google Scholar]
- 84.Kordower JH, Mufson EJ. NGF and Alzheimer’s disease: unfulfilled promise and untapped potential. Neurobiol Aging. 1989;10:543–544. doi: 10.1016/0197-4580(89)90123-1. [DOI] [PubMed] [Google Scholar]
- 85.Counts SE, He B, Che S, Ginsberg SD, Mufson EJ. Galanin fiber hyperinnervation preserves neuroprotective gene expression in cholinergic basal forebrain neurons in Alzheimer’s disease. J Alzheimers Dis. 2009;18:885–896. doi: 10.3233/JAD-2009-1196. [DOI] [PMC free article] [PubMed] [Google Scholar]