Abstract
Non-linear phase dispersion spectroscopy (NLDS) is introduced as a means to retrieve wide-band, high spectral resolution profiles of the wavelength-dependent, real part of the refractive index. The method is based on detecting dispersion effects imparted to a light field with low coherence transmitted through a thin sample and detected interferometrically in the spectral domain. The same sampled signal is also processed to yield quantitative phase maps and spectral information regarding the total attenuation coefficient using spectral domain phase microscopy (SDPM) and spectroscopic optical coherence tomography (SOCT), respectively. Proof of concept experiments using fluorescent and non-fluorescent polystyrene beads, and another using a red blood cell demonstrate the ability of the method to quantify various absorptive/dispersive features. The increased sensitivity of this novel method is compared to intensity-based spectroscopy (e.g., SOCT) and potential applications are discussed.
Spectral-domain phase microscopy (SDPM) is an extension of optical coherence tomography (OCT) which provides quantitative optical path delay information with nano-to picometer sensitivity [1]. Similar to quantitative digital holographic techniques [2, 3], SDPM is realized by interfering a sample wave with a reference wave; however, SDPM detects the phase of spectrally resolved oscillations rather than spatial fringes. As a result, spectral information is more readily accessible in SDPM. Spectroscopic OCT (SOCT) [4] takes advantage of this additional dimension to provide functional information regarding the wavelength-dependent total attenuation coefficient [5–8]. In analogy to SOCT, spectroscopic phase techniques have been developed to probe the wavelength-dependent real part of the refractive index (RI), thereby granting access to the dispersion-causing biochemical properties of samples[2, 9, 10]. However, such methods to date have required multiple light sources or narrow bandpass filters, thus limiting the spectral information to a few narrow spectral regions.
In this letter, we introduce non-linear phase dispersion spectroscopy (NLDS) to provide wide-band, high-resolution spectral information of the real part of the RI. In addition, complimentary information is obtained from the same sampled data using SDPM and SOCT to yield quantitative topographical maps and spectral profiles of the total attenuation coefficient of samples, respectively. Proof of concept experiments using fluorescent and non-fluorescent polystyrene beads, and a red blood cell (RBC) are presented, and potential applications are discussed.
Consider the SDPM signal from a specific point of an absorbing sample: I(ω) = IR(ω) + IS(ω) + IINT(ω), where the first two terms describe the reference and sample field intensities, and the third term, IINT(ω), contains the interferometric information of interest. We have previously shown that IINT(ω), may be described as[6]:
| (1) |
where μtot is the total attenuation coefficient, d is the sample thickness where we assume that the sample and reference arms are path-length matched at the sample surface, c0 is the speed of light in vacuum, n0 is the average RI of the sample, and Δn describes spectrally-dependent RI changes relative to the average value. The first term in Eq. 1 contains information regarding the total attenuation of the sample field, and may be retrieved using SOCT techniques [11]. The second term of IINT(ω) describes the linear phase and can be obtained using SDPM. Let us consider that d may be expanded as multiples of the source’s coherence length, lc and a sub-coherence length deviation, δ, given as d = mlc + δlc, where m is an integer. Thus, a fast Fourier transform (FFT) of Eq. 1, ignoring the third term for now, reveals a peak located at 2n0mlc, whereas the phase angle at the same point gives φ = (2π/λ0) · 2n0δlc, where λ0 is the center wavelength. Thus, with a reasonable assumption regarding the average RI, the linear phase term yields the value d, thereby providing quantitative structural information. Lastly, the third term contains the changes in the RI with respect to wavelength, Δn, and is identified in Eq. 1 by its non-linear phase. This non-linear phase term is the source of information for NLDS, which grants access to the dispersion-causing biochemical properties of samples. It is important to note that even though multiple parameters are embedded in the sampled signal—specifically, μtot in the intensity modulated term, d in the linear phase term, and Δn in the non-linear phase term—each is uniquely contained in only one of the three terms of Eq. 1, ultimately allowing independent assessment of all these parameters of interest.
The experimental system used to demonstrate this method consists of a super continuum laser source (Fianium) and a 4f Michelson interferometer, similar to that described in Ref. [12], where collimated light is delivered to the sample. Two 40X, 0.66 NA, infinity-corrected microscope objectives(L-40X, Newport) are used in the sample and reference arms, producing a lateral resolution of 0.46 μm. The samples are placed on a silvered surface, and the reflected light is imaged onto the entrance slit of an imaging spectrograph, thus allowing acquisition of multiple spectral interferograms across one lateral dimension. The sample is then translated using a motorized translational stage to obtain the complementary lateral dimension. Here, the visible region of the spectrum is employed with detection centered about λ0 = 575 nm, bandwidth Δλ = 240 nm, and spectral resolution δλ =0.2 nm.
The first experiment was conducted using fluorescent (Invitrogen F8833) and non-fluorescent (Thermo Scientific), 10 μm polystyrene beads. The beads were dried on a silvered coverglass and immersed in glycerol, to minimize the number of phase wraps. Once the raw interferograms were acquired, they were interpolated from wavelength to a linear wavenumber vector.
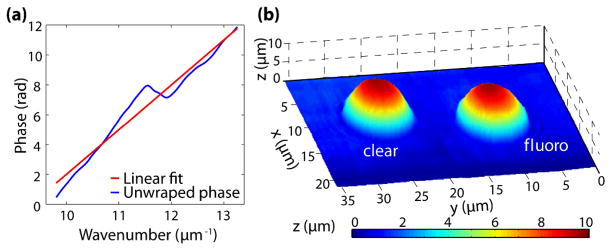
Next, the linear phase is processed using SDPM to acquire structural information. To achieve this, an FFT of the interferograms must be computed, however dispersion effects have to be eliminated first. Thus, the phase of each interferogram is unwrapped and a line of the form of φlin = (ω/c0)L-2πq is fitted [13]. Here, L is the best estimate of 2n0mlc, and q is an integer which retains the signal’s initial phase. Figure 1(a) shows the unwrapped phase of IINT(ω) for a point located at the center of the fluorescent bead, along with the corresponding linear fit, φlin. The residual phase, Δφ(ω), between the unwrapped phase and its linear fit is removed for each interferogram and stored for analysis using NLDS, as discussed later. This method yields a dispersion-compensated interferogram. Finally, an FFT of the corrected signal may be computed, and the location of the peak and the angle (phase) at the same point are used to determine the optical path length, n0d, with nano- to picometer sensitivity. For this particular sample, an average RI of n0 = nbead − nglycerol = 1.59−1.47 = 0.12 is used to convert the phase information to a topological map of the sample. Figure 1(b) illustrates the resulting map for a non-fluorescent and a fluorescent bead. The sensitivity of the system is 5 nm as determined by the standard deviation of a background region.
Fig. 1.
(Color online) (a) Unwrapped phase of an interferogram acquired from the center of the fluorescent bead and the line of best fit used to correct for dispersion effects. (b) Topological map of non-fluorescent (clear) and fluorescent(fluoro) beads.
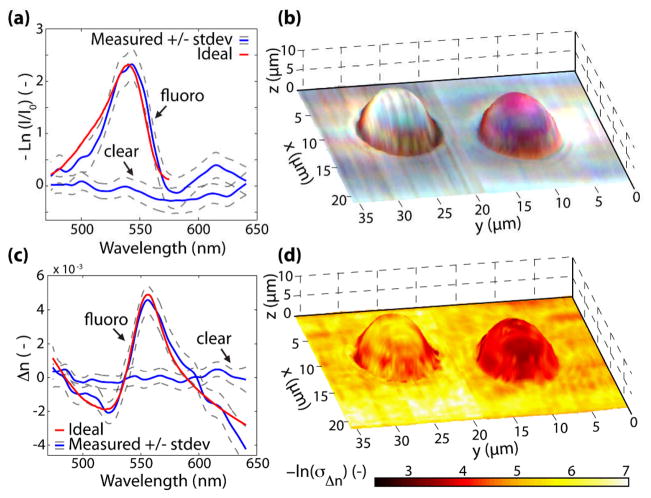
Next, the absorption spectra are analyzed. Returning to Eq. 1, the corrected interferograms only contain the first two terms (intensity and linear phase); therefore, the absorption spectrum (first term of Eq. 1 which describes the intensity) is computed by demodulating the complex signal. This involves taking the absolute value of the Hilbert transformed signal. Figure 2(a) shows two curves corresponding to the negative log of the spectrally resolved intensity (equal to μtot(ω)d) of the fluorescent and non-fluorescent beads. The ideal extinction coefficient of the fluorescent bead as provided by the manufacturer, is also plotted and shows good agreement with the experimental results, with an extinction maxima located at 540 nm. This procedure is repeated for all points in the sample; then, the normalized spectra are split into red, green, and blue channels using the Commission Internationale d’Eclairage color functions, providing a true color representation of the samples. Figure 2(b) shows the results, where the hue and saturation information is superposed on the topological map. Note that the background and clear bead are, as expected, relatively colorless, whereas the fluorescent bead is depicted with a pink hue, consistent with its appearance as seen by the naked eye or under a microscope.
Fig. 2.
(Color online) (a) Negative log of the normalized spectrum from the center of each bead. (b) True color representation of the sample superposed on the topological map. (c) Changes in the refractive index for a point at the center of each bead. (d) Negative log of the standard deviation of the changes in the real part of the RI superposed with the topological map.
Lastly, dispersive properties of these samples are investigated using NLDS. For this analysis we return to the residual phase, Δφ(ω), which contains the dispersion information from the system, background medium, and sample. Therefore, the average residual phase of a background region is used as a reference spectrum to eliminate all dispersive contributions originating outside of the sample of interest. The resulting residual phase is related to the changes in the sample’s RI by, Δφ(ω) = (ω/c0)2dΔn(ω) [9]. Figure 2(c) shows Δn for points corresponding to the middle of the clear and fluorescent beads. The ideal dispersion for the fluorescent bead, also shown in Fig. 2(c), is calculated using a subtractive Kramers-Kroning relation [14], and shows good agreement with the measured spectra. Moreover, Fig. 2(c) indicates that the amount of dispersion arising from the fluorescent bead is much greater than that of the clear bead, which is expected due to principles of causality.
The procedure for measuring dispersion using NLDS is repeated for all points on the sample. Figure 2(d) shows the results, where the negative log of the standard deviation of Δn is superposed on the topological map. Note that the fluorescent bead is depicted with a dark red hue, corresponding to higher dispersion compared to the background and clear bead, which have lower dispersion and appear in a light yellow hue. These results provide complementary information to the absorption map shown in Fig. 2(b).
The second experiment conducted for this proof of principle examines a normal, fully oxygenated RBC. A sample of whole blood was obtained from a healthy donor and processed as described in Ref. [3], where the RBCs are attached to a silvered coverglass. Images were acquired at ambient room temperature and pressure. All procedures adhered to approved Institutional Review Board protocols.
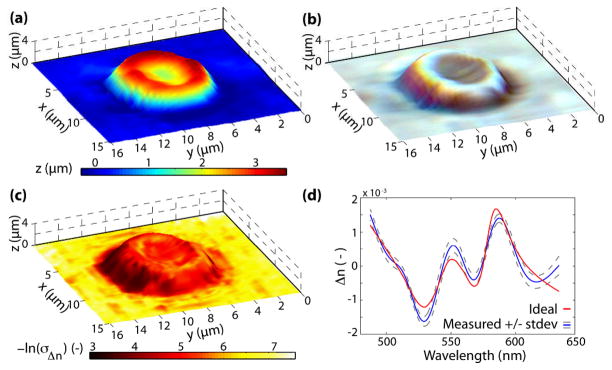
The same signal processing method described above was repeated for an isolated RBC. The topological map in Fig. 3(a), obtained from the linear phase (SDPM) analysis, illustrates the well-known round biconcave shape of a healthy RBC. Fig. 3(b) shows the true color spectroscopic map which contains the attenuation-based spectral information. Here, the RBC is depicted to be colorless, which is in fact in good agreement with the appearance of isolated RBCs under inspection with a microscope. These results indicate that the amount of absorption incurred by a single RBC is not sufficient to impart a visibly detectable spectral modulation, thus preventing accurate quantification of important biomarkers, namely hemoglobin (Hb) concentration (CHb) and oxygen saturation (SO2). These results are consistent with previous findings, where quantification of CHb and SO2 of individual RBCs have shown large variances [7,15]. On the other hand, the results using NLDS, shown in Fig. 3(c), clearly demonstrate the higher sensitivity of this novel method, providing good contrast between the RBC and the background. In fact, based on the current sensitivity of the system (~10 mrad), CHb as low as ~0.5 g/dL may be detected, which is two orders of magnitude more sensitive than attenuation-based spectral techniques [11]. Note that normal RBC CHb are around 30–36 g/dL.
Fig. 3.
(Color online) (a) Topological map of a healthy RBC. (b) True color representation superposed with the topological map. (c) Negative log of the standard deviation of the changes in the real part of the RI superposed with the topological map. (d) Representative spectral profile of the real part of the RI.
The full potential of NLDS is realized by analyzing the detailed dispersion spectra, which allows assessment of CHb. The procedure for quantifying this parameter entails using the oxygenated-Hb dispersion coefficients in a matrix inversion problem with the computed dispersion [11]. Figure 3(d) shows a typical spectra along with the ideal fit corresponding to CHb = 31.9g/dL. The average for the entire cell was CHb = 33.4 +/− 7.7 g/dL, in good agreement with expected values of healthy RBCs[2, 16].
In conclusion, we have introduced NLDS, a novel technique which achieves wide-band, high spectral resolution, dispersion profiles. We have shown that the method may be integrated with SDPM and SOCT to obtain topological maps of samples based on dispersion along with their absorptive properties, all from a single measurement. We have also demonstrated the ability to detect different dispersion-inducing molecules—specifically a synthetic fluorophore and oxy-Hb—along with the capabilities of quantification. These results have important implications for the diagnosis of various RBC diseases (e.g., sickle-cell anemia, thalassemia, and malaria), and for molecular imaging using one or more exogenous agents to monitor cell receptor expressions and various disease states. Moreover, a recent theoretical treatment [17] showed that the mean free scattering path length and isotropic coefficient can be derived from the spatial variance and variance gradient of the phase, respectively. We believe that our method may be integrated with such analysis to provide a more complete picture of the biologically relevant properties of samples, which would include their scattering, anisotropy, absorption, and dispersion properties.
Acknowledgments
We gratefully acknowledge Hillel Price for manufacturing the silvered cover glasses. This research has been supported by a grant from the National Institutes of Health (NIH) (NCI 1 R01 CA138594-01).
References
- 1.Choma M, Ellerbee A, Yang C, Creazzo T, Izatt JA. Opt Lett. 2005;30:1162. doi: 10.1364/ol.30.001162. [DOI] [PubMed] [Google Scholar]
- 2.Park Y, Yamauchi T, Choi W, Dasari R, Feld M. Opt Lett. 2009;34:3668. doi: 10.1364/OL.34.003668. [DOI] [PMC free article] [PubMed] [Google Scholar]
- 3.Shaked NT, Satterwhite LL, Telen MJ, Truskey GA, Wax A. J Biomed Opt. 2011;16:030506. doi: 10.1117/1.3556717. [DOI] [PubMed] [Google Scholar]
- 4.Morgner U, Drexler W, Kärtner F, Li X, Pitris C, Ippen E, Fujimoto J. Opt Lett. 2000;25:111. doi: 10.1364/ol.25.000111. [DOI] [PubMed] [Google Scholar]
- 5.Robles FE, Wax A. Opt Lett. 2010;35:360. doi: 10.1364/OL.35.000360. [DOI] [PMC free article] [PubMed] [Google Scholar]
- 6.Robles FE, Wax A. Opt Lett. 2010;35:2843. doi: 10.1364/OL.35.002843. [DOI] [PMC free article] [PubMed] [Google Scholar]
- 7.Yi J, Li X. Opt Lett. 2010;35:2094. doi: 10.1364/OL.35.002094. [DOI] [PubMed] [Google Scholar]
- 8.Robles FE, Wilson C, Grant G, Wax A. in review. [Google Scholar]
- 9.Yang C, Wax A, Georgakoudi I, Hanlon E, Dasari R, Feld MS. Opt Lett. 2000;25:1526. doi: 10.1364/ol.25.001526. [DOI] [PubMed] [Google Scholar]
- 10.Rappaz B, Charriere F, Depeursinge C, Magistretti PJ, Marquet P. Opt Lett. 2008;33:744. doi: 10.1364/ol.33.000744. [DOI] [PubMed] [Google Scholar]
- 11.Robles FE, Chowdhury S, Wax A. Biomed Opt Express. 2010;1:310. doi: 10.1364/boe.1.000310/. [DOI] [PMC free article] [PubMed] [Google Scholar]
- 12.Graf R, Brown W, Wax A. Opt Lett. 2008;33:1285. doi: 10.1364/ol.33.001285. [DOI] [PMC free article] [PubMed] [Google Scholar]
- 13.Zhu Y, Terry NG, Wax A. Opt Lett. 2009;34:3196. doi: 10.1364/OL.34.003196. [DOI] [PMC free article] [PubMed] [Google Scholar]
- 14.Ahrenkiel R. J Opt Soc Am. 1971;61:1651. [Google Scholar]
- 15.Faber DJ, Leeuwen TGv. Opt Lett. 2009;1 [Google Scholar]
- 16.Park Y, Diez-Silva M, Popescu G, Lykotrafitis G, Choi W, Feld MS, Suresh S. PNAS. 2008;105:13730. doi: 10.1073/pnas.0806100105. [DOI] [PMC free article] [PubMed] [Google Scholar]
- 17.Wang Z, Ding H, Popescu G. Opt Lett. 2011;36:1215. doi: 10.1364/OL.36.001215. [DOI] [PubMed] [Google Scholar]


