Abstract
Background & objectives:
Several studies have raised the suspicion that the body mass index (BMI) cut-off for overweight as defined by the WHO may not adequately reflect the actual overweight status. The present study looked at the relationship between BMI and body fat per cent (BF %) / health risks (hypertension and type 2 diabetes) in male residents of Lucknow city, north India to evaluate the validity of BMI cut-off points for overweight.
Methods:
One thousand one hundred and eleven male volunteer subjects (18-69 yr) who participated in different programmes organized by the Institute during 2005 to 2008 were included in the study. BF% was measured using commercially available digital weight scale incorporating bioelectrical impedance (BI) analyzer. The proposed cut-off for BMI based on BF % was calculated using receiver operating characteristics (ROC) curve analysis.
Results:
Forty four per cent subjects showed higher BF % (>25%) with BMI range (24-24.99 kg/m2). Sensitivity and specificity at BMI cut-off at 24.5 kg/m3 were 83.2 and 77.5, respectively. Sensitivity at BMI cut-off >25 kg/m2 was reduced by 5 per cent and specificity increased by 4.6 per cent when compared to 24.5 cut-off.
Interpretation & conclusions:
The study subjects showed higher body fat percentage and risk factors like hypertension and type 2 diabetes at normal BMI range proposed by the WHO. The cut-off for BMI was proposed to be 24.5 kg/m2 for our study population. If overweight is regarded as an excess of body fat and not as an excess of weight (increased BMI), the cut-off points for overweight based on BMI would need to be lowered. However, the confidence of estimate of the BMI cut-off in the present study may be considered with the limitations of BI analysis studies.
Keywords: BMI, body fat %, new cut-off, overweight
The disease risk stratification was commonly analyzed based on Quetelets Index (body mass index-BMI), a surrogate measure of fatness1. World Health Organization (WHO) expert committee2 recommended BMI cut-off points for determining overweight and obesity in Asian populations. Several reports from Asian populations3–6 suggested the need for population-specific cut-off points for BMI. Polynesians have a lower percentage of body fat than do white people, for the same age, sex and BMI7. No difference was observed in BMI and body fat % between white people in the Netherlands and Chinese people in Beijing8. White people in the USA generally have a lower percentage of body fat for the same BMI than do those in Europe9.
Studies in Hong Kong and Singapore10,11 showed that risk for cardiovascular disease or diabetes is high at lower BMIs. Data from China indicate that the prevalence of hypertension, diabetes, dyslipidaemia and clustering of risk factors with higher BMI even at indices at 22 kg/m2 was below the current cut-off point for overweight (25 kg/m3)12. Asian Indians have a high BMI and abdominal obesity and excess fat13,14.
These studies raised the suspicion that the BMI cut-off for overweight as defined by WHO may not adequately reflect the actual overweight status of all populations. The present study was undertaken to establish the association of BMI with body fat percentage (BF%) and health risk outcomes (specifically type 2 diabetes and hypertension) among a large number of male residents of Lucknow city, north India, using receiver operating characteristic (ROC) curve analysis. Earlier studies1,14 to determine the BMI ‘cut-off’ were conducted on small samples without analyzing the health risk outcomes for BMI classification. Hence ROC curve analysis was used in the present study to propose a new cut-off limit for BMI for overweight in north Indian males.
Material & Methods
The visitors were informed that the data will be used for research purpose and verbal consent was obtained. This study was done on 1111 male (18-69 yr) volunteers during 2005-2008. These volunteers were visitors to various awareness programmes organized by the Indian Institute of Toxicology Research, Lucknow, during this period. Children below 18 yr, people with fever, body builders/highly trained athletes, patients undergoing dialysis, patients with osteoporosis, people having weight loss problems, weight loss associated with cancer, subjects with hepatitis B or C infection, tuberculosis, haemophilia and other severe coagulation disorders and subjects using drugs (like diuretics) were excluded. Of the 2000 male individuals originally selected 1111 fulfilling the inclusion criteria were included. Clinical examination included general and physical examination of volunteers and details of clinical examination including self reported cases of type 2 diabetes and hypertension were recorded in a questionnaire. Systolic and diastolic blood pressure was recorded for all volunteers. All the type 2 diabetes cases were self reported by the subjects.
Body weight was measured to the nearest 0.1 kg in light indoor clothing without shoes, using a digital scale. Height was measured using same portable stadiometer. A correction of 0.5 kg was made for the weight of the cloths.
BF % was measured using a commercially available digital weight scale incorporating a bioelectric impedance analyzer (HBF-352, Omron Health care Co., Kyoto, Japan). The instrument is portable and easy to use in epidemiological field surveys. BF % was measured to the nearest 0.1 per cent. The digital weight scale includes a hand grip and foot plate, each of which is equipped with two electrodes. The two electrodes between the left and right grip were short-circuited, along with those for the left and right feet. Upon measurement, the study subject stood on the foot plate and gently grasped the two handgrips with arms held straight forward. During the measurement, the instrument records impedance from the hands to the feet, which corresponds to the whole body impedance, by applying an electric alternating current flux of 500 μA at an operating frequency of 50 kHz. Consequently, BF % was calculated from the impedance value and the pre entered personal data. Total body water was predicted from the impedance index (height2/impedance)15–17. From the total body water, the BF % was calculated as 100 × [weight-(total body water)]/weight17. The calculation is done by software program based on algorithm developed and patented by Omron Health Care Co., Kyoto, Japan. Impedance measured and predicted total body water, which is not displayed to user, is automatically fed to algorithm along with pre entered data and the software calculates the body fat%.
The reproducibility of the body fat measurement was assessed by repeating the measurements twice on 100 subjects on the same day. The reproducibility was satisfactory with 3.5 per cent standard error of estimate (SEE). Body fat per cent normal ranges were taken from earlier report18. Subjects were refrained from food and drink for at least 6 h and voided urine prior to the measurement session19,20. Prior information about the protocol for the body fat % test like refrained from food and drink for at least 6 h and voided urine before measurement was given to subjects 2-3 days by our volunteers before the programme. Subjects were requested to moisten the soles of the feet with a wet towel before taking a measurement. Ten minutes were given for the electrode to warm up. Validation of predicted body fat % from body mass index and from impedance in samples of five European populations showed that prediction formulae gave generally good estimates of BF % on a group level in the five population samples21 and in Indians22.
Data recorded on a predesigned proforma were entered in a Microsoft Excel spreadsheet. All the entries were double-checked for any possible keyboard error. Descriptive statistics (mean, standard deviation, median, 25th and 75th percentile) for all the anthropometric parameters were computed. Pearson's correlation coefficients were calculated for BMI with age, height, weight and body fat per cent and their significance for linearity was tested using F-test. Multiple linear regression analysis was used to investigate the possible influence of age, ethnic relationship between body fat % and BMI using SYSTAT 9.0 package (Systat 12, Systat Software, Inc., Chicago IL). Statistical significance for prevalence of cardiovascular disease risk (hypertension) and type 2 diabetes related to different BMI categories was ascertained by Chi square test for trend in proportions using EPI INFO 5.0 software (Epi Info Version 3.5.1, Centre for Disease Control and Prevention, Georgia). ROC curves were drawn to determine an appropriate cut-off of the BMI, considering body fat per cent as standard.
Results
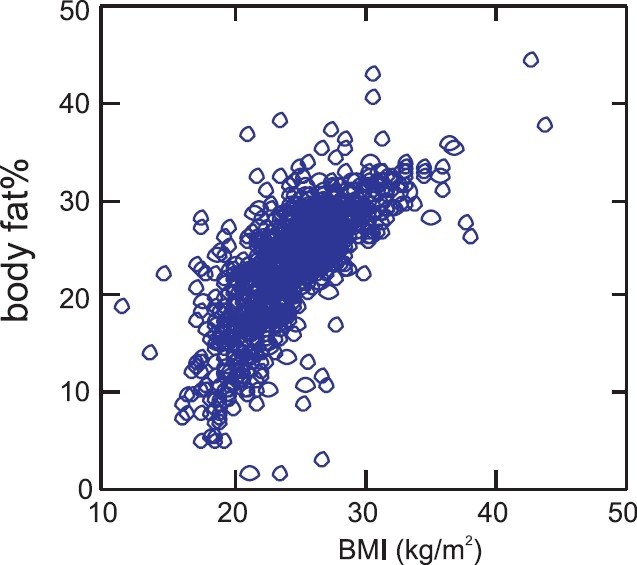
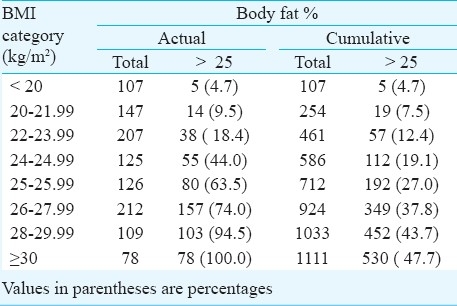
The age of subjects ranged between 18 - 69 yr with a mean of 38.2 yr. All the variables studied follow normal distribution (Table I). BMI increased significantly (r=0.24, P<0.001) with age. BMI was found to be highly correlated with body fat percentage (r=0.73, P<0.001) indicating statistical linear relationship between body fat percentage and BMI (Fig. 1). Forty four per cent subjects showed higher body fat % (> 25%) with BMI range between 24 - 24.9 kg/m2. Even at lower BMI (<20), the high body fat per cent was found to be 4.7 per cent subjects (Table II). High body fat per cent in the BMI range of 20 to 21.9 and 22 - 23.9 kg/m2 was found to be 9.5 and 18.4 per cent, respectively showing large number of subjects having body fat more than 25 per cent in lower BMI range.
Table I.
Physical characteristics, BMI and body fat % among study subjects

Fig. 1.

Scatter plot between BMI and body fat per cent.
Table II.
Body fat per cent in different categories of BMI in study subjects

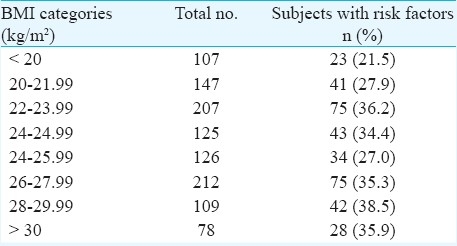
Presence of at least one risk factor of having type 2 diabetes or hypertension in different BMI categories are shown in Table III.
Table III.
Prevalence of risk factors of hypertension or type 2 diabetes among study subjects in different BMI categories

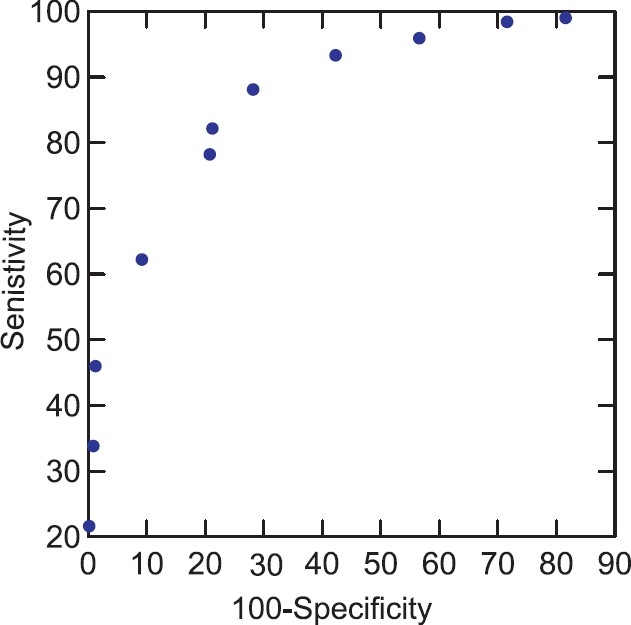
Curve was plotted based on ROC analysis at different cut-off values of BMI while taking percentage of body fat as standard (Table IV, Fig. 2). Area under the curve was between 85 to 88 per cent which is considered good fit in discriminating the population with body fat below and above 25 per cent. Sensitivity and specificity at cut-off level of BMI at 24.5 was 83.2 and 77.5, respectively. Sensitivity at BMI cut-off > 25 kg/m2 was reduced by 5 per cent and specificity increased by 4.6 per cent compared to 24.5 kg/m2. There was a minimum misclassification rate of 19.8 per cent at BMI cut-off 24.5 kg/m2 compared to 21.3 per cent at >25 kg/m2.
Table IV.
Test characteristics (%) of BMI as a measure of overweight in study subjects considering body fat percentage as standard (BFAT % >25)

Fig. 2.

Receiver operating characteristic curve (ROC) at different BMI cut-off points using body fat as standard.
There were 23 cases with BMI < 18 kg/m2 even though they were healthy as per our inclusion / exclusion criteria. There was one individual with 1.5 per cent body fat, two cases with body fat % between 4-5 per cent and seven between 5-7 per cent.
Discussion
In the present study, higher body fat % was observed within WHO proposed normal limits of BMI. Hence a proposal to lower the WHO normal BMI standard from 24.9 to 24.5 kg/m2 was suggested for the male residents of the study location. Earlier study also showed that the diagnosis of obesity (using reference of BMI of 30 kg/m2) need to be lowered to 27 kg/m2 for Malys, Chinese and 26 kg/m2 for Asian Indians23. World Health Organisation and International Obesity Task Force have also suggested lowering the limits of BMI for the diagnosis of overweight and obesity to 23 and 25 kg/m2, respectively11,23. Another study24 undertaken to know the relationship between BMI and BF % among Japanese and Australian Caucasian living in Australia showed that Japanese men had greater body fat deposition than Australian - Caucasians at the same BMI value. Japanese men may, therefore, require lower BMI cut-off points to identify obese individuals compared with Australian-Caucasian men.
ROC curve analysis1 proposes BMI of 23.85 kg/m2 as the cut-off for overweight with a sensitivity of 70.2 per cent (95% CI 56.6 - 81.6) and 87.5 per cent specificity (95% CI 76.8-94.4) and a BMI of 24.38 kg/m2 with 90 per cent sensitivity (95% CI; 68.3-98.5) and 81.2 per cent specificity (95% CI; 72.2-88.3) for obesity. Earlier studies23,25 have shown poor sensitivity and specificity of BMI for diagnosis of obesity in the Asian ethnic groups using ROC curve analysis.
In the present study, within normal limits of BMI, higher body fat % and presence of risk factor(s) (type 2 diabetes/hypertension) were observed. The 1993 WHO Expert Committee26 reported that weight gain in adult life was associated with increased morbidity and mortality at higher BMI range. Therefore, BMI cut-off for overweight should be interpreted based on risk factors of morbidity and mortality. Type 2 diabetes mellitus, cardiovascular disease and increased mortality are the most important sequelae of obesity and abdominal fatness, but other associations like musculoskeletal disorders, limitations of respiratory function and reduced physical functioning and quality of life were also observed27. Three specific factors led WHO to convene another expert consultation on BMI classifications. First, there was increasing evidence of the emerging high prevalence of type 2 diabetes and increased cardiovascular risk factors in parts of Asia at BMI below the cut-off point of 25 kg/m2 that defines overweight in the current WHO classification. Second, there was increasing evidence that the association between BMI, percentage of body fat, and body fat distribution differ across population. Third, there had been two previous attempts to interpret the WHO BMI cut-offs in Asian and Pacific population which contributed to the growing debate on whether there is a need for developing different BMI cut-off points for different ethnic groups28. The existing assumptions and definitions of cut-offs of each parameter are based on the data from Caucasian populations26,29. Asian Indians have a characteristic obesity phenotype, consisting of relatively lower BMI, excess body fat %, abdominal and truncal adiposity and less lean tissue13,14.
WHO Expert Consultation proposed a new BMI cut-off of 23.0 kg/m2 for public health action in Asia23. The use of this cut-off, however, was not directly supported by data on mortality6,30, since deaths from any cause were lowest among men with BMI of 24.0 to 24.9 and women with a BMI of 25.0 to 26.9 kg/m2 in a representative group of Chinese subjects5,31.
Clinical use of bioelectrical impedance analysis (BIA) in subjects at extremes of BMI ranges or with abnormal hydration cannot be recommended for routine assessment of patients until further validation studies prove for BIA algorithms to be accurate in such conditions. Multi frequency and segmental BIA may have more advantage in these conditions32 over single frequency BIA included in the present study. Since hydration studies were not undertaken in our subjects, we were not able to clinically prove whether our subjects possess abnormal hydration, even though we assured that no subject was taking diuretic drugs.
In our study we followed the earlier reports for cut-off points for BF% (25 %)14. In Asian Indians, abdominal fat increased with increasing age, while the percentage of BF showed little change. In the other ethnic groups, both abdominal and total BF increased with age33. Ethnic differences in fat distribution, muscularity, bone mass and leg length may contribute to ethnic-specific relationships between body fatness and BMI. Thus the use of universal BMI cut-off points may not be appropriate for the comparison of obesity prevalence between ethnic groups34. Since the body fat % cut-off is a debatable issue, further studies to validate the cut- off for Indian population are required. The relationship between waist circumference and body fat % was not considered in the study and it might be considered as a limitation of the study.
In BI studies35, applied current flows throughout all conducting tissue within the body and does not uniquely reflect the properties of any single tissue, compartment, or region. Another drawback of BIA measurements is its statistical association linked with output variables such as body fat % without display of biophysical parameters. BIA values are affected by numerous variables including body position, hydration status, consumption of food and beverages, ambient air and skin temperature, recent physical activity, and conductance of the examining table. Reliable BIA requires standardization and control of these variables. Standard equations of body fat % from the BI method are based on population-specific equations and hence the standard errors of the estimate for the individual are not known42. Confidence of estimate of the BMI cut-off in the present study may be considered with the above limitations of BIA studies.
Acknowledgments
Authors thank Dr A.K. Srivastava, Scientist F, Epidemiology Division, IITR, Lucknow, for his guidance and support.
References
- 1.Singh SP, Sikri G, Garg MK. Body mass index and obesity: Tailoring “cut off” for an Asian Indian population. Med J Armed Force India. 2008;64:350–3. doi: 10.1016/S0377-1237(08)80019-6. [DOI] [PMC free article] [PubMed] [Google Scholar]
- 2.WHO Expert Consultation. Appropriate body mass index for Asian populations and its implications for policy and intervention strategies. Lancet. 2004;363:157–63. doi: 10.1016/S0140-6736(03)15268-3. [DOI] [PubMed] [Google Scholar]
- 3.He M, Tan KCB, Li ETS, Kung AWC. Body fat determination by dual energy X ray absorptiometry and its relation to body mass index and waist circumference in Hong kong Chinese. Int J Obes. 2001;25:748–52. doi: 10.1038/sj.ijo.0801612. [DOI] [PubMed] [Google Scholar]
- 4.Guricci S, Hartriyanti Y, Hautvast JGAJ, Duerenberg P. Relationship between body fat and body mass index: differences between Indonesians and dutch Caucasians. Eur J Clin Nutr. 1998;52:779–83. doi: 10.1038/sj.ejcn.1600637. [DOI] [PubMed] [Google Scholar]
- 5.Gu D, He J, Duan X. Body weight and mortality among men and women in China. JAMA. 2006;295:776–83. doi: 10.1001/jama.295.7.776. [DOI] [PubMed] [Google Scholar]
- 6.Stevans J. Ethnic specific revisions of body mass index cutoffs to define overweight and obesity in Asians are not warranted. Int J Relat Metab Disorder. 2003;27:1297–9. doi: 10.1038/sj.ijo.0802417. [DOI] [PubMed] [Google Scholar]
- 7.Swinburn BA, Ley SJ, Carmichael HE, Plank LD. Body size and composition in Polynesians. Int J Obes. 1999;23:1178–83. doi: 10.1038/sj.ijo.0801053. [DOI] [PubMed] [Google Scholar]
- 8.Durenberg P, Ge K, Haurvast JGAG, Wang J. Body mass index as predictor for body fat: Comparison between Chinese and Dutch adult subjects. Asia Pacfic J Clin Nutr. 1997;6:102–5. [PubMed] [Google Scholar]
- 9.Durenberg P, Yap M, Stavern van WA. Body mass index and percent body fat. A meta analysis among different ethnic groups. Int J Obesity. 1998;22:1164–71. doi: 10.1038/sj.ijo.0800741. [DOI] [PubMed] [Google Scholar]
- 10.Villareal DT, Apovian CM, Kushner RF, Klein S. Obesity in older adults: technical review and position statement of the American Society for Nutrition and NAASO, The obesity Society. Am J Clin Nutr. 2005;82:923–34. doi: 10.1093/ajcn/82.5.923. [DOI] [PubMed] [Google Scholar]
- 11.Asia Pacific perspective: Redefining obesity and its treatment. Australia: Health Communications Australia; 2000. World Health Organization Western Pacific Region, International Association for the Study of Obesity, International Obesity Task Force. [Google Scholar]
- 12.Ko GTC, Chan JCN, Cockram CS, Woo J. Prediction of hypertension, diabetes, dyslipidemia or albuminuria using simple anthropometric indexes in Hong Kong Chinese. Int J Obesity. 1999;23:1136–42. doi: 10.1038/sj.ijo.0801043. [DOI] [PubMed] [Google Scholar]
- 13.Banerji MA, Faridi N, Atluri R, Chaiken RL, Lebovitz HE. Body composition, visceral fat, leptin and insulin resistance in Asian Indian men. J Clin Endocrin Metab. 1999;84:137–44. doi: 10.1210/jcem.84.1.5371. [DOI] [PubMed] [Google Scholar]
- 14.Dudeja V, Mishra A, Pandey RM, Devina G, Kumar G, Vikram NK. BMI does not accurately predict overweight in Asian Indians in northern India. Br J Nutr. 2001;86:105–12. doi: 10.1079/bjn2001382. [DOI] [PubMed] [Google Scholar]
- 15.Kushner RF, Kunigk A, Alspaugh M, Andronis PT, Leitch CA, Schoeller DA. Validation of bioelectrical-impedance analysis as a measurement of change in body composition in obesity. Am J Clin Nutr. 1990;52:219–23. doi: 10.1093/ajcn/52.2.219. [DOI] [PubMed] [Google Scholar]
- 16.Deurenberg P, Tagliabue A, Schouten FJM. Multi-frequency impedance for the prediction of extracellular water and total body water. Br J Nutr. 1995;73:349–58. doi: 10.1079/bjn19950038. [DOI] [PubMed] [Google Scholar]
- 17.Stall SH, Ginsberg NS, DeVita MV, Zabetakis PM, Lynn RI, Gleim GW, et al. Comparison of five body-composition methods in peritoneal dialysis patients. Am J Clin Nutr. 1996;64:125–30. doi: 10.1093/ajcn/64.2.125. [DOI] [PubMed] [Google Scholar]
- 18.Gallagher D, Heymsfield SB, Heo M, Jebb SA, Murgatroyd PR, Sakamoto Y. Health percentage body fat ranges; an approach for developing guidelines based on Body Mass Index. Am J Clin Nutr. 2000;72:694–701. doi: 10.1093/ajcn/72.3.694. [DOI] [PubMed] [Google Scholar]
- 19.Durnin JVGA, Womersley J. Body fat assessed from total body density and its estimation from skinfold thickness: measurements on 481 men and women aged from 17 to 72 years. Br J Nutr. 1974;32:77–9. doi: 10.1079/bjn19740060. [DOI] [PubMed] [Google Scholar]
- 20.Vasudev S, Mohan A, Mohan D, Farooq S, Deepa R, Mohan V. Validation of body fat measurement by skinfolds and two Bioelectric Impedance Methods with DEXA - The Chennai Urban Rural Epidemiology Study [CURES-3] J Assoc Physician India. 2004;52:877–81. [PubMed] [Google Scholar]
- 21.Sun S, Chumelea WC, Heymsfield SB, Lukaski HC, Schoeller D, Friedl K, et al. Development of bioelectric impedance analysis prediction equations for body composition with the use of a multi component model for use in epidemiological surveys. Am J Clin Nutr. 2003;77:331–40. doi: 10.1093/ajcn/77.2.331. [DOI] [PubMed] [Google Scholar]
- 22.Durenberg-yab M, Schmidt G, van Staveren WA, Deurenberg P. The paradox of low body mass index and high body fat percentage among Chinese, Malays and Indians in Singapore. Int J Obes. 2000;24:1011–7. doi: 10.1038/sj.ijo.0801353. [DOI] [PubMed] [Google Scholar]
- 23.Obesity, preventing and managing the global epidemic. Geneva: WHO; 1998. World Health Organization. Report of a WHO consultation on obesity. WHO/NUT/NCD/:981. [PubMed] [Google Scholar]
- 24.Kagawa M, Kerr D, Uchida H, Binns CW. Differences in the relationship between BMI and percentage body fat between Japanese and Australian Caucasian young men. Br J Nutr. 2006;95:1002–7. doi: 10.1079/bjn20061745. [DOI] [PubMed] [Google Scholar]
- 25.Deurenberg-Yap M, Yian TB, Kai CS, Deurenberg P, van Stavern WA. Manifestations of cardiovascular risk factors at low levels of body mass index and waist to hip ratio in Singaporean Chinese. Asia Pacfic J Clin Nutr. 1999;8:177–83. doi: 10.1046/j.1440-6047.1999.00091.x. [DOI] [PubMed] [Google Scholar]
- 26.Physical status: the use and interpretation of anthropometry, Report of a WHO expert committee. Geneva: WHO; 1995. World Health Organization. WHO Technical Report Series No.854. [PubMed] [Google Scholar]
- 27.Smalley KJ, Knerr AN, Kendrick ZV, Colliver JA, Owen OE. Reassessment of body mass indices. Am J Clin Nutr. 1990;52:405–8. doi: 10.1093/ajcn/52.3.405. [DOI] [PubMed] [Google Scholar]
- 28.Seidell JC, Kahn HS, Williamson DF, Lissner L, Valdez R. Report from a Centers for Disease Control and Prevention Workshop on use of adult anthropometry for public health and primary health care. Am J Clin Nutr. 2001;73:123–6. doi: 10.1093/ajcn/73.1.123. [DOI] [PubMed] [Google Scholar]
- 29.James WPT, Chen C, Inouse S. Appropriate asian body mass indices? Obes Res. 2002;3:139. doi: 10.1046/j.1467-789x.2002.00063.x. [DOI] [PubMed] [Google Scholar]
- 30.Stevans J. BMI cutoffs for obesity should not vary by ethnic group. In: Madeiros-Neto G, Halpern A, Bouchard C, editors. Progress in obesity research. Monograph 9, Montrouge, France: John Libbey Euro text; 2003. pp. 554–7. [Google Scholar]
- 31.He J, Gu D, Wu X. Major causes of death among men and women in China. N Engl J Med. 2005;353:1124–34. doi: 10.1056/NEJMsa050467. [DOI] [PubMed] [Google Scholar]
- 32.Kyle UG, Bosaeus I, De Lorenzo AD, Deurenberg P, Elia M, Manuel GJ, et al. ESPEN. ESPEN Guidelines, Bioelectrical impedance analysis - part II: utilization in clinical practice. Clin Nutr. 2004;23:1430–53. doi: 10.1016/j.clnu.2004.09.012. [DOI] [PubMed] [Google Scholar]
- 33.Rush EC, Freitas I, Plank LD. Body size, body composition and fat distribution: Comparative analysis of European, Maori, Pacific island and Asian Indian adults. Br J Nutr. 2009;102:632–41. doi: 10.1017/S0007114508207221. [DOI] [PubMed] [Google Scholar]
- 34.Rush EC, Chandu V, Plank LD. Prediction of fat free mass by bioimpedance analysis in migrant Asian Indian men and women: a cross validation study. Int J Obes (Lond) 2006;30:1125–31. doi: 10.1038/sj.ijo.0803230. [DOI] [PubMed] [Google Scholar]
- 35.Bioelectric impedance analysis in body composition measurement. Bethesda: NIH Information Centre; 1994. National Institutes of Health Technology Assessment Conference Statement. [Google Scholar]


