

Background: Cytochrome P450 3A4 (CYP3A4) can bind several substrate molecules simultaneously and exhibits cooperativity.
Results: Ligand binding in the active site is preceded by functionally important interactions at a distinct peripheral site.
Conclusion: The mechanism of cooperativity involves a ligand-induced allosteric transition.
Significance: Allosteric mechanism suggested by our results transforms the view of the grounds and significance of CYP3A4 cooperativity.
Keywords: Allosteric Regulation, Cooperativity, Cytochrome P450, Enzyme Mechanisms, Fluorescence Resonance Energy Transfer (FRET), Cytochrome P450 3A4, Ligand-binding Site
Abstract
The mechanisms of ligand binding and allostery in the major human drug-metabolizing enzyme cytochrome P450 3A4 (CYP3A4) were explored with fluorescence resonance energy transfer (FRET) using a laser dye, fluorol-7GA (F7GA), as a model substrate. Incorporation into the enzyme of a thiol-reactive FRET probe, pyrene iodoacetamide, allowed us to monitor the binding by FRET from the pyrene donor to the F7GA acceptor. Cooperativity of the interactions detected by FRET indicates that the enzyme possesses at least two F7GA-binding sites that have different FRET efficiencies and are therefore widely separated. To probe spatial localization of these sites, we studied FRET in a series of mutants bearing pyrene iodoacetamide at different positions, and we measured the distances from each of the sites to the donor. Our results demonstrate the presence of a high affinity binding site at the enzyme periphery. Analysis of the set of measured distances complemented with molecular modeling and docking allowed us to pinpoint the most probable peripheral site. It is located in the vicinity of residues 217–220, similar to the position of the progesterone molecule bound at the distal surface of the CYP3A4 in a prior x-ray crystal structure. Peripheral binding of F7GA causes a substantial spin shift and serves as a prerequisite for the binding in the active site. This is the first indication of functionally important ligand binding outside of the active site in cytochromes P450. The findings strongly suggest that the mechanisms of CYP3A4 cooperativity involve a conformational transition triggered by an allosteric ligand.
Introduction
The major human drug-metabolizing enzyme, cytochrome P450 3A4 (CYP3A4), represents the most prominent example of homo- and heterotropic cooperativity among cytochromes P450 (for review see Refs. 1–3). It is now well established that one molecule of CYP3A4 is capable of binding two or more molecules of those substrates that exhibit homotropic cooperativity with the enzyme (4–10). The initial hypothesis to explain the mechanism of P450 cooperativity was therefore based on an assumption of a loose fit of smaller substrates in a large substrate-binding pocket of the enzyme. It was suggested that efficient catalysis requires the binding of several substrate molecules in one pocket to yield a productive orientation of one of them (11, 12). However, this model is insufficient to explain all complex instances of cooperativity in CYP3A4 (for review see Refs. 1, 2). According to the current interpretation, the cooperativity in CYP3A4 reflects a true allosteric mechanism. The binding of the first substrate molecule is thought to trigger a structural transition that facilitates the subsequent binding event(s), resulting in a catalytically competent enzyme-substrate complex (13–16).
The substrate-induced displacement of the spin equilibrium of the heme iron (type I binding) is usually attributed to the formation of the final productive complex of CYP3A4 with several substrate molecules (5, 7–9, 14, 15, 17). However, our recent study (18) of the interactions of 1-pyrenebutanol (1-PB)2 with CYP3A4 and selected mutants that demonstrate altered cooperativity of steroid hydroxylation (12, 19, 20) showed that this simple relationship is severely compromised in F213W and F304W mutants. Although these mutants were shown to retain the multisite mechanism of interactions with 1-PB, they exhibit no cooperativity of the 1-PB-induced spin shift. Alteration of cooperativity was shown to result from a displacement of the “spin-shifting” step. Whereas in the wild type the spin shift occurs in the ternary complex only, the mutants exhibit some spin shift upon binding of the first substrate molecule. Therefore, the substrate-induced spin shift in P450 may not result from mere physical displacement of the water ligand of the heme iron by the substrate molecule, as usually thought. Rather, in the case of CYP3A4 and 1-PB, the changes in the position of spin equilibrium result from a substrate-induced change in enzyme conformation that attenuates the hydration and water accessibility of the heme pocket.
This indirect interconnection between substrate binding and the spin state reawakens an earlier hypothesis on the possible role of peripheral substrate binding in P450 enzymes (4, 14, 15, 21, 22). It is noteworthy in this regard that the phenylalanine residues 213 and 304, replacement of which with tryptophan results in attenuated cooperativity (12, 19, 20), participate in the formation of a so-called “phenylalanine cluster” that represents a prominent feature of CYP3A4 (23). The structure of this cluster, which participates in the peripheral binding of progesterone at the distal surface of CYP3A4 (23), is affected substantially by enzyme-substrate interactions in the complex of CYP3A4 with ketoconazole (24). The role of the peripheral substrate binding at the phenylalanine cluster in the mechanisms of CYP3A4 allostery was hypothesized by Williams et al. (23) and advocated by Roberts and Atkins (22). However, direct evidence has been limited.
Further progress in understanding the mechanisms of CYP3A4 allostery and the role and location of peripheral binding site(s) requires development of advanced biophysical techniques. In this study we introduce FRET from the covalently attached donor fluorophore pyrene iodoacetamide (PIA) to the fluorescent ligand fluorol-7GA (F7GA) (25) to dissect the mechanisms of multisite binding in CYP3A4. To achieve site-specific incorporation of the pyrene fluorophore, we used a series of cysteine-depleted CYP3A4 mutants each bearing only a single modifiable cysteine residue. We demonstrate that the first high affinity substrate binding event takes place outside of the active site. Analysis of the distances from the FRET donor positions to the F7GA-binding sites pinpoints the region of the phenylalanine cluster as the most plausible location of the functionally important peripheral substrate-binding site.
EXPERIMENTAL PROCEDURES
Materials
Fluorol-7GA (fluorol-555, 2-butyl-6-(butylamino)-1H-benzo[de]isoquinoline-1,3(2H)-dione) was obtained from Exciton (Dayton, OH), and pyrene iodoacetamide (PIA) was from Invitrogen. Igepal CO-630, 2-hydroxypropyl-β-cyclodextrin, tris(2-carboxyethyl)phosphine, coumarin-47 (7-diethylamino-4-methylcoumarin), 3-sn-phosphatidic acid sodium salt from egg yolk, 3-sn-phosphatidylethanolamine from bovine brain, and l-α-phosphatidylcholine from egg yolk were the products of Sigma. All other chemicals were of the highest grade available from commercial sources and were used without further purification.
Construction of Cysteine-depleted Mutants of CYP3A4
The single and double cysteine mutants used in this study3 were based on the cysteine-depleted CYP3A4 construct described earlier (26). In this construct six native cysteines were eliminated through C58T, C64A, C98S, C239S, C377S, and C468A. The single and double cysteine mutants bearing combinations of the above substitutions are termed hereafter as C58, C64, C64/C58, C377/C58, and C468 mutants, in conformity with the positions of the retained cysteine residues. In addition to site-directed modification of the native cysteine residues, we also made a single cysteine mutant termed C495, in which all native cysteines (excluding Cys442) were eliminated as above.
Expression and Purification of CYP3A4 and Its Mutants
The enzymes were expressed as the His-tagged proteins in Escherichia coli TOPP3 (12). The proteins were purified with a three-column procedure, which includes ion-exchange chromatography on Macro-Prep CM support as described previously (27).
Modification of the Cysteine-depleted Mutants of CYP3A4 with PIA
Modification was performed in 0.1 m HEPES buffer, pH 7.4, containing 1 mm EDTA, 20% glycerol, and 0.2% Igepal CO-630. A 2–3 mm stock solution of PIA in 1:1 (v/v) acetone/ethanol was added to a 20 μm solution of the protein to attain the final concentration of 30 μm label. After a 60-min incubation of the mixture with continuous stirring at 25 °C, the reaction was stopped with the addition of 1 mm dithiothreitol (DTT). Unreacted label and the detergent were removed by extensive washing with 0.1 m Na-HEPES buffer, pH 7.4, 20% glycerol, 3 mm tris(2-carboxyethyl)phosphine on a small nickel-nitrilotriacetic acid-Sepharose column (1 ml of resin per 100 nmol of protein). The modified protein was eluted from the column with 0.15 m histidine-HCl in the same buffer and passed through a column of Bio-Gel P6 (Bio-Rad) equilibrated with the same buffer containing no histidine. The extent of labeling was determined from the absorbance spectrum of the protein using the extinction coefficient of 0.026 μm−1 cm−1 for the absorbance of PIA at 339 nm (28).
Preparation of CYP-3A4-containing Proteoliposomes
Proteoliposomes were prepared by incorporation of CYP3A4 into liposomes obtained with the octyl glucoside/dialysis technique from a 2:1:0.6 mixture of phosphatidylcholine, phosphatidylethanolamine, and phosphatidic acid as described previously (27). In brief, we used a vortex mixer to prepare a suspension of 10 mg of phospholipids in 2.5 ml of 100 mm Na-HEPES, 150 mm KCl, 0.5 mm EDTA, containing 10% (v/v) glycerol, pH 7.4 (Buffer A), containing 1.54% octyl glucoside. The mixture was incubated for 30 min at room temperature under argon and diluted with Buffer A to the final concentration of octyl glucoside of 0.43%. Liposomes were formed upon dialysis of the above mixture for 72 h at 4 °C under constant gentle bubbling of argon gas against three changes of 500 ml of Buffer A, each containing 0.5 g of Bio-Beads® SM-2 hydrophobic adsorbent (Bio-Rad). The suspension was then concentrated on 300-kDa cutoff Diaflo membranes (Millipore, Billerica, MA) to a phospholipid concentration of 8–10 mm and stored at −80 °C under argon. To incorporate cytochrome P450 into pre-formed liposomes, a solution of purified CYP3A4 (100–150 μm) was added to an 8 mm suspension of the liposomes in Buffer A containing 1 mm DTT. The mixture was incubated under an argon atmosphere with continuous stirring for 1 h at room temperature followed by an overnight incubation at 4 °C. Separation of unincorporated CYP3A4 was performed by gel filtration on a 1.2 × 40-cm column of Toyopearl HW-75 resin (Tosoh Bioscience GmbH, Stuttgart, Germany). A more detailed description of this technique may be found in our earlier publication (27).
Experimental Setup
All titration experiments were carried out at 25 °C with continuous stirring in 0.1 m Na-HEPES buffer, pH 7.4, containing 0.6 mg/ml 2-hydroxypropyl-β-cyclodextrin, 1 mm EDTA, and 1 mm dithiothreitol. 2-Hydroxypropyl-β-cyclodextrin was included in the media to prevent changes in the fluorescence properties of F7GA due to its aggregation at high concentrations in aqueous solution (25). The F7GA concentration was determined from the absorbance at 440 nm using an extinction coefficient of 14.1 mm−1 cm−1 (29). All “titration-by-dilution” and reverse titration experiments were carried out in a 2 × 10-mm ultra-micro fluorescence cell (Hellma GmbH & Co. KG, Müllheim, Germany, product number 105.250). In our regular titrations, we used a 10-mm light path quartz semi-micro cell with a stirring compartment (Hellma, product number 109.004F).
Absorbance Measurements
Absorbance spectra were recorded with an S2000 rapid scanning CCD spectrometer (Ocean Optics, Inc., Dunedin, FL) as described previously (5).
Steady-state Fluorescence Measurements
These studies were performed with a combination of either an Edinburgh Instruments FLS920 (Edinburgh Instruments, Edinburgh, Scotland, UK) or a computerized Hitachi F-2000 spectrofluorometer (Hitachi, Ltd., Tokyo, Japan) with an S2000 fiber optic CCD spectrometer (Ocean Optics, Dunedin, FL) as described previously (5). The CCD spectrometer was used to monitor the changes in the transmittance and thus permit an instant correction of fluorescence intensity to compensate for the internal filter effect in reverse titration and dilution experiments. For this purpose, all emission spectra were normalized to the transmittance of a 1-mm slice of the sample (assuming that the source of fluorescence is located in the center of a 2-mm-wide cell) calculated from a measured transmittance spectra. In the studies of FRET from F7GA to the heme, the excitation wavelength was set to 405 nm with a bandwidth of 10 nm. The studies of FRET from PIA to F7GA were performed with excitation at 348 nm and a band with of 10 nm.
Time-resolved Fluorescence Measurements
Studies were performed with an FLS920 fluorometer from Edinburgh Instruments as described previously (25). In the case of titration-by-dilution experiments, the amplitude of the decay traces was corrected for the internal filter effect as described above.
The treatment of the decay traces was performed with a technique based on principal component analysis (25). This approach results in a global fit of a series of traces to bi-exponential equations with a common optimized set of decay times, and the amplitudes of the exponential terms vary to reflect the changes in the intensity of fluorescence and the average lifetime of the ligand. The concentration of the enzyme-substrate complex was assessed from the fraction of the fast decay term. The same set of decay traces was used to plot the dependence of the fluorescence intensity (overall amplitude of the decay traces normalized to the F7GA concentration) versus the concentration of the enzyme/substrate mixture.
Fluorescence Dilution Experiments
A 100-μl aliquot of enzyme/substrate mixture of desired stoichiometry was placed in a fluorescence quartz micro cell with 2 × 10-mm optical chamber (Hellma GmbH, product number 105.250). Small aliquots of buffer were added to the cell up to the maximal volume of the cell (2000 μl). The spectra or fluorescence decay traces were recorded after each addition.
FRET Titration Experiments
The titrations of the PIA-labeled proteins with F7GA were carried out in a 100-μl fluorescence micro cell (see above). The excitation wavelength was set to 348 nm, which corresponds to the general minimum in the F7GA excitation and is close to the maximum of PIA excitation. The efficiency of FRET was judged from the decrease in the fluorescence of the pyrene fluorophore.
Data Processing
Absorbance spectra obtained in titration experiments were analyzed by principal component analysis combined with the least square approximation of the principal vectors with a combination of the prototypical spectra of the CYP3A4 low spin, high spin, and type II substrate-bound ferric low spin CYP3A4 P450 states as described previously (5, 30–32). All data treatment procedures and curve fitting were performed using a 32-bit version of our SPECTRALAB software (31) running under Windows XPTM.
The fitting of the titration curves to an appropriate equation was done with a combination of Marquardt and Nelder-Mead nonlinear least square algorithms as described previously (31). When the interpretation of the results did not require an assumption of multiple binding events (FRET dilution and reverse titration experiments), we used Equation 1 for the equilibrium of bimolecular association (see Ref. 33, page 73, Equation II-53),
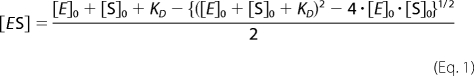 |
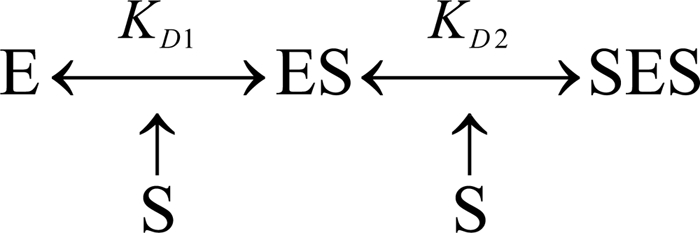
In the approximation of the results of the titration experiments we used a two-step sequential model of binding as shown in Scheme 1. The calculations were made using the system of equations describing the behavior of this model at comparable concentrations of E and S, as described earlier (5, 18, 30). This system of nonlinear equations (supplemental Equation S1) along with an outline of the approach used to find its roots may be found in the supplemental material.
SCHEME 1.
Tools Used for Molecular Modeling, Ligand Docking, and Structure Analysis
The structural model of CYP3A4 bearing PIA labels at positions 64, 377, 468, and 495 was built on the basis of the x-ray structure of CYP3A4 complex with progesterone (PDB code 1W0E) with the use of the TINKER molecular modeling package (34) version 5.1. Conversion of PDB files into the TINKER-compatible XYZ format and vice versa as well as the assignment of the atom and bond types necessary for the use of the MM3 force field were performed with the OpenBabel chemical toolbox (35). The residue Ser495 in the 1W0F structure was replaced with Cys as in our C495 mutant. The structures of peptide fragments 55–69, 458–503, and 376–382 bearing the PIA labels covalently attached to Cys64, Cys377, Cys468, and Cys495 were optimized with the use of the NEWTON procedure and the MM3 force field (36), as supplied in TINKER package. The resulting optimized structures of the labeled fragments were then re-inserted into the original structure (PDB code 1W0E).
Search for regions of structure of PIA-modified CYP3A4 that comply with the distance restraints imposed by the set of donor-acceptor distances determined with FRET was done with a custom program written in DelphiTM version 7 (Borland Software Corp., Austin, TX). Molecular docking of F7GA in the proximity of the found sets of residues was performed with Autodock Vina (37). The initial docking was performed within the 20 × 20 × 20-Å boxes built around the geometrical centers of the found sets of residues. The size of the box was then optimized by increasing the dimensions in 1-Å increments in those cases when the optimized positions of the ligand approached within 2 Å of the walls of the box. Similarly, the dimensions were decreased in 1-Å increments if the distances of all of the found positions of the ligand from the walls of the block were larger than 4 Å. The final dimensions of the boxes were 24 × 20 × 10 Å, 24 × 20 × 15 Å, and 23 × 23 × 8 Å for the sets R1-1, R1-2, and R2, respectively. Other manipulations of the molecular models and preparation of the molecular graphics for this publication were done with the use of the UCSF Chimera software (50).
The calculations of the donor-acceptor distances according to the Förster equation (see Equation 13.2 in Ref. 38) were performed with the use of PhotoChemCad software (39). In these calculations, we set the values of the orientation factor (κ2) and the refractive index (n) to 0.667 and 1.4, respectively.
RESULTS AND DISCUSSION
Fluorol-7GA as a Model Fluorescent Substrate of CYP3A4
In our search for an appropriate high affinity fluorescent ligand for FRET-based studies of CYP3A4 cooperativity, we identified the laser dye F7GA as an allosteric ligand and potential substrate of CYP3A4. The high intensity of fluorescence and beneficial spectral properties of this dye (Fig. 1) permit its use in a variety of FRET-based techniques. The considerable overlap of the emission band of F7GA with the P450 heme absorbance allows detection of enzyme-substrate interactions by FRET from F7GA to the heme chromophore. Furthermore, F7GA has a perfect resolution of its excitation bands from those of pyrene, a potential FRET donor (Fig. 1). The pyrene/fluorol donor-acceptor pair with its Förster radius of 30–35 Å provides an excellent means for probing the location of multiple binding sites in the enzyme molecule.
FIGURE 1.

Spectral properties of PIA (black) and F7GA (gray). Spectra of molar absorptivity are shown as dashed lines. The molar absorptivity of PIA was divided by 2 to match the scale. Emission spectra are shown as solid lines.
Interactions of F7GA with CYP3A4 Studied by Absorbance Spectroscopy
Binding of F7GA to the wild type CYP3A4 (Fig. 2a) causes a well pronounced spectral transition. Application of principal component analysis to the spectral series obtained in titrations reveals two significant principal components of the F7GA-induced spectral changes in CYP3A4 (Fig. 1, inset). The first component (Fig. 1, solid line) represents mainly a low-to-high spin shift (type I binding spectrum), whereas the shape of the second principal component (Fig. 1, dotted line) is indicative of type II-like changes.
FIGURE 2.

Titration of CYP3A4 wild type (a) and F304W (b) with F7GA. Series of absorbance spectra recorded at increasing concentrations of ligand are shown in the top panels. The absorbance of F7GA is subtracted with the use of principal component analysis and the prototypical spectra of F7GA absorbance. Insets illustrate the results of principal component analysis. The spectra of the first principal components are shown as solid lines. The dotted line (a, inset) shows the spectrum of the second principal component found for the wild type enzyme. Dashed lines show the approximations of the principal components with the prototypical spectra of CYP3A4 absorbance. The bottom panels illustrate the changes in the concentration of the low spin (circles), high spin (triangles), and the apparent type II complex (squares) states of the enzyme. Solid lines show the approximations of the observed changes with the sequential binding model (Scheme 2).
Resolution of the P450-related spectral changes into two principal components demonstrates that the two types of spectral changes do not take place simultaneously. Rather, the F7GA-induced spin shift takes place in the initial steps of the titration and reveals high affinity and prominent cooperativity (Fig. 2, bottom panels; Table 1), whereas the type II-like transition takes place at higher concentrations of the ligand. Therefore, the absorbance titrations of the wild type CYP3A4 with F7GA reveal at least two sequential binding events with dissimilar spectral signatures and concentration dependence.
TABLE 1.
Parameters of F7GA-induced spin shift in CYP3A4 and its variants
The values given in the table represent the averages of 3–7 individual measurements, and the ± values show the confidence interval calculated for p = 0.05.
| Protein | S50 | Hill coefficient | Fha | ΔFhb |
|---|---|---|---|---|
| μm | % | % | ||
| 3A4 | 3.31 ± 0.60 | 1.93 ± 0.31 | 7.3 ± 4.5 | 14.0 ± 4.0 |
| 3A4-PIA | 3.88 ± 1.07 | 1.27 ± 0.16 | 9.6 ± 5.7 | 16.1 ± 7.0 |
| 3A4F304W | 2.64 ± 0.49 | 1.28 ± 0.25 | 15.2 ± 4.1 | 30.9 ± 6.3 |
a Content of the high spin state in the absence of ligand is shown.
b The amplitude of F7GA-induced spin shift is shown.
As seen in the top panel in Fig. 2b, the mutant F304W exhibits increased amplitudes of the F7GA-induced spectral changes. In contrast to the wild type enzyme, an adequate representation of these changes requires only one principal component (Fig. 2b, inset), which reflects a low-to-high spin transition with some concomitant appearance of the apparent type II complex. Both types of spectral changes thus take place simultaneously in the mutant (Fig. 2b, bottom panel). Fitting of the F7GA-induced changes in the high spin fraction (Fh) of the enzyme with the Hill equation shows no effect of the mutation on the S50 value. Although decreased in the mutant, the value of the Hill coefficient (nH) remains >1, indicative of retained cooperativity (Table 1).
F7GA Binding to PIA-labeled Wild Type CYP3A4 Monitored by FRET from the Label to the Ligand
Labeling of wild type CYP3A4 with pyrene iodoacetamide at a 1:1 molar ratio yielded a CYP3A4-PIA preparation containing >0.95 m equivalent of the label per mol of the enzyme. Absorbance titration experiments showed that the labeling did not cause any significant changes in the values of S50 or the amplitude of F7GA-induced spin shift in the enzyme, although there was some decrease in the Hill coefficient (Table 1).
As shown in Fig. 3a, addition of F7GA to CYP3A4-PIA causes a profound decrease in the pyrene fluorescence concomitant with the appearance of the F7GA emission band (Fig. 3a). The titration curves (Fig. 3b) reveal prominent cooperativity and may be approximated with the Hill equation, yielding S50 and nH values of 7.0 ± 0.7 μm and 1.7 ± 0.3, respectively (the mean values and the confidence intervals are based on three independent experiments). The cooperativity observed in these experiments indicates that the signal originating from the second bound F7GA molecule predominates in the observed fluorescence changes. Therefore, the amplitude of FRET from PIA to the first bound molecule of the ligand appears to be much lower than the amplitude of FRET resulting from the second binding event.
FIGURE 3.

Interactions of F7GA with PIA-labeled CYP3A4 detected by FRET from PIA to F7GA. a, series of emission spectra recorded with 1 μm CYP3A4-PIA and F7GA concentrations of 0, 0.4, 0.7, 1.5, 2.9, 3.6, 4.4, 5.5, 5.8, 7.3, and 11 μm. b, titration curve reflecting the changes in the intensity of fluorescence of PIA. The dashed line show the results of the data fitting to the Hill equation. The solid lines show the approximation of results with the sequential binding model (Scheme 2).
Resolution of Individual Substrate Binding Events in the Interactions Registered by FRET from F7GA to the Heme
Further insight into the mechanism of interaction required resolution of the parameters of the two individual substrate binding events. These parameters may be then used in mathematical modeling of the binding isotherms obtained through FRET and absorbance titrations to probe their mutual consistency and conformity to the sequential multisite mechanism suggested in our earlier studies (5, 18). The two substrate binding events were resolved with titration-by-dilution and reverse titration studies where we monitored FRET from the ligand to the heme, similar to our studies with 1-PB (5, 18).
Fig. 4a exemplifies the results of a time-resolved fluorescence dilution experiment with a 1:1 mixture of CYP3A4 with F7GA. This setup is specific to the formation of the 1:1 enzyme-substrate complex (the first binding event), given that interactions obey a sequential mechanism involving binding sites with considerably different affinities to the ligand (5, 40). Dilution of the enzyme/substrate mixture resulted in an important increase in the observed lifetime of F7GA. The effect on the lifetime was accompanied by an increase in the intensity of fluorescence normalized to the total concentration of the fluorophore. These results indicate extensive FRET from F7GA to the heme in the complex of the ligand with CYP3A4. The titration curves obtained by registration of either the lifetime or intensity of fluorescence obey the equation for the equilibrium of a bimolecular association (Equation 1) with the KD values in the range of 2–3.5 μm (Table 2).
FIGURE 4.

Interactions of F7GA with the wild type CYP3A4 studied by lifetime FRET in a “titration-by-dilution” setup at 1:1 and 1:5 enzyme/substrate ratios. a shows a series of fluorescence decay traces obtained in a dilution experiment at 1:1 enzyme/substrate. The traces are normalized to the concentration of F7GA. The inset shows the same traces (normalized to the amplitude of 100%) in semi-logarithmic coordinates. Dots show the data set, and the solid lines show the results of its global fit to a bi-exponential equation with the characteristic times of 2.35 and 6.4 ns (ρ2>0.999). b and c illustrate the changes in the fast decay fraction (open circles) and the amplitude of the decay trace (closed circles) at 1:1 (b) and 1:5 (c) enzyme/substrate ratios, respectively. Solid lines show the approximations of the data sets with Equation 1.
TABLE 2.
Parameters of the individual F7GA-binding transitions in CYP3A4 and its F304W mutant found in dilution and reverse titration experiments based on FRET from F7GA to the heme
The values given in the table represent the averages of 2–4 individual measurements, and the ± values show the confidence interval calculated for p = 0.05.
| CYP3A4 variant | Detection method | Dilution of an equimolar enzyme-substrate mixture |
Reverse titration |
Dilution at excess substrate |
|||
|---|---|---|---|---|---|---|---|
| KD | Efficiency | KD | Efficiency | KD | Efficiency | ||
| μm | % | μm | % | μm | % | ||
| Wild Type | Lifetime | 3.48 ± 0.99 | 64.5 ± 3.9 | 3.64 ± 1.28 | 65.7 ± 8.6 | 11.7 ± 0.8 | 72.1 ± 0.9 |
| Intensity | 2.10 ± 0.80 | 119 ± 15 | 1.10 ± 0.39 | 68.8 ± 6.9 | 12.0 ± 2.8 | 100 ± 10 | |
| F304W | Lifetime | 2.70 ± 1.24 | 64.8 ± 7.0 | 3.49 ± 0.50 | 68.0 ± 0.2 | 11.6 ± 3.5 | 60.3 ± 16.3 |
| Intensity | 0.81 ± 0.60 | 126 ± 25 | 0.71 ± 0.38 | 75.4 ± 8.0 | 6.5 ± 1.6 | 99.4 ± 1.0 | |
Titration of the ligand with enzyme (reverse titrations) was also performed. Because the bulk of the measurements are performed at large excess of enzyme, and the affinity revealed in the first binding event is presumed to be higher than in the subsequent step(s), this approach also yields binding constants for complexes with 1:1 stoichiometry. As seen from Fig. 5a, addition of increasing concentrations of CYP3A4 to 0.5 μm F7GA results in a decrease in the intensity of fluorescence associated with some displacement of the band to shorter wavelengths. This displacement, which is also seen in the experiments with FRET from PIA to F7GA (Fig. 3), is presumably caused by a translocation of the substrate from solution to a more hydrophobic environment. The KD values obtained in these titrations were fairly close to the values found in 1:1 dilution experiments (Table 2).4
FIGURE 5.

Interactions of F7GA with CYP3A4 and its F304W mutant studied by FRET to the heme in a “reverse titration” setup. a, series of emission spectra representing a titration of 0.5 μm F7GA with CYP3A4 wild type. b, titration curves reflecting the changes in the normalized intensity of fluorescence at increasing concentrations of the heme protein obtained with the wild type CYP3A4 (circles) and F304W mutant (squares). Solid lines shows the approximations of the data sets with Equation 1.
In contrast to 1:1 dilution and reverse titration experiments, the series of fluorescence decay traces obtained with dilution at excess ligand must reveal a secondary substrate binding event resulting in the formation of the enzyme with several (at least two) ligand molecules (5). Consistent with the premise of a considerable difference in affinity for F7GA of the two binding sites, the fitting of the dilution curves obtained at excess substrate to Equation 1 yields estimates of KD as high as 11–12 μm (Table 2).
The results obtained with either dilution or reverse titration approaches with the F304W mutant were very close to those found for the wild type enzyme in terms of the dissociation constants and the efficiencies of FRET (Table 2). We may conclude therefore that the interactions of F7GA with either the wild type CYP3A4 or the F304W mutant involve at least two consecutive binding events. In both cases, the dissociation constant for the second binding event is 3–4-fold higher than that of the first. The replacement of Phe304 with tryptophan has no substantive effect on the multisite mechanism, despite a decrease in cooperativity seen in the absorbance titrations. This situation closely resembles the one depicted in our recent study of the interactions of 1-PB with F304W and other CYP3A4 mutants with attenuated cooperativity (18).
Analysis of the Interactions of F7GA with CYP3A4 Using the KD Values Found in FRET Dilution and Reverse Titration Studies
The experimentally derived KD1 determined in the 1:1 dilution and reverse titration experiments and KD2 determined in dilution studies at excess substrate may be used to analyze the results of either absorbance spectroscopy or PIA/F7GA FRET titrations in terms of the two-step sequential model of interactions (see Scheme 1).
In this analysis we explored the possibility that the substrate-dependent spin shift, as well as FRET from PIA to F7GA, may take place in both the ES and SES complexes. For this purpose, we used a nonlinear least squares optimization procedure to approximate the experimental results with a combination of the changes in the concentrations of the ES and SES complexes calculated according to a system of equations describing the steady-state behavior of the model (see supplemental Equation S1) (2). The initial estimates of KD1 and KD2 were set to the mean of the values found in FRET dilution and reverse titration experiments (e.g. 2.6 and 11.85 μm, respectively, for the wild type CYP3A4). The set of optimization variables included an adjustable parameter FES that reflects the fraction of the total signal caused by the formation of the complex ES (AmaxES) as opposed to the ternary complex SES (Amaxtotal) as shown in Equation 2,
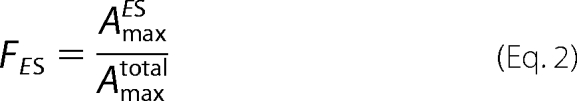 |
Results of the fitting of the isotherms of the F7GA-induced spin shift to the sequential binding model (2) are illustrated in Fig. 6. The approximation of the results of PIA/F7GA FRET titration with the same formalism is shown in Fig. 3b (solid line). In both cases, the satisfactory approximation is possible only with a nonzero value for FES.
FIGURE 6.

Approximation of the F7GA-induced changes in the CYP3A4 wild type (circles) and F304W mutant (squares) with the two-step sequential model (solid line). The parameters KD1, KD2, and FES for the approximations shown on the graph are equal to 3.0 and 9.3 μm and 0.60 for the wild type enzyme and 2.4 and 5.4 μm and 0.63 for the F304W mutant. The dashed line shows the fitting of the initial portions of the titration curves ([F7GA] <15 μm) to the Hill equation.
According to our analysis (Table 3), all F7GA-induced displacements of the spin equilibrium of CYP3A4 are exerted upon the formation of the primary complex ES. The subsequent binding of the second substrate molecule does not change the spin state or even result in some reversal of the spin shift (FES ≥0.5).
TABLE 3.
Approximation of F7GA-induced spin shift in CYP3A4 with a sequential binding model
The values given in the table represent the averages of 3–7 individual measurements, and the ± values show the confidence interval calculated for p = 0.05. NA means not assessed.
| Protein | Absorbance titrations |
FRET titrations |
||||
|---|---|---|---|---|---|---|
| KD1 | KD1 | FES | KD1 | KD1 | FES | |
| μm | μm | μm | μm | |||
| 3A4 | 3.3 ± 0.6 | 8.6 ± 1.3 | 0.57 ± 0.10 | NA | NA | NA |
| 3A4-PIA | 2.9 ± 0.5 | 10.2 ± 4.5 | 0.47 ± 0.07 | 2.7 ± 0.4 | 8.9 ± 4.6 | 0.19 ± 0.05 |
| 3A4F304W | 2.4 ± 0.8 | 8.0 ± 2.5 | 0.60 ± 0.04 | NA | NA | NA |
In contrast, the amplitude of FRET observed upon the formation of the complex ES amounts to only 19 ± 5% of the amplitude characteristic of the ternary complex (Table 3). Close similarity of the estimates of KD1 and KD2 derived from the approximation of absorbance and PIA/F7GA FRET titration results demonstrate internal consistency of the model (Scheme 1) in depicting the mechanism of interactions revealed by either of the two approaches.
Importantly, the difference in the PIA/F7GA FRET efficiencies characteristic of the first and the second bound molecules of the ligand suggests a considerable difference in the distances from PIA to each of the two binding sites. According to these results, the enzyme binds F7GA at two distinct, spatially segregated sites.
Probing the Position of F7GA-binding Sites by FRET Titrations in a Series of Cysteine-depleted Mutants Labeled with PIA
The uncertain and possibly heterogeneous position of the donor fluorophore in PIA-labeled CYP3A4 prevented any further structural interpretation of FRET results obtained with wild type CYP3A4. Therefore, to localize the two individual F7GA-binding sites, we employed site-directed incorporation of the PIA label into mutants of CYP3A4 bearing modification-accessible cysteines at positions 64, 377, 468, or 495.
In a previous study (26), we described the design of cysteine-depleted mutants C58/C64, C64, and C58. The yield of C58/C64 in E. coli was close to that of the wild type enzyme, although the recovery of C64 and C58 mutants was considerably lower. All three mutants were stable and showed no substantial changes in the parameters of interactions with such substrates as 1-PB, α-naphthoflavone (ANF), and bromocriptine. We also labeled these mutants with equimolar BADAN and demonstrated that the C64/C58 double mutant bears this thiol-reactive probe uniquely at Cys64 (26).
In this study, we probed the labeling of these three constructs with PIA. As with BADAN, modification of C64 by PIA is much faster than labeling of C58. Furthermore, the labeled C64 is stable, whereas PIA-labeled C58 is prone to precipitate and convert to the inactive P420 state (data not shown). Therefore, to introduce the PIA label at Cys64, we utilized the C58/C64 double cysteine mutant, which gave higher expression.
The same approach was used to introduce the label at Cys377 through the use of the C377/C58 construct. We also employed the C468 and C495 single cysteine constructs. The yield of expression of C377/C58 and C468 mutants was similar to that of the C58/C64 construct (∼200 nmol/liter of culture). The recovery of C495 was lower and did not exceed 70 nmol/liter. All three mutants were stable and showed no effect of the mutation on the parameters of their interactions with 1-PB, ANF, and bromocriptine (data not shown).
The PIA/F7GA FRET titration curves for all four labeled mutants are shown in Fig. 7a. Although the general behavior seen with the PIA-labeled wild type is retained in all four mutants, the amplitude of fluorescence decreases, and values of the Hill coefficient and FES values differ considerably among the mutants (Table 4).
FIGURE 7.

Interactions of F7GA with PIA-labeled CYP3A4 cysteine-depleted variants detected by FRET. a shows the results obtained with C64/C58, C377/C58, C468, and C495 mutants in solution. b illustrates the titration obtained with C64/C58 and C468 mutants incorporated into proteoliposomes. The dashed lines show the results of the data fitting to the Hill equation. The solid lines illustrate the approximation of the results with the sequential binding model (Scheme 2).
TABLE 4.
Parameters of interactions of F7GA with PIA-labeled single cysteine variants of CYP3A4 determined by FRET
The values given in the table represent the averages of 2–4 individual measurements, and the ± values show the confidence interval calculated for p = 0.05.
| Position of the label | Fitting to the Hill equation |
Approximation with the sequential two-step model (Scheme 1) |
FRET efficiencies and the distances between the fluorophores for each of the two binding events |
|||||||
|---|---|---|---|---|---|---|---|---|---|---|
| S50 | Hill coefficient | KD1 | KD2 | FES | ETa | E1 | R1 | E2 | R2 | |
| μm | μm | % | % | Å | % | Å | ||||
| Cys64 | 3.0 ± 0.8 | 1.3 ± 0.1 | 1.0 ± 0.2 | 4.2 ± 1.1 | 0.33 ± 0.07 | 94 ± 3 | 49 ± 13 | 31.9 ± 1.4 | 93 ± 4 | 20.1 ± 2.5 |
| Cys377 | 4.1 ± 0.5 | 1.5 ± 0.2 | 3.4 ± 0.4 | 8.1 ± 2.2 | 0.45 ± 0.02 | 77 ± 5 | 62 ± 7 | 27.5 ± 0.8 | 62 ± 9 | 25.1 ± 1.6 |
| Cys468 | 6.0 ± 1.3 | 1.7 ± 0.3 | 1.2 ± 0.6 | 5.3 ± 1.3 | 0.14 ± 0.1 | 79 ± 14 | 18 ± 14 | 42.7 ± 8.4 | 82 ± 15 | 26.2 ± 5.3 |
| Cys495 | 4.6 ± 0.7 | 1.3 ± 0.2 | 0.9 ± 0.3 | 5.4 ± 2.2 | 0.20 ± 0.07 | 89 ± 4 | 28 ± 7 | 37.3 ± 1.9 | 88 ± 4 | 23.2 ± 1.7 |
a Overall efficiency of FRET in the enzyme saturated with F7GA.
Before using the FRET efficiencies derived from these experiments to probe the locations of each of the two binding sites in the CYP3A4 molecule, it was necessary to verify that the FRET takes place within one and the same molecule of the enzyme as opposed to different subunits of an oligomer, which CYP3A4 forms in solution. To this end, we studied the interactions of F7GA with PIA-labeled C64/C58 and C468 mutants incorporated into large proteoliposomes with lipid/protein molar ratio of 1000:1. Our recent studies demonstrated that incorporation into these lipid-rich liposomes results in complete monomerization of CYP3A4 enzyme oligomers (27). The results of PIA/F7GA FRET titrations of CYP3A4 monomers in liposomes (Fig. 7b) were quite similar to those obtained in solution. Both mutants exhibited a distinct cooperativity with Hill coefficients as high as 1.5 ± 0.3 and 1.9 ± 0.5, respectively. As seen from supplemental Table 1S, the values of the S50, KD1, and KD2 were ∼2 times higher than those observed in solution, whereas the other parameters reveled no considerable effect of the enzyme monomerization in the membrane. The results suggest that the major part of the observed signal derives from FRET between PIA and F7GA fluorophores located in the same enzyme molecule.
Determination of the Distances from the PIA Probes to F7GA-binding Sites
The FRET efficiencies specific to F7GA molecules bound to the high (E1) and low affinity (E2) binding sites (Table 4) were calculated using the known formalism for overall efficiency of FRET in a system with two acceptors and a single donor (41), as described in the supplemental material. The efficiencies were used to estimate the distances of the F7GA molecules from each of the four positions of the donor fluorophore. These calculations require the knowledge of the quantum yield (Φ) of the pyrene fluorophore (the donor), which is very sensitive to the environment and may be decreased by stacking interactions with the neighboring aromatic residues (42).
Experimental determination of the quantum yield (Φ) was based on the use of an ethanol solution of the laser dye coumarin-47 as a reference (Φ = 0.73 (43)) and involved a correction for quenching of fluorescence due to FRET to the heme. For this correction, we determined the effect of H2O2-dependent heme depletion on the intensity of fluorescence in the protein-incorporated PIA label. The complete procedure for these measurements is described in the supplemental material. The values of Φ specific to the PIA labels incorporated into the C64/C58, C377/C58, C468, and C495 mutants were 38.4, 23.3, 41.8, and 28.9%, respectively.
The estimates of the donor-acceptor distances derived from the calculation according to the Förster equation (see Ref. 38, Equation 13.2) are shown in Table 4. All four distances of the PIA probes to the second low affinity binding site (R2) are quite similar (20–26 Å) and close to the average radius of the CYP3A4 molecule. The location of the labels at different positions in the periphery of the enzyme therefore suggests that the low affinity site is located close to the geometrical center of the enzyme, most probably in the heme binding pocket. In contrast, the distances to the high affinity binding site (R1) differ considerably, which suggest a peripheral location of this site. Initial ligand binding outside of the active site is also supported by the studies of Isin and Guengerich (14, 44), who investigated the kinetics of CYP3A4 interactions with its substrates and inhibitors.
Structural Interpretation of the R1 and R2 Distances
Further interpretation of the distances found above requires a structural model of PIA-labeled CYP3A4 mutants, which was built on the basis of the structure of CYP3A4 complex with progesterone (PDB entry 1W0F) (23), as described under “Experimental Procedures.” The resulting model is illustrated in Fig. 8. The respective PDB file may be found in supplemental material.
FIGURE 8.

Model of interactions of F7GA with PIA-labeled CYP3A4. a shows the structure of the CYP3A4 (PDB entry 1W0E) with PIA labels attached at Cys64, Cys377, and Cys468 and at the cysteine residue introduced at position 495. The regions of the protein backbone that comply with the set of distances determined by FRET are shown in magenta (high affinity binding site, distal location), blue (high affinity binding site, proximal location), and green (binding site for the second binding event). Three possible positions of the peripherally bound F7GA molecules are shown in magenta (distal binding, position F2A1), blue (proximal binding, position F3A2), and light blue (position F3C1). The molecule of F7GA shown in green represents the best position found for the second binding event (position F1A3). The detailed views of the putative binding sites at the distal surface (position F2A1) and in the heme-pocket (position F1A3) are shown in b and c, respectively.
The coordinates of pyrene moieties in the above model were used to find the fragments of the CYP3A4 molecule that comply with the distance restraints imposed by the sets of the R1 and R2 distances. This was done with a custom program that scanned all non-hydrogen atoms of the side chains in the CYP3A4 structure and calculated their distances to each of the four pyrene moieties (precisely, to the midpoint between the carbon atoms 11 and 12). The root mean square deviation (r.m.s.d.) of these distances from the set of four R1 or R2 distances (Table 4) was then calculated. The amino acid residues containing at least one non-hydrogen atom in with r.m.s.d. below the specified threshold were considered as markers of the binding site. The coordinates of the side chain atoms selected in this way were then used to locate the approximate position of the bound F7GA molecule. The residues found with this analysis are shown in Fig. 8a with the backbone colored in magenta or blue (scanning with the set of R1 values) or green (scanning with the set of R2 values).
The scanning with the set of R2 distances and the r.m.s.d. threshold of 4.5 Å identified only four hits. The set of matching residues, which is designated below as “set R1,” includes residues Pro358, Ile369, Leu483, and Asn484 located in the substrate binding pocket of CYP3A4. Therefore, consistent with our initial conclusion, the low affinity F7GA binding event appears to take place in the substrate binding pocket.
The residues that comply with the set of distances R1 at the threshold of 4 Å diverge into two subsets located on the opposite sides of the molecule. The first subset shown in Fig. 8a, magenta (set R1-1, which includes residues 108, 109, 213, 219, 223, and 238–241), is located at the distal side of the molecule, close to the phenylalanine cluster (23). The second subset, which is shown in Fig. 8a, blue (set R1-2, residues 424, 426–437, and 441–445), is located at the proximal surface, close to α-helixes K, K′, and the meander region.
The interactions of F7GA with CYP3A4 in the proximity of the found sets of residues were modeled with Autodock Vina (37) as described under “Experimental Procedures.” The coordinates of the three best poses of the ligand docked in the proximity of the R1-1, R1-2, and R2 sets of residues may be found in the PDB file (supplemental materials). The geometric localization and energy of interactions for the best F7GA positions are characterized in Table 5.
TABLE 5.
Mapping the positions of the F7GA-binding sites based on the FRET-derived distances
| Distancesa |
r.m.s.d.b | ΔGc | Interfacing residues | ||||
|---|---|---|---|---|---|---|---|
| PIA-64 | PIA-377 | PIA-468 | PIA-495 | ||||
| Å | Å | kcal/mol | |||||
| Distance from the high affinity site (R1) | 31.9 ± 1.4 | 27.5 ± 0.8 | 42.7 ± 8.4 | 37.3 ± 1.9 | |||
| Distal site (position F2A1d) | 31.5 | 30.4 | 35.0 | 37.7 | 2.05 | −7.2 | Asp217, Phe219, Phe220, Leu236, Ile238 |
| Proximal site 1 (position F3A1) | 30.9 | 38.9 | 40.4 | 36.6 | 2.92 | −6.7 | Tyr407, Trp408, Arg418, Ile427 |
| Proximal site 2 (position F3B2) | 35.1 | 31.1 | 40.3 | 35.7 | 1.40 | −6.4 | Lys424, Ile427, Pro429, Tyr432, Phe435 |
| Distance from the low affinity site (R2) | 20.1 ± 2.5 | 25.1 ± 1.6 | 26.2 ± 5.3 | 23.2 ± 1.7 | |||
| Heme pocket site (position F1A3) | 30.3 | 23.4 | 35.6 | 34.1 | 4.43 | −8.2 | Leu373, Glu374, Arg105, Ser119, Met371 |
a The values given for the docking positions represent the distances from the midpoint between carbon atoms 11 and 12 of the pyrene moiety to the central carbon atom of the F7GA ring system.
b Root mean square deviation of the distances calculated from the docking model with the FRET-based estimates.
c Free energy of binding was calculated by Autodock Vina.
d The designations of the F7GA poses given in parentheses correspond to those used in the PDB file found in the supplemental material.
The best position of the F7GA molecule docked in the proximity of the residues of the subset R1-1 is shown in Fig. 8a in magenta. The detailed view of its docking is shown in Fig. 8b. Similar to the peripherally bound molecule of progesterone (23), F7GA molecule packs against the side chains of Phe219, Phe220, and Ile238. The complex is stabilized by a hydrogen bond between the NH group of the ligand and the carbonyl oxygen of Asp217. The distances from this position to the four pyrene moieties in PIA-labeled CYP3A4 (Table 5) are in a good agreement with our estimates of R1.
The alternative position of the high affinity binding site is located on the opposite proximal side of the molecule. Docking of F7GA in this region suggests two possible positions in the proximity of the set of residues R1-2. Both positions, which are shown in dark and light blue in Fig. 8a, are close to α-helices K and K′ and the meander region. The predicted energies of interactions at these sites are less favorable than at the distal site, although the compliance of the distances is slightly better (Table 5).
Among the two possible locations of the high affinity binding site, the location at the distal site is considerably more likely. Besides being supported by the x-ray structure of the progesterone complex, the binding at the distal side in the proximity of the phenylalanine cluster (subset R1-1) provides a sound explanation for the effect of site-directed mutagenesis in this region on CYP3A4 cooperativity (12, 18, 19, 45).
Displacement of the spin equilibrium of the heme iron by the first F7GA binding event detected in our experiments implies a role of ligand-induced conformational transitions. This conformational modulation is also consistent with ligand binding at the phenylalanine cluster, which may have a considerable effect on the shape, size, and accessibility of the substrate binding pocket (23, 24).
As expected, all poses found by docking of F7GA in the proximity of the residues of set R2 (low affinity binding site) are positioned in the substrate binding pocket. The pose that has the most favorable energy of interactions is shown in Fig. 8a in green. Fig. 8c illustrates the detailed view of the docking. As seen from this figure, the interactions are mediated by residues Arg105, Leu373, and Ser119, which are known to belong to substrate-recognition regions in the CYP3A4 active site (24, 46–48).
As suggested by the absorbance titrations, the binding of F7GA in the active site does not result in any further low-to-high spin shift but induces some low amplitude type II spectral changes. These changes are typical for P450 interactions with NH-containing compounds and may be caused by some partial ligation of the heme iron to the nitrogen atom in the butylamino group of F7GA. The fact that the F304W mutation eliminates this spectral transition may indicate altered geometry of F7GA binding, which prevents the interactions of the NH group with the heme iron.
Conclusions
Results of our analysis demonstrate that the interactions of CYP3A4 with F7GA may be considered as a sequence of two substrate binding events, where the first molecule of the ligand binds at the periphery of the enzyme. This mechanism of interactions appears to be general and is in good agreement with the results obtained with 1-PB and CYP3A4 mutants with decreased cooperativity (18), as well as the studies of the interactions of CYP3A4 with bromocriptine, testosterone, and ANF (14, 22, 44).
The most probable position of the peripheral binding site suggested by our results is similar to that observed by x-ray crystallography of either CYP3A4 in the complex with progesterone (23) or CYP2C8 with a peripherally bound palmitic acid (49). Despite these prior observations, there was no direct evidence of any involvement of the peripheral interactions in P450 mechanisms. Our results provide the first indication of a functionally important ligand-binding site outside of the CYP3A4 active site. This finding changes considerably our view of the mechanisms of cooperativity in the enzyme and strongly implicates a conformational transition triggered by a ligand bound to an allosteric site outside of the substrate-binding pocket. Our results raise the intriguing possibility that there may be specific endogenous ligands of this newly discovered peripheral site that play a key role in allosteric regulation of the microsomal drug metabolizing system.
Supplementary Material
Acknowledgment
We are grateful to Arthur G. Roberts for help in establishing the approaches to molecular modeling and docking.
This work was supported, in whole or in part, by National Institutes of Health Grant GM054995 (to J. R. H.).

This article contains supplemental Fig. S1, Table S1, Equations S1–S4, model, and additional references.
When terming the mutants as “double” or “single cysteines,” we do not count the cysteine residue serving as a heme ligand (Cys442), which is inaccessible to modification and was retained in all our constructs.
It should be noted, however, that both the 1:1 dilution and reverse titration experiments reveal some differences between the parameters determined with the lifetime and the steady-state methods. In particular, the estimate of the FRET efficiency based on the lifetime measurements in the dilution setup is lower than the value from the intensity data, which appears to exceed 100% (Table 2). This discrepancy may indicate that the mechanistic basis of the decrease in the intensity of fluorescence is complex and involves some additional steps that are not accompanied by any changes in the lifetime. Although the difference in the apparent efficiencies of FRET is not seen in the reverse titration, there is a notable difference in the KD values found with the two approaches (Table 2).
- 1-PB
- 1-pyrenebutanol
- ANF
- α-naphthoflavone
- F7GA
- fluorol-7GA (fluorol-555, 2-butyl-6-(butylamino)-1H-benz[de]isoquinoline-1,3(2H)-dione)
- PIA
- pyrene iodoacetamide
- PDB
- Protein Data Bank.
REFERENCES
- 1. Davydov D. R., Halpert J. R. (2008) Allosteric P450 mechanisms. Multiple binding sites, multiple conformers, or both? Expert Opin. Drug. Metab. 4, 1523–1535 [DOI] [PMC free article] [PubMed] [Google Scholar]
- 2. Denisov I. G., Frank D. J., Sligar S. G. (2009) Cooperative properties of cytochromes P450. Pharmacol. Ther. 124, 151–167 [DOI] [PMC free article] [PubMed] [Google Scholar]
- 3. Niwa T., Murayama N., Yamazaki H. (2008) Heterotropic cooperativity in oxidation mediated by cytochrome P450. Curr. Drug Metab. 9, 453–462 [DOI] [PubMed] [Google Scholar]
- 4. Hosea N. A., Miller G. P., Guengerich F. P. (2000) Elucidation of distinct ligand-binding sites for cytochrome P450 3A4. Biochemistry 39, 5929–5939 [DOI] [PubMed] [Google Scholar]
- 5. Fernando H., Halpert J. R., Davydov D. R. (2006) Resolution of multiple substrate-binding sites in cytochrome P450 3A4. The stoichiometry of the enzyme-substrate complexes probed by FRET and Job's titration. Biochemistry 45, 4199–4209 [DOI] [PMC free article] [PubMed] [Google Scholar]
- 6. Dabrowski M. J., Schrag M. L., Wienkers L. C., Atkins W. M. (2002) Pyrene·pyrene complexes at the active site of cytochrome P450 3A4. Evidence for a multiple substrate-binding site. J. Am. Chem. Soc. 124, 11866–11867 [DOI] [PubMed] [Google Scholar]
- 7. Roberts A. G., Campbell A. P., Atkins W. M. (2005) The thermodynamic landscape of testosterone binding to cytochrome P450 3A4. Ligand binding and spin state equilibria. Biochemistry 44, 1353–1366 [DOI] [PubMed] [Google Scholar]
- 8. Baas B. J., Denisov I. G., Sligar S. G. (2004) Homotropic cooperativity of monomeric cytochrome P450 3A4 in a nanoscale native bilayer environment. Arch. Biochem. Biophys. 430, 218–228 [DOI] [PubMed] [Google Scholar]
- 9. Denisov I. G., Baas B. J., Grinkova Y. V., Sligar S. G. (2007) Cooperativity in cytochrome P450 3A4. Linkages in substrate binding, spin state, uncoupling, and product formation. J. Biol. Chem. 282, 7066–7076 [DOI] [PubMed] [Google Scholar]
- 10. Kapelyukh Y., Paine M. J., Maréchal J. D., Sutcliffe M. J., Wolf C. R., Roberts G. C. (2008) Multiple substrate binding by cytochrome P450 3A4. Estimation of the number of bound substrate molecules. Drug Metab. Dispos. 36, 2136–2144 [DOI] [PubMed] [Google Scholar]
- 11. Korzekwa K. R., Krishnamachary N., Shou M., Ogai A., Parise R. A., Rettie A. E., Gonzalez F. J., Tracy T. S. (1998) Evaluation of atypical cytochrome P450 kinetics with two-substrate models. Evidence that multiple substrates can simultaneously bind to cytochrome P450 active sites. Biochemistry 37, 4137–4147 [DOI] [PubMed] [Google Scholar]
- 12. Harlow G. R., Halpert J. R. (1998) Analysis of human cytochrome P450 3A4 cooperativity. Construction and characterization of a site-directed mutant that displays hyperbolic steroid hydroxylation kinetics. Proc. Natl. Acad. Sci. U.S.A. 95, 6636–6641 [DOI] [PMC free article] [PubMed] [Google Scholar]
- 13. Atkins W. M., Wang R. W., Lu A. Y. (2001) Allosteric behavior in cytochrome P450-dependent in vitro drug-drug interactions. A prospective based on conformational dynamics. Chem. Res. Toxicol. 14, 338–347 [DOI] [PubMed] [Google Scholar]
- 14. Isin E. M., Guengerich F. P. (2006) Kinetics and thermodynamics of ligand binding by cytochrome P450 3A4. J. Biol. Chem. 281, 9127–9136 [DOI] [PubMed] [Google Scholar]
- 15. Isin E. M., Guengerich F. P. (2008) Substrate binding to cytochromes P450. Anal. Bioanal. Chem. 392, 1019–1030 [DOI] [PMC free article] [PubMed] [Google Scholar]
- 16. Davydov D. R., Botchkareva A. E., Davydova N. E., Halpert J. R. (2005) Resolution of two substrate-binding sites in an engineered cytochrome P450eryF bearing a fluorescent probe. Biophys. J. 89, 418–432 [DOI] [PMC free article] [PubMed] [Google Scholar]
- 17. Conner K. P., Woods C. M., Atkins W. M. (2011) Interactions of cytochrome P450s with their ligands. Arch. Biochem. Biophys. 507, 56–65 [DOI] [PMC free article] [PubMed] [Google Scholar]
- 18. Fernando H., Rumfeldt J. A., Davydova N. Y., Halpert J. R., Davydov D. R. (2011) Multiple substrate-binding sites are retained in cytochrome P450 3A4 mutants with decreased cooperativity. Xenobiotica 41, 281–289 [DOI] [PMC free article] [PubMed] [Google Scholar]
- 19. Domanski T. L., He Y. A., Khan K. K., Roussel F., Wang Q., Halpert J. R. (2001) Phenylalanine and tryptophan scanning mutagenesis of CYP3A4 substrate recognition site residues and effect on substrate oxidation and cooperativity. Biochemistry 40, 10150–10160 [DOI] [PubMed] [Google Scholar]
- 20. Domanski T. L., He Y. A., Harlow G. R., Halpert J. R. (2000) Dual role of human cytochrome P450 3A4 residue Phe-304 in substrate specificity and cooperativity. J. Pharmacol. Exp. Ther. 293, 585–591 [PubMed] [Google Scholar]
- 21. Ueng Y. F., Kuwabara T., Chun Y. J., Guengerich F. P. (1997) Cooperativity in oxidations catalyzed by cytochrome P450 3A4. Biochemistry 36, 370–381 [DOI] [PubMed] [Google Scholar]
- 22. Roberts A. G., Atkins W. M. (2007) Energetics of heterotropic cooperativity between α-naphthoflavone and testosterone binding to CYP3A4. Arch. Biochem. Biophys. 463, 89–101 [DOI] [PMC free article] [PubMed] [Google Scholar]
- 23. Williams P. A., Cosme J., Vinkovic D. M., Ward A., Angove H. C., Day P. J., Vonrhein C., Tickle I. J., Jhoti H. (2004) Crystal structures of human cytochrome P450 3A4 bound to metyrapone and progesterone. Science 305, 683–686 [DOI] [PubMed] [Google Scholar]
- 24. Ekroos M., Sjögren T. (2006) Structural basis for ligand promiscuity in cytochrome P450 3A4. Proc. Natl. Acad. Sci. U.S.A. 103, 13682–13687 [DOI] [PMC free article] [PubMed] [Google Scholar]
- 25. Davydov D. R., Davydova N. Y., Halpert J. R. (2008) Allosteric transitions in cytochrome P450eryF explored with pressure-perturbation spectroscopy, lifetime FRET, and a novel fluorescent substrate, Fluorol-7GA. Biochemistry 47, 11348–11359 [DOI] [PMC free article] [PubMed] [Google Scholar]
- 26. Tsalkova T. N., Davydova N. Y., Halpert J. R., Davydov D. R. (2007) Mechanism of interactions of α-naphthoflavone with cytochrome P450 3A4 explored with an engineered enzyme bearing a fluorescent probe. Biochemistry 46, 106–119 [DOI] [PMC free article] [PubMed] [Google Scholar]
- 27. Davydov D. R., Sineva E. V., Sistla S., Davydova N. Y., Frank D. J., Sligar S. G., Halpert J. R. (2010) Electron transfer in the complex of membrane-bound human cytochrome P450 3A4 with the flavin domain of P450BM-3. The effect of oligomerization of the heme protein and intermittent modulation of the spin equilibrium. Biochim. Biophys. Acta 1797, 378–390 [DOI] [PMC free article] [PubMed] [Google Scholar]
- 28. Haugland R. P. (2007) Handbook of Fluorescent Probes and Research Products, 9th Ed., Molecular Probes, Inc., Eugene, OR [Google Scholar]
- 29. Brackman U. (2000) Lambdachrome Laser Dyes, 3rd Ed., Lambda Physik AG, Goettingen, Germany [Google Scholar]
- 30. Davydov D. R., Fernando H., Halpert J. R. (2006) Variable path length and counter-flow continuous variation methods for the study of the formation of high affinity complexes by absorbance spectroscopy. An application to the studies of substrate binding in cytochrome P450. Biophys. Chem. 123, 95–101 [DOI] [PubMed] [Google Scholar]
- 31. Davydov D. R., Deprez E., Hoa G. H., Knyushko T. V., Kuznetsova G. P., Koen Y. M., Archakov A. I. (1995) High pressure-induced transitions in microsomal cytochrome P450 2B4 in solution. Evidence for conformational inhomogeneity in the oligomers. Arch. Biochem. Biophys. 320, 330–344 [DOI] [PubMed] [Google Scholar]
- 32. Renaud J. P., Davydov D. R., Heirwegh K. P., Mansuy D., Hui Bon Hoa G. H. (1996) Thermodynamic studies of substrate binding and spin transitions in human cytochrome P-450 3A4 expressed in yeast microsomes. Biochem. J. 319, 675–681 [DOI] [PMC free article] [PubMed] [Google Scholar]
- 33. Segel I. H. (1975) Enzyme Kinetics: Behavior and Analysis of Rapid Equilibrium and Steady-state Enzyme Systems, Wiley-Interscience, New York [Google Scholar]
- 34. Ponder J. W., Richards F. M. (1987) An efficient newton-like method for molecular mechanics energy minimization. J. Comp. Chem. 8, 1016–1024 [Google Scholar]
- 35. O'Boyle N. M., Banck M., James C. A., Morley C., Vandermeersch T., Hutchison G. R. (2011) Open Babel. An open chemical toolbox. J. Cheminformatics 3, 33. [DOI] [PMC free article] [PubMed] [Google Scholar]
- 36. Allinger N. L., Yuh Y. H., Lii J. H. (1989) Molecular mechanics. The MM3 force-field for hydrocarbons. J. Am. Chem. Soc. 111, 8551–8566 [Google Scholar]
- 37. Trott O., Olson A. J. (2010) Software news and update AutoDock Vina. Improving the speed and accuracy of docking with a new scoring function, efficient optimization, and multithreading. J. Comp. Chem. 31, 455–461 [DOI] [PMC free article] [PubMed] [Google Scholar]
- 38. Lakowitz J. R. (1999) Principles of Fluorescence Spectroscopy, 2nd Ed., Kluwer Academic/Plenum Publishers, New York [Google Scholar]
- 39. Dixon J. M., Taniguchi M., Lindsey J. S. (2005) PhotochemCAD 2. A refined program with accompanying spectral databases for photochemical calculations. Photochem. Photobiol. 81, 212–213 [DOI] [PubMed] [Google Scholar]
- 40. Davydov D. R., Kumar S., Halpert J. R. (2002) Allosteric mechanisms in P450eryF probed with 1-pyrenebutanol, a novel fluorescent substrate. Biochem. Biophys. Res. Commun. 294, 806–812 [DOI] [PubMed] [Google Scholar]
- 41. Koushik S. V., Blank P. S., Vogel S. S. (2009) Anomalous surplus energy transfer observed with multiple FRET acceptors. PLoS One 4, e8031. [DOI] [PMC free article] [PubMed] [Google Scholar]
- 42. Masuko M., Ohuchi S., Sode K., Ohtani H., Shimadzu A. (2000) Fluorescence resonance energy transfer from pyrene to perylene labels for nucleic acid hybridization assays under homogeneous solution conditions. Nucleic Acid Res. 28, E34. [DOI] [PMC free article] [PubMed] [Google Scholar]
- 43. Jones G., Jackson W. R., Choi C., Bergmark W. R. (1985) Solvent effects on emission yield and lifetime for coumarin laser dyes. Requirements for a rotatory decay mechanism. J. Phys. Chem. 89, 294–300 [Google Scholar]
- 44. Isin E. M., Guengerich F. P. (2007) Multiple sequential steps involved in the binding of inhibitors to cytochrome P450 3A4. J. Biol. Chem. 282, 6863–6874 [DOI] [PubMed] [Google Scholar]
- 45. Domanski T. L., Liu J., Harlow G. R., Halpert J. R. (1998) Analysis of four residues within substrate recognition site 4 of human cytochrome P450 3A4. Role in steroid hydroxylase activity and α-naphthoflavone stimulation. Arch. Biochem. Biophys. 350, 223–232 [DOI] [PubMed] [Google Scholar]
- 46. Szklarz G. D., Halpert J. R. (1997) Use of homology modeling in conjunction with site-directed mutagenesis for analysis of structure-function relationships of mammalian cytochromes P450. Life Sci. 61, 2507–2520 [DOI] [PubMed] [Google Scholar]
- 47. Lewis D. F., Lake B. G., Dickins M., Goldfarb P. S. (2004) Homology modeling of CYP3A4 from the CYP2C5 crystallographic template. Analysis of typical CYP3A4 substrate interactions. Xenobiotica 34, 549–569 [DOI] [PubMed] [Google Scholar]
- 48. Sevrioukova I. F., Poulos T. L. (2010) Structure and mechanism of the complex between cytochrome P4503A4 and ritonavir. Proc. Natl. Acad. Sci. U.S.A. 107, 18422–18427 [DOI] [PMC free article] [PubMed] [Google Scholar]
- 49. Schoch G. A., Yano J. K., Wester M. R., Griffin K. J., Stout C. D., Johnson E. F. (2004) Structure of human microsomal cytochrome P450 2C8. Evidence for a peripheral fatty acid-binding site. J. Biol. Chem. 279, 9497–9503 [DOI] [PubMed] [Google Scholar]
- 50. Pettersen E. F., Goddard T. D., Huang C. C., Couch G. S., Greenblatt D. M., Meng E. C., Ferrin T. E. (2004) UCSF Chimera. A visualization system for exploratory research and analysis. J. Comput. Chem. 25, 1605–1612 [DOI] [PubMed] [Google Scholar]
Associated Data
This section collects any data citations, data availability statements, or supplementary materials included in this article.