Background: Cardiac steroid (CS)-Na+,K+-ATPase interactions regulate numerous physiological functions.
Results: CS, low extracellular K+, and hypoxia induce formation of glycogen-microtubule clusters adjacent to the nucleus.
Conclusion: Formation of these clusters is mediated by Na+,K+-ATPase, ERK1/2 signaling, and an additional unknown factor.
Significance: These novel CS-induced structural changes may be part of a new type of cellular stress response.
Keywords: Glycogen; Hypoxia; Microtubules; Na,K-ATPase; Signal Transduction; Steroid; Bufalin; Cardiac Steroids
Abstract
Cardiac steroids (CS), an important class of naturally occurring compounds, are synthesized in plants and animals. The only established receptor for CS is the ubiquitous Na+,K+-ATPase, a major plasma membrane transporter. The binding of CS to Na+,K+-ATPase causes the inhibition of Na+ and K+ transport and elicits cell-specific activation of several intracellular signaling mechanisms. It is well documented that the interaction of CS with Na+,K+-ATPase is responsible for numerous changes in basic cellular physiological properties, such as electrical plasma membrane potential, cell volume, intracellular [Ca2+] and pH, endocytosed membrane traffic, and the transport of other solutes. In the present study we show that CS induces the formation of dark structures adjacent to the nucleus in human NT2 and ACHN cells. These structures, which are not surrounded by membranes, are clusters of glycogen and a distorted microtubule network. Formation of these clusters results from a relocation of glycogen and microtubules in the cells, two processes that are independent of one another. The molecular mechanisms underlying the formation of the clusters are mediated by the Na+,K+-ATPase, ERK1/2 signaling pathway, and an additional unknown factor. Similar glycogen clusters are induced by hypoxia, suggesting that the CS-induced structural change, described in this study, may be part of a new type of cellular stress response.
Introduction
The plasma membrane Na+,K+-ATPase hydrolyzes ATP and uses the free energy thus generated to drive potassium into the cell and sodium out of the cell, against their electrochemical gradients. Consequently, this enzyme plays an important role in regulating cell volume, the electric potential of the plasma membrane, and cytoplasmic pH and Ca2+ levels, through the Na+/H+ and Na+/Ca2+ exchangers, respectively, and several secondary transport systems of organic molecules (for review, see Refs. 1, 2). The Na+,K+-ATPase is a heteromeric protein composed of an α catalytic subunit that binds Na+,K+, and ATP, and β and FXYD subunits that can modulate substrate affinity (3, 4). Specific steroids originally identified in plants and amphibians, (e.g. digitalis, cardenolides, bufadienolides) here collectively termed cardiac steroids (CS),2 bind to a specific site on the α subunit and inhibit ATP hydrolysis and ion transport (5, 6). These compounds have been used in Western and Eastern medicine for many centuries to treat cardiac insufficiency and heart arrhythmia, as well as for other indications (7). In the past decade, CS were identified in animal and human tissues and were shown to be present at nanomolar concentrations in the circulation (8, 9). These steroids are synthesized in and released from the adrenal gland and are considered to function as hormones involved in salt and water homeostasis and in the regulation of blood pressure, cell viability, and growth (10, 11). The Na+,K+-ATPase/CS system has also been shown to be involved in several pathological states, including hypertension, cancer, neurological hereditary diseases, and depressive disorders (12–14).
The interaction of CS with Na+,K+-ATPase was shown to affect cell function via several molecular pathways. These include the inhibition of Na+ and K+ transport across the plasma membrane, activation of intracellular signal transduction mechanisms (15), activation of cytoplasmic Ca2+ oscillation (16), induction of apoptosis (17), and inhibition of endocytosed membrane traffic (18). The notion that Na+,K+-ATPase functions as a receptor for CS, thereby activating an intracellular phosphorylation cascade, was originally based on the observation that the addition of CS to neonatal rat cardiac myocytes induces the activation of Ras and the p42/44 mitogen-activated protein kinase (MAPK) pathway (19). This concept was confirmed by numerous studies in various cells and experimental systems (11). The Na+,K+-ATPase molecules, which mediate signal transduction, were defined as “nonpumping” ATPases located in defined functional units in the plasma membrane termed “signalosomes” (20, 21). Signaling through the CS-Na+,K+-ATPase interaction was shown to be involved in several biological processes, including heart muscle contractility, cell growth, and glycogen synthesis (22–24).
Although all CS have a similar chemical structure (cardiotonic steroids are composed of three major components: a steroid core, a 5-membered or 6-membered lactone ring (cardenolides or bufadienolides), and, in most cases a sugar moiety), their effects are highly diverse (25). The pharmacological profile of the effect of the most studied compounds (ouabain, digoxin, bufalin) was attributed to their ability to bind to and inhibit Na+,K+-ATPase. However, numerous recent studies revealed CS-induced phenomena that do not correlate with Na+ and K+ pumping per se (20, 26).
We recently showed that CS affect intracellular membrane traffic and that this effect is accompanied by numerous changes in subcellular structures: treatment of NT2 cells with CS elicited the appearance of large vesicles and dark structures adjacent to the nucleus (18). The nature of the vesicles was studied, and the mechanisms of their production were elucidated (27). In the present investigation we focus on the dark structures emerging following CS treatment and show that these structures are novel, high density glycogen-microtubule granules. The mechanism underlying the formation of the granules involves activation of the MAPK signaling pathway following CS-Na+,K+-ATPase interaction.
EXPERIMENTAL PROCEDURES
Reagents and Antibodies
Bufalin, digoxin, ouabain, digoxigenin, ouabagenin, nocodazole, periodic acid-Schiff (PAS) reagent, and monoclonal anti-α-tubulin clone B-51-2 antibody were purchased from Sigma-Aldrich. Rabbit monoclonal anti-glycogen synthase (15B1) antibody, Mouse monoclonal anti-phospho-p44/42 MAPK (Thr202/Tyr204) E10 antibody, and U0126 were purchased from Cell Signaling Technology. All fluorescence probes were purchased from Molecular Probes. Polyclonal Cy5-conjugated AffiniPure F(ab)2 fragment goat anti-rabbit IgG, polyclonal Cy5-conjugated AffiniPure F(ab)2 fragment goat anti-mouse IgG, and peroxidase-conjugated F(ab)2 fragment goat anti-mouse IgG were purchased from Jackson ImmunoResearch Laboratories. The SV total RNA isolation system, the reverse transcriptional system, GoTaq DNA polymerase, pCineo, and the psiSTRIKE U6 cloning system were acquired from Promega. ECL kits were obtained from Pierce. The FuGENE 6 transfection reagent was provided by Roche Diagnostics. Serum, cell culture medium, and antibiotics were provided by Biological Industries.
Cell Culture
NT2 cells (human neuronal precursor cells) and ACHN cells (human renal cell adenocarcinoma) were purchased from ATCC. The cells were cultured in T25 tissue culture flasks in DMEM-F12 medium supplemented with 2 mm glutamine, 10% fetal bovine serum, 100 units/ml penicillin, and 100 μg/ml streptomycin at 5% CO2 in 37 °C, as described previously (18). For fluorescence microscopy analysis, the cells were grown on glass coverslips mounted with neutral contact glue on a 1.4 × 2.4-cm aperture in the center of 35-mm dishes, 24–48 h before the experiments. For transfection, NT2 cells were plated in 35-mm tissue culture plates at 105 cells/plate and transfected with 1 μg of plasmid DNA using the FuGENE 6 transfection reagent (reagent:DNA ratio 3:1), according to the manufacturer's instructions.
PAS Staining
Cells were grown on glass coverslips for 24 h and then incubated under various experimental conditions. Incubation was terminated by washing the cells three times with phosphate-buffered saline (PBS). Cell fixation and PAS staining were performed according to the manufacturer's instructions. In brief, the cells were then fixed with PBS containing 10% formaldehyde in 85% ethanol for 15 min at room temperature and incubated in 0.5% PAS solution for 5 min at room temperature. Subsequently, the cells were rinsed in water and incubated with Schiff reagent for 15 min at room temperature, rinsed in running tap water for 2 min, and examined under a microscope. Differential interference contrast images were acquired using a Carl Zeiss AxioLab microscope equipped with an A-plan 40×/0.65 ph2 objective equipped with a MicroPublisher 5.0 RTV camera.
Immunodetection of α-Tubulin, Glycogen Synthase, and Phospho-ERK1/2 Proteins
For detection of tubulin and glycogen synthase, the cells were grown on glass coverslips for 24 h and then incubated under various experimental conditions. Incubation was terminated by fixing cells with PBS containing 1.5% glutaraldehyde and 13% sucrose for 15 min at room temperature. After rinsing three times with PBS, the cells were incubated in PBS containing 0.5% sodium borohydride for 5 min at room temperature and washed three times with PBS, once with PBS containing 0.015% saponin, and incubated for 1 h at room temperature in PBS containing 0.015% saponin and 1% BSA. Samples were then incubated with primary antibody (anti-tubulin 1:2000; anti-glycogen synthase 1:75) at 4 °C for 36 h followed by incubation with secondary antibody (1:150) at room temperature for 2 h. After rinsing with PBS, the plates were examined under a fluorescence microscope (18).
Cell phospho-ERK1/2 was determined by immunoblotting, as described previously. Briefly, cells were grown in 100-mm dishes to 80% confluence and then incubated in medium containing 1% serum for 18 h. The medium was then replaced with fresh medium (1% serum) and CS for 5, 10, and 15 min at 37 °C. Then the cells were washed with ice-cold PBS, incubated with 500 μl of 1.5× SDS loading buffer (93.5 mm Tris-HCl, pH 6.8, at 25 °C), 3% (w/v) SDS, 15% glycerol, and 0.015% (w/v) bromphenol blue, 62.5 mm dithiothreitol (DTT)), immediately scraped off the plates, and transferred to a microcentrifuge tube at 4 °C. The lysate was sonicated for 30 s, heated to 95–100 °C for 5 min, cooled on ice, and microcentrifuged for 2 min. The supernatant was loaded onto a SDS-polyacrylamide gel and subjected to Western blot analysis (14).
Fluorescence Microscopy
Fluorescence microscopy experiments were performed as previously described (27). In brief, microscopy was performed using an Axiovert 200 microscope fitted with a 63XLD Achroplan 0.75NA Korr Ph2, X63 or an X100 1.3NA Neofluar Ph3 objective (Carl Zeiss). An HBO 100 mercury lamp with a short pass excitation filter was used at 488 nm for GFP, at 530 nm for Cy3, and a long pass filter was used at 630 nm for Cy5. Images were acquired with a cooled SensiCAM charge-coupled device camera and analyzed using IP Plus 4.1 version (Signal Analytics) software. Unlabeled cells were used to determine autofluorescence. The image background was corrected as follows: two or three regions were selected from cell-free areas in each field, and the average intensity of these regions was considered the background value for that field. This value was then subtracted from each pixel in the field. Images were saved in TIFF format and transferred to Adobe Photoshop, version CS3 software, for printing.
Electron Microscopy
Electron microscopy analysis was performed as described previously (28) with several modifications: NT2 cells were grown on ACLAR embedding film in 35-mm plates for 2 days. They were then incubated for 4.5 h with 20 nm bufalin and fixed in 2.5% glutaraldehyde plus 2% formaldehyde in 0.1 m sodium cacodylate, pH 7.4, and 13% sucrose for 1 h at room temperature. Samples were washed four times (10 min each) in 0.1 m sodium cacodylate, pH 7.4, and incubated in the same buffer overnight at 4 °C. Subsequently, the cells were incubated for 1 h at room temperature in osmium tetroxide solution (1% OsO4, 1.5% K3Fe(CN)6, 0.1 m sodium cacodylate, pH 7.4). The samples were then washed four times (10 min each) in sodium cacodylate, pH 7.4, and dehydrated by sequential incubation in 30, 50, 70, 90, and 95% ethanol (10 min each), followed by three washes (30 min each) in 100% ethanol. The dehydrated samples were then incubated overnight at 4 °C in 50% agar 100 resin in ethanol, transferred to room temperature, and incubated in open jars for 8 h to evaporate the ethanol. The samples were polymerized for 2 days at 60 °C in a dry oven, and then 70–90 nm thin sections were made, using a LKB-3 ultra microtome. Sections were collected, picked up on 200-mesh thin bar copper grids, stained with uranyl acetate and lead citrate, and observed under an electron microscope (Philips Tecnai 12 TEM) equipped with a Mega-View II CCD camera, and analySIS version 3.0 software (Soft Imaging System).
Construction and Transient Transfection of shRNA Expression Vectors
α1 Na+,K+-ATPase siRNA-specific sequences were determined using the SiRNA Target Designer program (Promega). The sequences A4-ATP1A1, 5′-GGTCGTCTGATCTTTGATA-3′; scrambled A4-ATP1A1, 5′-GGCACATATGTTGGTTCTT-3′; and A5-ATP1A1, 5′-GCAAGCTGCTGACATGATTCT-3′ were synthesized, annealed to their complementary oligonucleotides, and then cloned into the psiSTRIKE U6 vector, according to the manufacturer's instructions. Positive clones were confirmed by nucleotide sequencing. NT2 cells were grown in 35-mm dishes for 24 h to 60–80% confluence. A transfection mixture containing 1 μg of plasmid, 3 μl of FuGENE 6 and 100 μl of DMEM-F12 medium was diluted into the growth media and added to each dish. After a 24-h incubation at 5% CO2 at 37 °C the cells were split 1:3 by trypsinization, replated, and incubated for an additional 24 h. Bufalin was then added (5 nm), and unstained images were acquired after 4.5 h, using an Olympus CK40 inverted microscope equipped with a 40XPh2 0.55 NA LWD CD plane 40 FPL objective. The percentage of cells with dark structures was counted. Transfection efficiency was 35–45%, as determined by a parallel transfection with the EGFP reporter gene.
RT-PCR Analysis
Total RNA was extracted from NT2 cells and used for RT-PCR according to a protocol described previously (27). Gene-specific primers used for the α1 Na+,K+-ATPase isoform were 5′-TGTACCTGGGTGTGGTGCTA-3′ and 5′-GTTATCCACCTTGCAGCCAT-3′, and for actin 5′-CGGATGTCCACGTCACACTT-3′ and 5′-CACCCACACTGTGCCCATCTAC-3′. One μg of total RNA was used for reverse transcription in a 20-μl reaction mix. The amplification profile involved denaturation at 93 °C for 1 min, primer annealing at 60 °C for 1 min, and extension at 72 °C for 1 min. This cycle was repeated 30 times. The PCR products were separated on agarose gel (27).
Data Analysis
Quantitative data in Figs. 2, 8, 9, and 10 represent the average ± S.D. of at least three experiments. Images that were obtained using phase, fluorescence, or electron microscopy throughout this report are representative of at least 10 images and three independent experiments.
FIGURE 2.
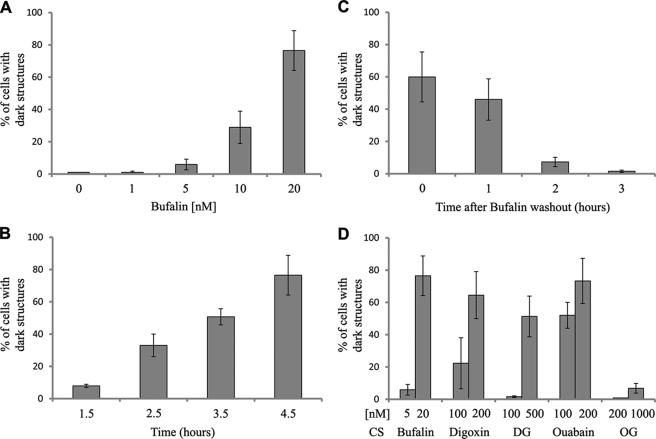
Basic characteristics of bufalin-induced formation of dark structures. NT2 cells were grown, treated with CS, and photographed without staining as described in Fig. 1. The dose dependence of bufalin-induced dark structure formation was tested after 4.5 h incubation (A), time dependence in the presence of 20 nm bufalin (B). In the reversibility experiments, cells were incubated in the presence of 20 nm bufalin for 4.5 h followed by washout (time 0) and in the absence of the steroid (C). The effect of various CS on the formation of dark structures is depicted in D. Cells containing dark structures were counted in populations of >300 cells. DG, digoxigenin; OG, ouabagenin. Each bar represents the average ± S.D. of at least four experiments.
FIGURE 8.
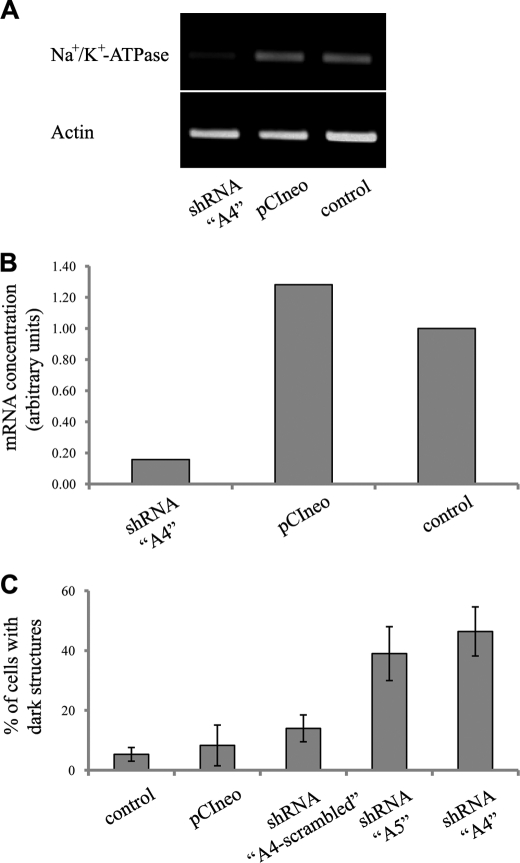
Effect of transfection with α1 Na+,K+-ATPase shRNA expression vectors on bufalin-induced formation of dark structures. NT2 cell growth and transfection were performed as described under “Experimental Procedures.” Semiquantitative RT-PCR analysis of α1 Na+,K+-ATPase and actin mRNAs performed on RNA extracted from control mock transfected, control pCIneo, and shRNA “A4” plasmids is shown in A and its quantification in B. The effects of 5 nm bufalin on the percentage of cells with dark structures in cells transfected with shRNA A4, shRNA A5, shRNA A4-scrambled, pCIneo, and FuGENE 6 reagent alone are shown in C. Cells containing dark structures were counted in populations of >300 cells. Each bar represents the average ± S.D. of at least three experiments.
FIGURE 9.
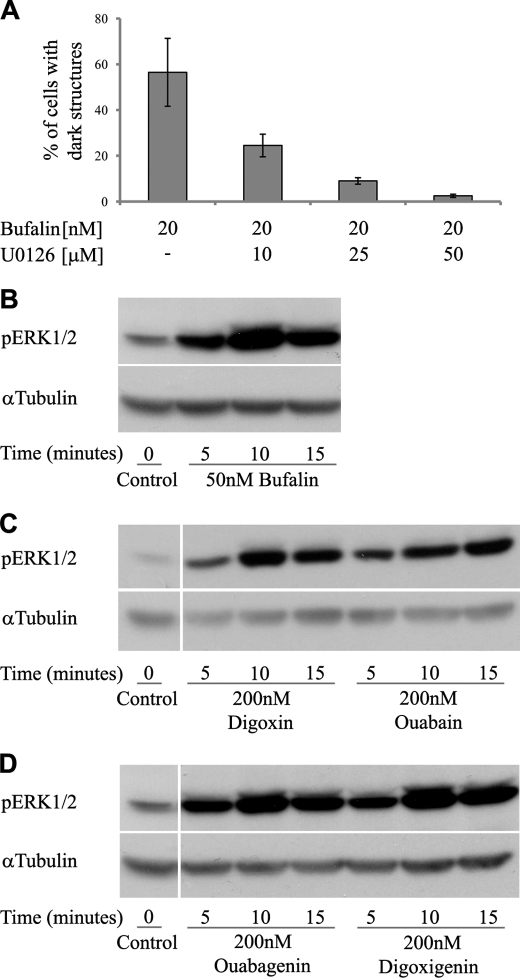
Involvement of ERK1/2 phosphorylation in bufalin-induced formation of dark structures. NT2 cell growth, visualization of dark structures, and Western blot analysis were performed as described under “Experimental Procedures.” The effect of U0126, a specific ERK1/2 inhibitor, on bufalin-induced formation of dark structures is shown in A. The cells were preincubated with various concentration of the inhibitor for 1 h before the addition of bufalin; images were acquired 4.5 h later. The time dependence of the effect of different CS on ERK1/2 phosphorylation is depicted in B–D.
FIGURE 10.
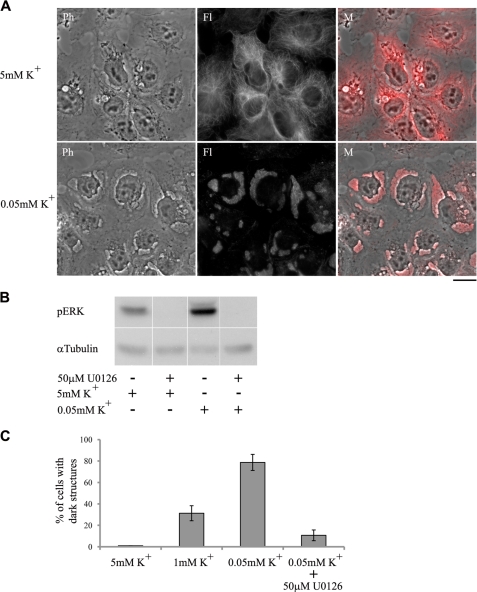
Effect of low extracellular K+ on the formation of dark structures and ERK1/2 phosphorylation. NT2 cell growth, visualization of dark structures, and Western blot analysis were performed as described under “Experimental Procedures.” The cells were incubated in medium containing 1% serum. After 15 h the medium was removed and replaced with medium lacking K+ and containing 1% serum. The lowest final K+ concentration was 0.05 mm K+. After a 1-h incubation and following fixation and immunostaining, images were acquired using a fluorescent microscope (A). Images of control cells are shown in the upper panels. Ph, phase microscopy; Fl, fluorescence microscopy; M, merged images. The ERK1/2 inhibitor U0126 inhibited the low K+-induced ERK1/2 phosphorylation (B) and dark structure formation (C). In the phosphorylation experiments, cells were incubated for 5 min in K+-free medium before protein extraction. Cells containing dark structures were counted in populations of >300 cells. Each bar represents the average ± S.D. of at least three experiments.
RESULTS
CS-induced Morphological Changes in NT2 and ACHN Cells
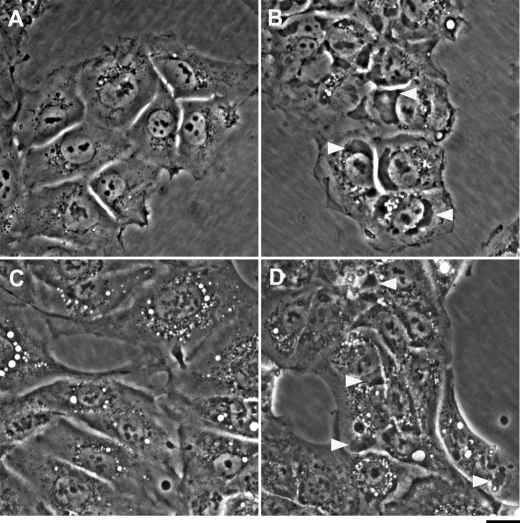
In the course of investigating the physiological and pharmacological effects of CS, we observed, using phase-contrast light microscopy, that the addition of CS to human neuronal progenitor NT2 cells induced the appearance of large vesicles (depicted as white spots), adjacent to the nucleus (Fig. 1B). We characterized these vesicles as the recycling late endosomes and explored the mechanisms involved in their assembly (18, 27). The experiments also revealed that in addition to these vesicles, CS caused the generation of dark, large and asymmetrical structures that too are adjacent to the nucleus. An example of the effect of 20 nm bufalin is shown in Fig. 1B. Such structures are not seen in the control cells (Fig. 1A).
FIGURE 1.
Effect of bufalin on the formation of dark structures. NT2 (A and B) and ACHN (C and D) cells were grown in DMEM-F12 medium containing 10% FCS. Bufalin was added to a final concentration of 20 nm (B and D). Images were acquired without staining 4.5 h after introduction of the drug with the aid of an Olympus CK40 inverted microscope equipped with a 40XPh2 0.55 NA LWD CD plane 40 FPL objective. Scale bar, 20 μm. Two major structural changes are evident: the appearance of vesicles (seen as white drops) and large dark structures (marked by white arrowheads).
The effect of bufalin, tested following a 4.5-h incubation on the formation of the dark structures, depends on the concentration of the steroid (Fig. 2A). Under these conditions, dark structures were already evident at 5 nm steroid, and the maximal number of cells containing dark structures was reached at 20 nm. The bufalin-induced effect was time-dependent (Fig. 2B). At 20 nm, a significant number of cells containing dark structures was observed after a 1.5-h incubation, plateauing at 4.5 h. At 5 nm bufalin, a similar maximal effect and plateau were reached after 24 h of incubation (data not shown). The presence of the dark structures depends on the continuous presence of the steroid. As shown in Fig. 2C, 2 h following removal of the steroid, >90% of the dark structures disappeared, indicating the reversibility of the process.
A comparison between different CS in their ability to induce the formation of the dark structures is shown in Fig. 2D. The potency of the various steroids was examined following incubation of the cells with the steroid for 4.5 h. Bufadienolide bufalin was found to be the most potent inducer of the dark structures (maximal effect at 20 nm). The two cardenolides, ouabain and digoxin, showed a similar efficiency, which is about 10 times lower than that of bufalin. Surprisingly, the ouabain aglycone, ouabagenin did not induce the formation of the dark structures, even at 1 μm (Fig. 2D). The absence of the ouabagenin effect was evident even when the cells were incubated for 24 h with the steroid (data not shown). The digoxin aglycogen, digoxigenin, however, did induce dark structure formation, with a maximal effect at 500 nm (Fig. 2D). These results show that the ability of different CS to induce the formation of the dark structure does not correlate with their ability to inhibit Na+,K+-ATPase activity.
The formation of dark structures by CS is not restricted to NT2 cells. Similar structures were observed in human renal carcinoma ACHN cells (Fig. 1D). However, CS failed to induce the formation of such dark structures in human neuroblastoma SH-SY5Y and HeLa cells.
Bufalin-induced Dark Structures Are Composed of Glycogen, Which Is Redistributed in Cell
We previously established that bufalin affects endocytosed membrane traffic (18). Hence, the direct working hypothesis was that the CS-induced dark structures are related to this process and are derived from membrane compartments. We therefore tested the possible presence of specific marker of different membrane components in the CS-induced dark structures. Our results unequivocally nullify this hypothesis. Markers of Golgi apparatus and endoplasmic reticulum are not present in the dark structures (see supplemental Figs. S1 and S2). Similar results were obtained with markers for components of lysosome and the plasma membrane (data not shown).
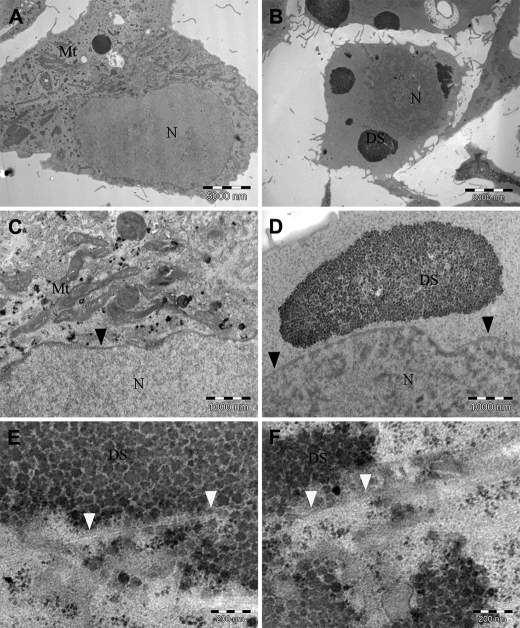
To elucidate the nature of the CS-induced dark structures we resorted to basic electron microscopy (EM) analysis of 20 nm bufalin-treated cells. The nucleus, nuclear membrane, mitochondria, and ribosomes are clearly evident in the control cells (Fig. 3, A and C). The bufalin-treated cells (Fig. 3, B and D–F) contain membrane-free clusters of large number of symmetrical granules, adjacent to the nucleus membrane. Importantly, the observed structures are typical of glycogen granules. As seen in Fig. 3, E and F, high magnification analysis revealed bright fiber-like structures embedded in the glycogen clusters.
FIGURE 3.
Electron micrographic analysis of the bufalin-induced dark structure. Electron microscopy experiments were performed on control (A and C) and bufalin-treated (B and D–F) NT2 cells, as described under “Experimental Procedures.” Low magnification of the images (scale bars, 5000 nm) is seen in A and B. C and D depict the images at higher magnification (scale bars, 1000 nm), and E and F depict the highest magnification (scale bars, 200 nm). Mitochondria (Mt), nucleus (N), and the dark structures (DS) are marked. The black arrowheads points to the nuclear membrane; the white arrowheads point to bright fiber-like structures.
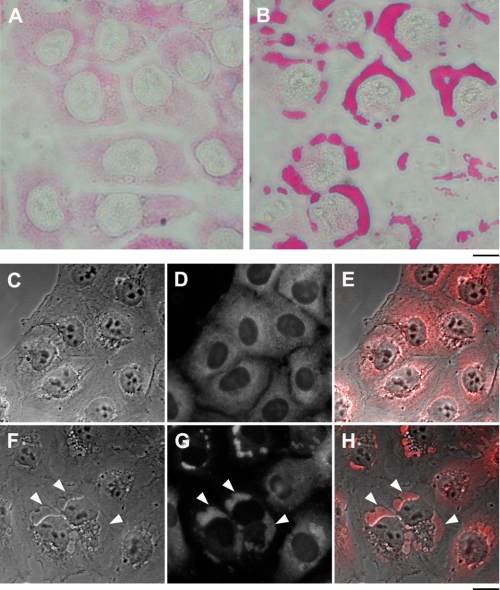
To verify that the structures are composed of glycogen, sugar-specific PAS histological staining was performed. As shown in Fig. 4, A and B, the addition of 20 nm bufalin to NT2 cells induced a marked increase in PAS staining, all of which was concentrated inside the dark structures, confirming the glycogen nature of the granules. Immunofluorescence (IF) analysis of glycogen synthase distribution in the control and bufalin-treated cells confirmed this conclusion. As seen in Fig. 4, C–H, in the control cells glycogen synthase, known to be tightly bound to glycogen, is spread throughout the cytoplasm, whereas in the bufalin-treated cells almost all of the enzyme is concentrated in the dark structures. Similarly, IF staining for glycogen synthase of the bufalin-induced dark structures in ACHN cells also revealed their glycogen nature (see supplemental Fig. S3).
FIGURE 4.
Effect of bufalin on glycogen and glycogen synthase localization. The experiments were conducted as described in the legend to Fig. 1. A and B, PAS histological staining of control NT2 cells (A) and bufalin-treated cells (B) is shown. C–H, immunostaining of glycogen synthase was performed on NT2 cells grown in DMEM-F12 medium on glass coverslips for 24 h. The DMEM-F12 was then replaced with medium with (F–H) or without (C–E) 20 nm bufalin for 4.5 h. The cells were fixed with 1.5% glutaraldehyde and stained with anti-glycogen synthase rabbit monoclonal antibodies, and images were acquired. C and F, phase microscopy. D and G, fluorescence microscopy. E and H, merged phase-contrast and fluorescence images. The white arrowheads point to the dark structures. Scale bars, 40 μm (A and B) and 20 μm (C–H).
A conceivable possibility is that the CS-induced formation of the glycogen granules is associated with changes in glycogen metabolism. Accordingly, changes in the rate of glycogen biosynthesis and degradation in NT2 cells were measured in the presence and absence of bufalin. This was performed using an established methodology based on the incorporation of 14C-labeled glucose into glycogen. The experiments showed that bufalin did not affect glycogen synthesis and degradation (see supplemental Fig. S4), suggesting that the glycogen clusters result from redistribution of the cytoplasmic glycogen granules and not from de novo synthesis of glycogen.
Bufalin-induced Dark Structures Are also Composed of Distorted Microtubules
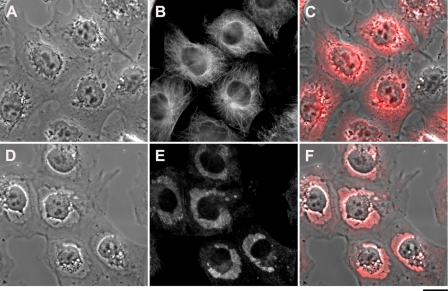
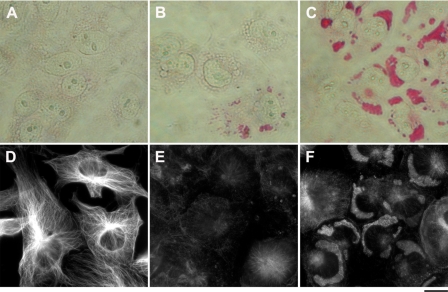
The dramatic changes in glycogen redistribution in the cells and the crucial role of the cytoskeleton in shaping overall cellular structure, prompted us to examine possible changes in the microtubule network following CS treatment. This was analyzed by IF, using specific anti-tubulin antibodies. As shown in Fig. 5, E and F, the addition of 20 nm bufalin to NT2 cells caused a substantial distortion of the microtubule network, resulting in the condensation of a significant portion of the IF signal in the glycogen-containing clusters.
FIGURE 5.
Effect of bufalin on tubulin localization. The experiments were conducted as described in the legend to Fig. 1. Immunostaining of tubulin was performed on NT2 cells grown in DMEM-F12 on glass coverslips for 24 h. The DMEM-F12 was then replaced with medium with (D–F) or without (A–C) 20 nm bufalin for 4.5 h. The cells were fixed with 1.5% glutaraldehyde and stained with anti α-tubulin monoclonal antibodies, and images were acquired. A and D, phase microscopy; B and E, fluorescence microscopy; C and F, merged phase-contrast and fluorescence. Scale bar, 20 μm.
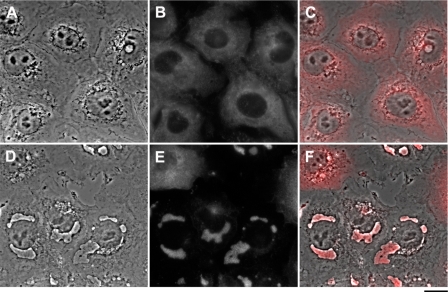
Co-localization of the CS-induced glycogen granules with the distorted microtubules suggested a common mechanism or dependence in their relocation in the cells. To explore this issue, we examined the effect of bufalin on microtubule distortion in cells depleted of glycogen and on the formation of glycogen clusters in cells with a depolymerized microtubule network. Glycogen depletion was achieved by growing the cells for 5 generations at low (0.3 mm) glucose concentrations. This treatment dramatically reduced the glycogen levels in the cells (Fig. 6, A and B). Importantly, however, the microtubule network was not affected by this growth condition (Fig. 6D). Under these conditions, as expected, the addition of bufalin did not induce the formation of glycogen clusters (Fig. 6B). Nevertheless, the microtubule network was severely distorted throughout the cell (Fig. 6E). These results clearly indicate the independence of the effect of bufalin on microtubules from that on glycogen redistribution. A simultaneously conducted positive control Fig. 6, C and F, shows typical bufalin-induced increases in PAS staining and tubulin accumulation. The effect of changes in microtubule integrity on the bufalin-induced effect on glycogen clustering was examined using the antineoplastic drug nocodazole, which is known to interfere with the polymerization of microtubules and causes their distortion. The addition of 500 nm nocodazole to NT2 cells resulted in the disappearance of the microtubule network within 1.5 h and the appearance of scattered microtubule staining throughout the cytoplasm (Fig. 7B). The addition of bufalin following nocodazole treatment caused the appearance of the dark structures (Fig. 7D) and the accumulation of the distorted tubulin in the glycogen clusters (Fig. 7E). These results indicate that the bufalin-induced relocation of glycogen is independent of the integrity of the tubulin network.
FIGURE 6.
Effect of bufalin on tubulin distortion in glycogen-depleted cells. NT2 cells were grown as described in the legend to Fig. 1, C and F, or in the presence of 0.3 mm glucose for five generations (A, B, D, and E). PAS staining (A–C) was performed as described under “Experimental Procedures”; immunostaining of tubulin was as described in the legend to Fig. 5, D–F. Cells were treated with 20 nm bufalin (B, C, E, and F) or without the steroid (A and D) for 4.5 h. A–C, differential interference contrast microscopy images; D–F, fluorescence microscopy images. Scale bar, 20 μm.
FIGURE 7.
Effect of nocodazole on bufalin-induced tubulin distortion. NT2 cells were grown as described in the legend of Fig. 1. Immunostaining of tubulin was performed as described in the legend to Fig. 5. The cell medium was replaced with medium containing nocodazole (500 nm) and 1.5 h later 20 nm bufalin (D–F) with or without the steroid (A–C) was added for 4.5 h. The cells were fixed with 1.5% glutaraldehyde and stained with anti-α-tubulin monoclonal antibodies, and images were acquired. A and D, phase microscopy; B and E, fluorescence microscopy; C and F, merged phase contrast and fluorescence images. Scale bar, 20 μm.
CS-Na+,K+-ATPase-induced ERK1/2 Phosphorylation Is Essential but Not Sufficient for CS-induced Formation of Glycogen-Microtubule Clusters
The only established receptor for CS is the Na+,K+-ATPase (2, 6). Hence, it was expected that the relative potency of the different CS in inducing the formation of the glycogen-microtubule clusters would correlate with the ability of the steroids to bind to the Na+,K+-ATPase. Surprisingly, however, as shown in Fig. 2D, dramatic differences were revealed in the ability of different CS to induce the glycogen-microtubule clusters (see above). This raised the question as to the participation of Na+,K+-ATPase in CS-induced cluster formation. To test this issue, we utilized a genetic approach, down-regulating Na+,K+-ATPase mRNA, using shRNA. These experiments are depicted in Fig. 8. Transfection of NT2 cells with specific shRNA, designated A4 (29), caused a specific down-regulation of α1 Na+,K+-ATPase mRNA (Fig. 8, A and B). This transfection caused a significant increase in the extent of the bufalin-induced formation of the glycogen-microtubule clusters (Fig. 8C): whereas 5 nm bufalin treatment for 4.5 h induced a marginal increase in the number of dark structures (see also Fig. 2), it induced a >50% effect in the A4-transfected cells. Similar results were obtained using shRNA against different sequence of the α1 within the open reading frame (designated A5), demonstrating the specificity of the effect. Control experiments using shRNA against the A4 scrambled sequence, pCineo empty vector, and mock transfection (Fig. 8C) did not have a significant effect on the CS-induced formation of the glycogen-microtubule clusters. These experiments attest to the involvement of Na+,K+-ATPase in mediating the CS-induced granule formation.
As described in the Introduction, CS-induced activation of intracellular signaling pathways has been shown to be involved in CS-induced biological responses. We therefore examined the possibility that similar mechanisms are involved in the CS-induced cluster formation. To this end, we first tested the effect of a specific inhibitor of ERK1/2 activity, U0126, on the CS-induced formation of the glycogen-microtubule clusters. As shown in Fig. 9A, pretreatment of NT2 cells with the inhibitor attenuated, in a dose-dependent manner, the appearance of the CS-induced clusters. At 50 μm, the inhibitor completely abolished their appearance. These results support the involvement of the ERK1/2 signaling pathway in the newly described phenomenon. Direct measurements of CS-induced ERK1/2 phosphorylation also support this notion. As shown in Fig. 9B, the addition of bufalin to NT2 cells induced ERK1/2 phosphorylation, both rapidly and transiently. CS-induced phosphorylation of ERK1/2 was detected within 5 min of incubation, peaking after 10 min (Fig. 9B). Similar results were obtained with other CS such as digoxin and ouabain (Fig. 9C). Digoxigenin and ouabagenin, which did not induce the formation of the glycogen-microtubule clusters at 200 nm, caused marked ERK1/2 phosphorylation at this concentration (Fig. 9D), indicating a complex relationship between ERK1/2 phosphorylation and glycogen-microtubule cluster formation (see “Discussion”).
The molecular nature of CS-induced protein phosphorylation is not completely understood. It was suggested that Na+,K+-ATPase at the E2 conformational state is responsible for the activation of molecular cascades by CS (30). This hypothesis prompted us to examine the effect of low [K+], a perturbation that fixes Na+,K+-ATPase in the E2 state, on the formation of the glycogen-microtubule clusters. These experiments are depicted in Fig. 10. Incubation of NT2 cells in media containing low (1 mm) or no K+ caused the appearance of the glycogen-microtubule clusters within 1 h. Furthermore, the specific ERK1/2 inhibitor U0126 significantly inhibited this phenomenon. In addition, in agreement with previous study (30), exposure of the cells to low K+ caused, within several minutes, a marked increase in the phosphorylation of ERK1/2 (Fig. 10).
Hypoxia-induced Glycogen Clusters in NT2 Cells
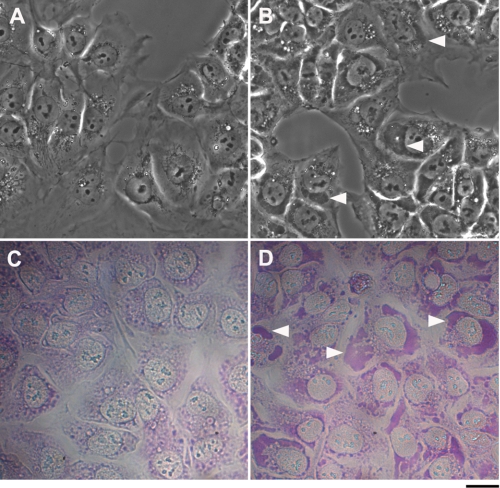
The data, presented above pertaining to the induction of glycogen clusters by CS and low K, suggested that this phenomenon may be related to a more general cellular stress response. If so, we predicted that other stress stimuli would induce a similar effect. To test this hypothesis, we exposed NT2 cells to a low media O2 concentration (hypoxia) of 1% O2 and 5% CO2 at 37 °C for 24 h. As shown in Fig. 11, such treatment induced the appearance of glycogen clusters, as seen under phase-contrast light microscopy, as well as by PAS histological staining.
FIGURE 11.
Effect of hypoxia on the formation of dark structures. NT2 cells were grown in DMEM-F12 medium containing 10% FCS at 5% CO2 and 20% (A and C) or 1% (B and D) O2 at 37 °C. Images were acquired as described under “Experimental Procedures” without staining (A and B) or after PAS histological staining (C and D) 24 h after introduction to hypoxic condition. White arrowheads point to the dark structures. Scale bar, 20 μm.
DISCUSSION
Besides increasing the force of contraction of heart muscle, CS exert numerous pleiotropic effects in various tissues. These compounds were shown to affect viability, growth, and differentiation of several cell types, sodium excretion by the kidney, lung liquid clearance, regulation of systemic blood pressure, and behavior (for review, see Refs. 8, 9, 11, 31). At the molecular level, in addition to inhibiting the activity of the Na+,K+-ATPase, CS-Na+,K+-ATPase interactions were shown to induce the activation of several signal transduction pathways (15, 26), suppression of cell differentiation by antagonizing RORyt activity (32), inhibition of interferon-β gene expression (33), regulation of the sperm EGF, receptor and initiation of the acrosome reaction (34), up-regulation of nuclear Bcl2 (35), inhibition of hypoxia-inducing factor-1α synthesis (36), and modulation of alternative splicing (37). In the present study we identified a novel CS-induced effect at the cellular level, the formation of new cellular structures. These large dark structures are observed in living cells only under phase microscopy, indicating a composition of organized particles.
A thorough characterization of the CS-induced structures, performed in this study, identified glycogen as their major component (Figs. 3, 4). Glycogen, a carbohydrate consisting of a large number of glucose units joined together by glycosidic bonds, is one of the main readily accessible energy storage compounds in many cell types. Although it is stored in large amounts mainly in liver and skeletal muscle, glycogen synthesis and degradation are central to the metabolism of most living cells (38–40). Cellular storage of these molecules consists of granules that contain not only glycogen but also enzymes involved in its metabolism, such as glycogen synthase and glycogen phosphorylase (40). A large number of glycogen granules have been shown to assemble into larger molecular complexes consisting of clusters or glycogen particles (39). In our study we show that in the presence of CS these granules are relocalized to form a cluster of glycogen-protein complexes. The clusters are not surrounded by membranes and are different from most glycogen complexes described in association with the inherited disorders of glycogen metabolism known as glycogen storage diseases. The CS-induced glycogen clusters resemble, however, structures characteristic of diabetic glycogen nephrosis or Armanni-Ebstein lesions. The lesions are characterized by the accumulation of glycogen particles in the cytoplasm of epithelial cells and can be prevented by insulin treatment (41). Similar glycogen deposits were described also in Tako-Tsubo cardiomyopathy or “transient LV apical ballooning” (42). In this later report, PAS staining revealed large intracytoplasmic areas filled with glycogen in the acute phase of the disease, which were markedly reduced following recovery and completely absent from healthy individuals. Glycogen clusters more similar to those described in our study were demonstrated by PAS staining coupled with ultrastructure analysis in growing colonies of human embryonic stem cells. The structures were detectable throughout colony growth (43). Importantly, none of these reports suggested a function or a mechanism for the induction of these glycogen deposits. In view of previous reports on the effect of CS on glycogen metabolism (22), we tested the possibility that changes in glycogen synthesis and/or breakdown are involved in CS-induced cluster formation. Our results, however, preclude these options (supplemental Fig. S4), indicating that only glycogen redistribution is involved.
The other main component of the CS-induced clusters is distorted microtubules (Fig. 5). Microtubules serve as structural components within cells and are involved in many cellular processes, including mitosis, cytokinesis, and vesicular transport. Although microtubule disassembly was described following pharmacological treatment of cells with microtubule-destabilizing drugs such as nocodazole (44) or sulforaphane (45), CS-induced distortion of these filaments, as observed in our study, has, to the best of our knowledge, never been described before.
In our investigation, CS-induced glycogen cluster formation (supplemental Fig. S3) and tubulin distortion (data not shown) were also seen in human kidney-derived ACHN cells. Other cells such as human renal cell carcinoma 786-O and human ovary cell carcinoma TOV-21G, which also derive from cells rich in glycogen, did not respond in this fashion to CS (data not shown). Thus, a high level of glycogen in the cell is not the cause of glycogen cluster formation.
Our results show unequivocally that CS induction of glycogen-microtubule clusters is mediated by Na+,K+-ATPase, as α1 shRNA clearly influenced this effect (Fig. 8). Furthermore, the partial silencing of the Na+,K+-ATPase (A4- and A5-transfected cells) amplified the response to bufalin. This condition may have caused a state in which the inhibition of even a small fraction of the remaining pumps affects the ionic balance. This suggests that the inhibition of transport and alteration of intracellular ion composition are essential factors in the CS-induced formation of glycogen-microtubule clusters.
A comparison between the effect of different CS revealed that the ouabain aglycone ouabagenin does not induce the formation of the glycogen-microtubule cluster, even at 1 μm (Fig. 2D). Ouabagenin, which binds to Na+,K+-ATPase at very low affinity, is a potent inhibitor of Na+,K+-ATPase activity (46). Hence, the ability of different CS to induce the formation of the glycogen-microtubule clusters correlates with their relative binding affinity but not with their ability to inhibit Na+,K+-ATPase activity. The uniqueness of ouabagenin from other CS was repeatedly documented. For example, Paula et al. have conducted a thorough characterization of CS relative binding and relative inhibitory potencies on lamb kidney isolated Na+,K+-ATPase. This study has demonstrated that although ouabagenin has a reduced binding affinity of >300-fold relative to ouabain, the enzyme inhibition potency was reduced only by approximately 2-fold (46). In addition, the inhibition of Na+,K+-ATPase activity by ouabagenin was found to be the most sensitive to changes in pH compared with other CS (47). Similarly, ouabagenin significantly differed from ouabain in terms of both Na+,K+-ATPase inhibition and cell signaling activation in Madin-Darby canine kidney cells (48). Furthermore, recently, Cornelius et al. characterized the inhibition of Na+,K+-ATPase activity by various metal fluorides and subsequent reactivation by high Na+. They have found that ouabain, but not ouabagenin, prevented this high Na+ reactivation, demonstrating the pivotal role of the sugar moiety in closing the extracellular cation pathway of the enzyme (49). These studies point to a fundamental difference in ouabagenin-Na+,K+-ATPase interactions in regard to binding, inhibition of ion pumping, and activation of signaling pathway which presumably result in the failure of this steroid to induce glycogen-microtubule clusters formation. Our results demonstrate that CS induce a rapid increase in ERK1/2 phosphorylation in NT2 cells. In addition, the highly specific ERK1/2 inhibitor U0126 completely abolished CS-induced formation of the glycogen-microtubule clusters (Fig. 9). Cumulatively, these findings suggest that the activation of the ERK1/2 signal transduction pathway is obligatory for CS-induced formation of the glycogen-microtubule clusters. However, similar activation of ERK1/2 phosphorylation was observed by treatment of NT2 cells with ouabagenin and digoxigenin at concentrations that did not induce the formation of the glycogen-microtubule clusters (Fig. 2). Hence, it may be concluded that although the activation of ERK1/2 signaling is obligatory, it is not sufficient to produce the clusters.
Na+,K+-ATPase is the main transporter of Na+ and K+ ions, and its activity establishes the concentration gradients of these ions across the plasma membrane of all mammalian cells. The activity of Na+,K+-ATPase was described by reaction cycles based on the generally accepted Post-Albers cycle model (50, 51). Na+ ions from the cell interior bind to a high affinity site in the ATPase E1 state. Ion binding triggers phosphorylation of the enzyme by Mg2+-ATP, leading to the phosphorylated E1-P state. In the phosphorylated E2-P state, the Na+,K+-ATPase is unable to phosphorylate ADP, and has a reduced affinity for Na+, which is released to the exterior. K+ ions bound from the outside and, on hydrolysis of the phosphorylated Asp, the enzyme releases K+ to the interior and re-binds Na+. A significant conclusion that may be drawn from the present study is that Na+,K+-ATPase in the E2-P state is the activator of the signaling pathway responsible for glycogen-microtubule cluster formation. This conclusion was drawn from the observation that a reduction in extracellular K+ induced the appearance of the clusters in the absence of CS (Fig. 10). Furthermore, this induction was dependent on the activation of ERK1/2 (Fig. 10). These findings are in accord with the well established notion that CS reduce the rate of dephosphorylation of the Na+,K+-ATPase, thereby increasing the accumulation of the E2-P state in the membrane. Recently, Ye et al. demonstrated that changes in E1/E2 Na/K-ATPase obtained by lowering extracellular K+ induce the activation of ERK1/2 (30). Our results not only confirm this observation, but show that the E2-P-induced activation of the signaling pathway has significant cellular consequences, manifested by the formation of glycogen-microtubule clusters. It is tempting to speculate other perturbations that affect the plasma membrane, causing an increase in the E2 state of the enzyme and resulting in the activation of signaling through the Na+,K+-ATPase.
The CS-induced formation of the glycogen-microtubule granules is a complex process that requires the participation of different signaling pathways. Our results show that ouabagenin does not induce the formation of the clusters, despite its ability to inhibit Na+,K+-ATPase activity (increased E2-P) and increase ERK1/2 phosphorylation (Figs. 2 and 9, respectively). This indicates that these two events are indeed necessary but not sufficient to cause CS-induced formation of the glycogen-microtubule clusters. The identity of the additional molecular participant in this mechanism is not known. In view of the pharmacological profile of the CS-induced glycogen-microtubule cluster formation and the well known diversity of CS actions at the cellular and systemic levels (25), the possibility of the existence of an additional receptor for CS, which is involved in the phenomena described in this study, should also be considered.
In a search for the physiological/pathophysiological relevance of the CS-induced formation of glycogen-microtubule clusters and in view of the reports on such clusters in diabetic glycogen nephrosis, Tako-Tsubo cardiomyopathy, and human embryonic stem cells, we reasoned that the clusters may represent a more general consequence of cellular stress. To test this possibility we investigated the effects of hypoxia, a fundamental stimulus in biology and medicine, on the formation of the glycogen clusters. We indeed discovered that exposure of NT2 cells to hypoxic conditions resulted in the formation of these clusters. Hypoxia changes the expression of about 400 genes, which collectively serve to allow the cell and the tissue in which it resides to adapt to the low oxygen environment (52). Therefore, the elucidation of the molecular mechanisms governing hypoxia-induced glycogen cluster formation presents a complex problem and is now under investigation in our laboratory. Interestingly, it was demonstrated that hypoxia triggers a significant reduction in plasma membrane Na+,K+-ATPase (53) as well as an increase in the release of endogenous CS from the brain and adrenal (54, 55). Furthermore, in the present study we demonstrate that a reduction in Na+,K+-ATPase potentiates CS-induced glycogen formation (Fig. 8). In view of all of these findings, it is tempting to suggest that these changes in the Na+,K+-ATPase/CS system are involved in the hypoxia-induced formation of glycogen clusters.
Supplementary Material
This research was supported by Israel Science Foundation Grant 1246/08.

This article contains supplemental Figs. S1–S4.
- CS
- cardiac steroid(s)
- IF
- immunofluorescence
- PAS
- periodic acid-Schiff.
REFERENCES
- 1. Blanco G., Mercer R. W. (1998) Isozymes of the Na-K-ATPase: heterogeneity in structure, diversity in function. Am. J. Physiol. Renal Physiol. 275, F633–650 [DOI] [PubMed] [Google Scholar]
- 2. Kaplan J. H. (2002) Biochemistry of Na,K-ATPase. Annu. Rev. Biochem. 71, 511–535 [DOI] [PubMed] [Google Scholar]
- 3. Geering K. (2006) FXYD proteins: new regulators of Na-K-ATPase. Am. J. Physiol. Renal Physiol. 290, F241–250 [DOI] [PubMed] [Google Scholar]
- 4. Garty H., Karlish S. J. (2006) Role of FXYD proteins in ion transport. Annu. Rev. Physiol. 68, 431–459 [DOI] [PubMed] [Google Scholar]
- 5. Pressley T. A. (1996) Structure and function of the Na,K pump: Ten years of molecular biology. Miner. Electrolyte Metab. 22, 264–271 [PubMed] [Google Scholar]
- 6. Lingrel J. B. (2010) The physiological significance of the cardiotonic steroid/ouabain-binding site of the Na,K-ATPase. Annu. Rev. Physiol. 72, 395–412 [DOI] [PMC free article] [PubMed] [Google Scholar]
- 7. Kelly R. A., Smith T. W. (1996) Pharmacological Treatment of Heart Failure, 9th Ed., pp. 809–838, McGraw-Hill, New York [Google Scholar]
- 8. Nesher M., Shpolansky U., Rosen H., Lichtstein D. (2007) The digitalis-like steroid hormones: New mechanisms of action and biological significance. Life Sci. 80, 2093–2107 [DOI] [PubMed] [Google Scholar]
- 9. Bagrov A. Y., Shapiro J. I., Fedorova O. V. (2009) Endogenous cardiotonic steroids: physiology, pharmacology, and novel therapeutic targets. Pharmacol. Rev. 61, 9–38 [DOI] [PMC free article] [PubMed] [Google Scholar]
- 10. Blaustein M. P., Hamlyn J. M., Pallone T. L. (2007) Sodium pumps: Ouabain, ion transport, and signaling in hypertension. Am. J. Physiol. Renal Physiol. 293, F438–439 [DOI] [PubMed] [Google Scholar]
- 11. Schoner W., Scheiner-Bobis G. (2007) Endogenous and exogenous cardiac glycosides: Their roles in hypertension, salt metabolism, and cell growth. Am. J. Physiol. Cell Physiol. 293, C509–536 [DOI] [PubMed] [Google Scholar]
- 12. Mijatovic T., Ingrassia L., Facchini V., Kiss R. (2008) Na+/K+-ATPase α subunits as new targets in anticancer therapy. Expert Opin. Ther. Targets 12, 1403–1417 [DOI] [PubMed] [Google Scholar]
- 13. Cannon S. C. (2004) Paying the price at the pump: dystonia from mutations in a Na+/K+ -ATPase. Neuron 43, 153–154 [DOI] [PubMed] [Google Scholar]
- 14. Goldstein I., Levy T., Galili D., Ovadia H., Yirmiya R., Rosen H., Lichtstein D. (2006) Involvement of Na+,K+-ATPase and endogenous digitalis-like compounds in depressive disorders. Biol. Psychiatry 60, 491–499 [DOI] [PubMed] [Google Scholar]
- 15. Liu J., Xie Z. J. (2010) The sodium pump and cardiotonic steroids-induced signal transduction protein kinases and calcium-signaling microdomain in regulation of transporter trafficking. Biochim. Biophys. Acta 1802, 1237–1245 [DOI] [PMC free article] [PubMed] [Google Scholar]
- 16. Aizman O., Uhlén P., Lal M., Brismar H., Aperia A. (2001) Ouabain, a steroid hormone that signals with slow calcium oscillations. Proc. Natl. Acad. Sci. U.S.A. 98, 13420–13424 [DOI] [PMC free article] [PubMed] [Google Scholar]
- 17. Akimova O. A., Poirier M., Kotelevtsev S. V., Hamet P., Orlov S. N. (2008) The death of ouabain-treated renal epithelial cells: evidence against anoikis occurrence. Apoptosis 13, 670–680 [DOI] [PubMed] [Google Scholar]
- 18. Rosen H., Glukhman V., Feldmann T., Fridman E., Lichtstein D. (2004) Cardiac steroids induce changes in recycling of the plasma membrane in human NT2 cells. Mol. Biol. Cell 15, 1044–1054 [DOI] [PMC free article] [PubMed] [Google Scholar]
- 19. Kometiani P., Li J., Gnudi L., Kahn B. B., Askari A., Xie Z. (1998) Multiple signal transduction pathways link Na+/K+-ATPase to growth-related genes in cardiac myocytes: the roles of Ras and mitogen-activated protein kinases. J. Biol. Chem. 273, 15249–15256 [DOI] [PubMed] [Google Scholar]
- 20. Liang M., Tian J., Liu L., Pierre S., Liu J., Shapiro J., Xie Z. J. (2007) Identification of a pool of non-pumping Na/K-ATPase. J. Biol. Chem. 282, 10585–10593 [DOI] [PubMed] [Google Scholar]
- 21. Xie Z., Cai T. (2003) Na+-K+–ATPase-mediated signal transduction: from protein interaction to cellular function. Mol. Interv. 3, 157–168 [DOI] [PubMed] [Google Scholar]
- 22. Kotova O., Al-Khalili L., Talia S., Hooke C., Fedorova O. V., Bagrov A. Y., Chibalin A. V. (2006) Cardiotonic steroids stimulate glycogen synthesis in human skeletal muscle cells via a Src- and ERK1/2-dependent mechanism. J. Biol. Chem. 281, 20085–20094 [DOI] [PubMed] [Google Scholar]
- 23. Tian J., Liu J., Garlid K. D., Shapiro J. I., Xie Z. (2003) Involvement of mitogen-activated protein kinases and reactive oxygen species in the inotropic action of ouabain on cardiac myocytes: a potential role for mitochondrial KATP channels. Mol. Cell. Biochem. 242, 181–187 [PubMed] [Google Scholar]
- 24. Wang Z., Zheng M., Li Z., Li R., Jia L., Xiong X., Southall N., Wang S., Xia M., Austin C. P., Zheng W., Xie Z., Sun Y. (2009) Cardiac glycosides inhibit p53 synthesis by a mechanism relieved by Src or MAPK inhibition. Cancer Res. 69, 6556–6564 [DOI] [PMC free article] [PubMed] [Google Scholar]
- 25. Dvela M., Rosen H., Feldmann T., Nesher M., Lichtstein D. (2007) Diverse biological responses to different cardiotonic steroids. Pathophysiology 14, 159–166 [DOI] [PubMed] [Google Scholar]
- 26. Li J., Khodus G. R., Kruusmagi M., Kamali-Zare P., Liu X. L., Eklof A. C., Zelenin S., Brismar H., Aperia A. (2010) Ouabain protects against adverse developmental programming of the kidney. Nat. Commun. 1, 42. [DOI] [PMC free article] [PubMed] [Google Scholar]
- 27. Feldmann T., Glukmann V., Medvenev E., Shpolansky U., Galili D., Lichtstein D., Rosen H. (2007) Role of endosomal Na+-K+-ATPase and cardiac steroids in the regulation of endocytosis. Am. J. Physiol. Cell Physiol. 293, C885–896 [DOI] [PubMed] [Google Scholar]
- 28. Eyal-Giladi H., Feinstein N., Friedlander M., Raveh D. (1985) Glycogen metabolism and the nuclear envelope-annulate lamella system in the early chick embryo. J. Cell Sci. 73, 399–407 [DOI] [PubMed] [Google Scholar]
- 29. Liang M., Cai T., Tian J., Qu W., Xie Z. J. (2006) Functional characterization of Src-interacting Na/K-ATPase using RNA interference assay. J. Biol. Chem. 281, 19709–19719 [DOI] [PubMed] [Google Scholar]
- 30. Ye Q., Li Z., Tian J., Xie J. X., Liu L., Xie Z. (2011) Identification of a potential receptor that couples ion transport to protein kinase activity. J. Biol. Chem. 286, 6225–6232 [DOI] [PMC free article] [PubMed] [Google Scholar]
- 31. Lecuona E., Trejo H. E., Sznajder J. I. (2007) Regulation of Na,K-ATPase during acute lung injury. J. Bioenerg. Biomembr. 39, 391–395 [DOI] [PubMed] [Google Scholar]
- 32. Huh J. R., Leung M. W., Huang P., Ryan D. A., Krout M. R., Malapaka R. R., Chow J., Manel N., Ciofani M., Kim S. V., Cuesta A., Santori F. R., Lafaille J. J., Xu H. E., Gin D. Y., Rastinejad F., Littman D. R. (2011) Digoxin and its derivatives suppress TH17 cell differentiation by antagonizing RORγt activity. Nature 472, 486–490 [DOI] [PMC free article] [PubMed] [Google Scholar]
- 33. Ye J., Chen S., Maniatis T. (2011) Cardiac glycosides are potent inhibitors of interferon-β gene expression. Nat. Chem. Biol. 7, 25–33 [DOI] [PMC free article] [PubMed] [Google Scholar]
- 34. Daniel L., Etkovitz N., Weiss S. R., Rubinstein S., Ickowicz D., Breitbart H. (2010) Regulation of the sperm EGF receptor by ouabain leads to initiation of the acrosome reaction. Dev. Biol. 344, 650–657 [DOI] [PubMed] [Google Scholar]
- 35. Golden W. C., Martin L. J. (2006) Low dose ouabain protects against excitotoxic apoptosis and up-regulates nuclear Bcl-2 in vivo. Neuroscience 137, 133–144 [DOI] [PubMed] [Google Scholar]
- 36. Zhang H., Qian D. Z., Tan Y. S., Lee K., Gao P., Ren Y. R., Rey S., Hammers H., Chang D., Pili R., Dang C. V., Liu J. O., Semenza G. L. (2008) Digoxin and other cardiac glycosides inhibit HIF-1α synthesis and block tumor growth. Proc. Natl. Acad. Sci. U.S.A. 105, 19579–19586 [DOI] [PMC free article] [PubMed] [Google Scholar]
- 37. Stoilov P., Lin C. H., Damoiseaux R., Nikolic J., Black D. L. (2008) A high throughput screening strategy identifies cardiotonic steroids as alternative splicing modulators. Proc. Natl. Acad. Sci. U.S.A. 105, 11218–11223 [DOI] [PMC free article] [PubMed] [Google Scholar]
- 38. Greenberg C. C., Jurczak M. J., Danos A. M., Brady M. J. (2006) Glycogen branches out: new perspectives on the role of glycogen metabolism in the integration of metabolic pathways. Am. J. Physiol. Endocrinol. Metab. 291, E1–8 [DOI] [PubMed] [Google Scholar]
- 39. Rybicka K. K. (1996) Glycosomes: the organelles of glycogen metabolism. Tissue Cell 28, 253–265 [DOI] [PubMed] [Google Scholar]
- 40. Shearer J., Graham T. E. (2002) New perspectives on the storage and organization of muscle glycogen. Can J. Appl. Physiol. 27, 179–203 [DOI] [PubMed] [Google Scholar]
- 41. Bamri-Ezzine S., Ao Z. J., Londoño I., Gingras D., Bendayan M. (2003) Apoptosis of tubular epithelial cells in glycogen nephrosis during diabetes. Lab. Invest. 83, 1069–1080 [DOI] [PubMed] [Google Scholar]
- 42. Nef H. M., Möllmann H., Kostin S., Troidl C., Voss S., Weber M., Dill T., Rolf A., Brandt R., Hamm C. W., Elsässer A. (2007) Tako-Tsubo cardiomyopathy: intraindividual structural analysis in the acute phase and after functional recovery. Eur. Heart J. 28, 2456–2464 [DOI] [PubMed] [Google Scholar]
- 43. Johkura K., Cui L., Asanuma K., Okouchi Y., Ogiwara N., Sasaki K. (2004) Cytochemical and ultrastructural characterization of growing colonies of human embryonic stem cells. J. Anat. 205, 247–255 [DOI] [PMC free article] [PubMed] [Google Scholar]
- 44. Birukova A. A., Birukov K. G., Gorshkov B., Liu F., Garcia J. G., Verin A. D. (2005) MAP kinases in lung endothelial permeability induced by microtubule disassembly. Am. J. Physiol. Lung Cell Mol. Physiol. 289, L75–84 [DOI] [PubMed] [Google Scholar]
- 45. Azarenko O., Okouneva T., Singletary K. W., Jordan M. A., Wilson L. (2008) Suppression of microtubule dynamic instability and turnover in MCF7 breast cancer cells by sulforaphane. Carcinogenesis 29, 2360–2368 [DOI] [PMC free article] [PubMed] [Google Scholar]
- 46. Paula S., Tabet M. R., Ball W. J., Jr. (2005) Interactions between cardiac glycosides and sodium/potassium-ATPase: three-dimensional structure-activity relationship models for ligand binding to the E2-Pi form of the enzyme versus activity inhibition. Biochemistry 44, 498–510 [DOI] [PubMed] [Google Scholar]
- 47. Cornelius F., Mahmmoud Y. A. (2009) Interaction between cardiotonic steroids and Na,K-ATPase. Effects of pH and ouabain-induced changes in enzyme conformation. Biochemistry 48, 10056–10065 [DOI] [PubMed] [Google Scholar]
- 48. Valente R. C., Capella L. S., Oliveira M. M., Nunes-Lima L. T., Cruz F. C., Palmieri R. R., Lopes A. G., Capella M. A. (2010) Diverse actions of ouabain and its aglycone ouabagenin in renal cells. Cell Biol. Toxicol. 26, 201–213 [DOI] [PubMed] [Google Scholar]
- 49. Cornelius F., Mahmmoud Y. A., Toyoshima C. (2011) Metal fluoride complexes of Na,K-ATPase: characterization of fluoride-stabilized phosphoenzyme analogues and their interaction with cardiotonic steroids. J. Biol. Chem. 286, 29882–29892 [DOI] [PMC free article] [PubMed] [Google Scholar]
- 50. Post R. L., Hegyvary C., Kume S. (1972) Activation by adenosine triphosphate in the phosphorylation kinetics of sodium and potassium ion transport adenosine triphosphatase. J. Biol. Chem. 247, 6530–6540 [PubMed] [Google Scholar]
- 51. Albers R. W. (1967) Biochemical aspects of active transport. Annu. Rev. Biochem. 36, 727–756 [DOI] [PubMed] [Google Scholar]
- 52. Rey S., Semenza G. L. (2010) Hypoxia-inducible factor-1-dependent mechanisms of vascularization and vascular remodeling. Cardiovasc. Res. 86, 236–242 [DOI] [PMC free article] [PubMed] [Google Scholar]
- 53. Gusarova G. A., Trejo H. E., Dada L. A., Briva A., Welch L. C., Hamanaka R. B., Mutlu G. M., Chandel N. S., Prakriya M., Sznajder J. I. (2011) Hypoxia leads to Na,K-ATPase down-regulation via Ca2+ release-activated Ca2+ channels and AMPK activation. Mol. Cell. Biol. 31, 3546–3556 [DOI] [PMC free article] [PubMed] [Google Scholar]
- 54. De Angelis C., Haupert G. T., Jr. (1998) Hypoxia triggers release of an endogenous inhibitor of Na+-K+-ATPase from midbrain and adrenal. Am. J. Physiol. Renal Physiol. 274, F182–188 [DOI] [PubMed] [Google Scholar]
- 55. Paci A., Marrone O., Lenzi S., Prontera C., Nicolini G., Ciabatti G., Ghione S., Bonsignore G. (2000) Endogenous digitalislike factors in obstructive sleep apnea. Hypertens. Res. 23, S87–91 [DOI] [PubMed] [Google Scholar]
Associated Data
This section collects any data citations, data availability statements, or supplementary materials included in this article.


