Background: Identification of cancer testis antigens (CTA) provides new tools for cancer diagnosis and therapy.
Results: Expression of the spermatogenic protein FerT recurred in colon carcinoma (CC) cells via DNA demethylation and activation of an intronic promoter.
Conclusion: FerT is a new CTA whose expression is regulated by a novel mechanism.
Significance: FerT may serve as a new target for CC diagnosis and therapy.
Keywords: Colon Cancer, Epigenetics, Gene Expression, Promoters, Testis, Cancer Testis Antigen (CTA), Fer, FerT, Methylation
Abstract
Fer is an intracellular tyrosine kinase that accumulates in most mammalian tissues. A truncated variant of Fer, FerT, is uniquely detected in spermatogenic cells and is absent from normal somatic tissues. Here, we show that in addition to Fer, FerT also accumulates in CC cells and in metastases derived from colorectal tumors, but not in normal human cells. Thus, FerT is a new member of the CTA protein family. Transcription of the ferT gene in CC cells was found to be driven by an intronic promoter residing in intron 10 of the fer gene and to be regulated by another CTA, the Brother of the Regulator of Imprinted Sites (BORIS) transcription factor. BORIS binds to the ferT promoter and down-regulation of BORIS significantly decreases the expression of ferT in CC cells. Accumulation of the ferT RNA was also regulated by the DNA methylation status and paralleled the expression profile of the boris transcript. Accordingly, the intronic ferT promoter was found to be hypomethylated in cancer cells expressing the FerT protein, by comparison with non-expressers. Collectively, we show here that FerT is a new CTA whose accumulation in CC cells, commonly considered low CTA expressers, is controlled by a novel transcription regulatory mechanism.
Introduction
Fer is an intracellular tyrosine kinase, which has been found to reside in both the cytoplasm and the nucleus of mammalian cells (1–3). This somatic kinase is present in a wide variety of tissues, and there is evidence that suggests a supportive role of Fer in the proliferation and growth of malignant cells (4, 5). A truncated variant of Fer, termed FerT, uniquely accumulates in meiotic and post-meiotic spermatogenic cells (6–8), where it has been postulated that it may participate in acrosome development (9). Murine Fer and FerT share a common kinase and SH2 domains, but they differ in their N-terminal portion where the 412 amino acid-long tail in Fer is replaced with a unique 43 amino acid-long tail in FerT (10).
Cancer testis antigens (CTA)2 is a group of proteins whose accumulation in the normal adult is typically restricted to the testis, but that are aberrantly expressed in several types of cancers (11). A key element in the induction of CTA gene expression appears to be promoter demethylation. Methylation of CpG islands within gene promoters is responsible for gene silencing, because of an effect on chromatin structure and transcription factors binding (12–14). CTA are considered potential candidates for antigen-specific cancer immunotherapy by virtue of their high immunogenicity with no, or highly restricted, expression in normal tissues (15). There are more than 100 CTA genes reported in the literature to date (16), but biological function of most of these remains poorly understood.
In this study we show that the testis-specific FerT protein accumulates in CC tumors and in metastases derived from CC malignancies, but not in normal colonic cells. Furthermore, the expression of FerT is regulated by an intronic promoter, which lies within the ubiquitously expressed fer gene. Thus, FerT is a novel CTA, which may serve as a new target for colon cancer diagnosis and therapy (17).
EXPERIMENTAL PROCEDURES
Cell Culture and Transient Transfections
FS11 cells were received as a gift from M. Revel at the Weizmann Institute of Sciences and were grown in Dulbecco's modified Eagle's medium (DMEM) containing 10% FBS and 1% nonessential amino acids (Biological Industries) and incubated at 37 °C under 5% CO2. HUH6 and HUH7 cell lines were obtained from Japanese Collection of Research Bioresources (JCRB) and were grown according to JCRB instructions. All other cell lines were obtained from the American Type Culture Collection and were grown according to ATCC instructions. For siRNA transfection, cells (a total of 2 × 10⁵) were transfected using the Lipofectamine 2000 reagent, according to the manufacturer's instructions (Invitrogen). The final concentration of the siRNA-ferT was 50 nm and of the siRNA-boris1 + 2 was 200 nm. DNA transfections were carried out using a LT1 transfection reagent (Mirus) according to the manufacturer's instructions.
siRNAs
siRNAs were targeted toward the following sequences; siRNA-ferT: 5′-CAGCUCUGAGCCUUCCACAUCAGAA-3′ (Invitrogen) siRNA-boris1: as described before (18) (Sigma) siRNA-boris2: sc60279 (Santa Cruz Biotechnology) For negative control (siRNA-neg), Stealth RNAi siRNA Negative Control Med GC (Invitrogen) was used. Transfections were performed as described above.
Antibodies (Ab)
A series of polyclonal αFer Ab was used, as follows: α SH2, directed toward the SH2 domain of p94Fer (10), αFer N terminus, directed toward 1–189 amino acids of the murine p94Fer and prepared in our laboratory and αFer C terminus directed toward the last 100 amino acids of the human p94Fer. In addition, we used the following commercially available Ab: αMyc and αβActin (Sigma),αGfp (Biovision), αPARP-1(Santa Cruz Biotechnology).
Western Blot (WB) Analysis
Whole cell lysates were prepared from cell lines, as has been described before (19). Lysates from primary colonic tissues or tumors were purchased from Origene Inc. Lysate from adult normal testis tissue was purchased from Abcam (ab30257). WB analysis was conducted as has been described (19).
Mass Spectrometry (MS) Analysis
40 mg of protein lysates were incubated overnight at 4 °C with 1:100 diluted purified Ab directed toward the C terminus of the Fer protein. Antigen-antibody complexes were precipitated with protein A-Sepharose (GE Healthcare). Precipitates were washed three times with PBS. Recovered immunocomplexes were solubilized in a Laemmli sample buffer and were separated on SDS-PAGE. The proteins were stained with silver stain (Pierce). An appropriate band was cut out of the gel and subjected to mass spectrometry analysis that was carried out by the Proteomic Unit at the Technion, Haifa, Israel.
Cell Cycle Analysis
Cell cycle, flow-cytometry analysis was performed as described before (4). The data were analyzed using Cell Quest Pro software (Becton Dickinson) and ModFit LT software.
BrdU Incorporation Assay
Cells (2 × 10⁵) were plated in 6-well plates, and 48 h after transfection with siRNA, cells were incubated for 30 min with 10 mm BrdU (Sigma). Incorporation of BrdU was determined using a Becton Dickinson αBrdU antibody, according to the manufacturer's protocol. Cells were also stained with 5 mg/ml PI solution. The cellular DNA content was determined using a flow cytometer (Becton Dickinson FACS Calibur); data were analyzed using Cell Quest Pro software.
Annexin V Staining
Cells (2 × 10⁵) were plated in six well plates, and 48 h after transfection with siRNA cells were stained with Annexin V-FITC and propidium iodide using the MEBCYTO-apoptosis kit (MBL) following manufacturer's instructions. The total cellular DNA content and bound Annexin V-FITC were determined using a Becton Dickinson flow cytometer (FACS Calibur); all data were analyzed using Cell Quest Pro software.
RT-PCR Analysis
Whole cell RNA was extracted from cell cultures using TRI Reagent (Molecular Research Center), following the manufacturer's instructions. Total RNA from human testis was purchased from Origene Inc. (HT1011). A total of 1 μg of RNA was reverse transcribed using a SuperScript first-strand synthesis system for RT-PCR (Invitrogen). For semiquantitative RT-PCR analysis, the PCR product was amplified using specific primers derived from the human ferT cDNA: forward: 5′-CCACATCAGAAGTCCACAGAGATCAGGAAAG-3′, reverse: 5′-GCCCGCGAATTCACACTCAAAAGAGAACTAC-3′, boris: forward: 5′-CAGGCCCTACAAGTGTAACGACTGCAA-3′, reverse: 5′-GCATTCGTAAGGCTTCTCACCTGAGTG-3′, gapdh: forward: 5′-AAGGTCATCCCTGAGCTGAACG-3′, reverse: 5′-CAAAGGTGGAGGAGTGGGTGTC-3′. PCR products were separated on an agarose gel.
Quantitative Real-time RT-PCR Analysis (qRT-PCR)
qRT-PCR was performed using Fast SYBER Green Master Mix (Applied Biosystems) and the following primer pairs: gapdh: forward: 5′-TGGCCAAGGTCATCCATGACAA-3′, reverse: 5′-GGGCCATCCACAGTCTTCTG-3′, fer: forward: 5′-GCAGAAAGTTTGCAAGTAATGTTGA-3′, reverse: 5′-CCAAAACAGCCTCCTCCTTGT-3′, ferT: forward: 5′-TTTCGGCTCCCAATCCTGTAAAAC-3′, reverse: 5′-GGAGACCTAATTATTCCAGCAATTGAATG-3′, boris: forward: 5′-CAGGCCCTACAAGTGTAACGACTGCAA-3′, reverse: 5′-GCATTCGTAAGGCTTCTCACCTGAGTG-3′.
5-Aza-dC Treatment
Cells (a total of 2 × 10⁵) were treated with 1 μm 5-Aza-dC (Sigma) for 3 days and were replenished every 24 h. RNA and whole cell lysates were extracted as described above.
Rapid Amplification of cDNA Ends (RACE)
5′-RACE was performed by using a 5′/3′-RACE kit (2nd Generation, Roche), following the manufacturer's instructions.
The specific primers used were: Sp1: 5′-TCCCTTGCCCAGTAATTCTCCCAATATGAC-3′ Sp2: 5′-AACCCAGTGCCCTCGAATCGATAC-3′ Sp3: 5′-GGACATATTCACCAGGTTTCCCATGACTCTC-3′. The RACE product was analyzed on ethidium bromide-stained agarose gel and was cloned into a pGEM-T easy vector system (Promega).
Construction of Luciferase Expression Vectors and Promoter Activity Assay
fer intronic sequences lying upstream of the fer cDNA 5′-end (−1000 bp to +200 bp) were amplified by PCR using Phusion DNA polymerase (Finnzymes). Genomic DNA extracted from HCT116 cells served as a template. The forward primer contained a MluI site: 5′-CGGCCACGCGTATCTAGTAGTTGTATCTTTGTTT-3′ and the reverse primer contained a XhoI site: 5′-CTATCCTCGAGATGTGGAAGGCTCAGAGCTGAAC-3′.
For the inversely inserted promoter, the XhoI site was included in the forward primer and the MluI site was included in the reverse primer. Creation of a PGL3 PferT mutant was carried out using a PCR site-directed mutagenesis method with an inter forward primer in which the modified nt (bold) were replaced by the nt that follows in parentheses: 5′-TCCATGCCAACAG(ACT)GGGGA (TTTC)GATAGTATGAAAT-3′ the complementary inter backward primer 5′-ATTTCATACTATCGAAACAGTTTGGCATGGA-3′.
The PCR products were digested with the restriction enzymes MluI and XhoI (Fermentas) and were then ligated to the MluI and XhoI digested plasmid pGL3-Basic (Promega), which carries the firefly luciferase gene. For promoter activity assay, 2.5 × 10⁵ HCT116 cells were transfected with 1.5 μg of each of the tested plasmids together with 1.5 μg of pSVβ-gal plasmid for normalization of transfection efficiency. Cells were lysed 48 h after transfection, the luciferase activities were measured by a Luciferase Assay System (Promega) and the β-gal activities were determined by a β-Galactosidase Enzyme Assay System (Promega). Both activities were measured with a Luminometer (Synergy4, BioTek). The luciferase activity values were normalized with the measured β-gal activities. The pGL3-brca plasmid was used as a positive control (a gift from Prof. Ginsberg's laboratory at Bar-Ilan University).
Chromatin Immunoprecipitation (ChIP)
ChIP was performed with HCT116 cells transfected with pEIRES Myc-BORIS or with an empty vector using a ChIP assay kit (Upstate). For each immunoprecipitation, 2 μg of each Ab was used. αMyc (Santa Cruz Biotechnology) and αGfp (Biovision). Primers used for PCR are given by: for ferT promoter: forward: 5′-GCTAGCTCGAGCCTTTAATCCAGAACTGACTAG-3′, reverse: 5′-GTCAGACGCGTATAGAAGAGAGGTGCAAATCTG-3′ for H19 promoter: as described in Ref. 20.
DNA Affinity Protein Binding Assay
Oligonucleotides containing the BORIS binding sites in the human fer intron were amplified by PCR with the following primers: forward: 5′-GCTAGCTCGAGCCTTTAATCCAGAACTGACTAG-3′, reverse: 5′-GCTAGCTCGAGCCTTTAATCCAGAACTGACTAG-3′.
The PCR product was digested with the restriction enzymes MluI and XhoI (Fermentas), ligated, and bound to cyanogen bromide-activated Sepharose beads (CNBr-S) (Sigma). 200 μg of nuclear extract (21) from HCT116 cells, transfected with Myc-BORIS or with the empty vector, were incubated with 100 μl of DNA-bound beads overnight in a binding buffer containing 20 mm Hepes pH 7.9, 2 mm MgCl, 60 mm KCl, and 10% glycerol. The next day, the beads were washed with PBS three times and bound proteins were eluted with 30 μg of Laemmli sample buffer and subjected to WB analysis.
Bisulfite Sequencing
300 ng of genomic DNA from HCT116 and HT29 cells was subjected to bisulfite modification using an EZ DNA Methylation Direct kit (Zymo) according to the manufacturer's instructions. A 550 bp sequence of the ferT promoter (−550 to +1) was amplified by PCR using the following primers: forward: 5′-GAAAGTGAGGTATATTTTTAGAGATTTTGAGATTT-3′, reverse: 5′-CCAAAAAAATCAATTTACCAACAAACCTTCCTATATA-3′. PCR fragments were ligated into the pGem-T Easy cloning vector (Promega). Following transformation, plasmids from individual bacterial colonies were isolated and sequenced (HyLabs).
Statistical and Bioinformatic Analysis
Statistical analysis was performed using the paired and unpaired Student's t test, with a p value ≤0.05 being considered significant. Results are depicted as means ± S.E. of the mean for n given samples. For the identification of transcription factors, binding sites and promoter analysis, “MathInspector” (Genomatix Ltd.) was used. The “MathPrimer” program from the Li laboratory in UCSF was used for CpG islands prediction and for designing of the PCR primers. Analysis of nucleotide and amino acid sequences was carried out using the ClustalW application. Fer transcripts information was retrieved from the EBI database.
RESULTS
Selective Accumulation of a Fer-related Protein in CC Cells
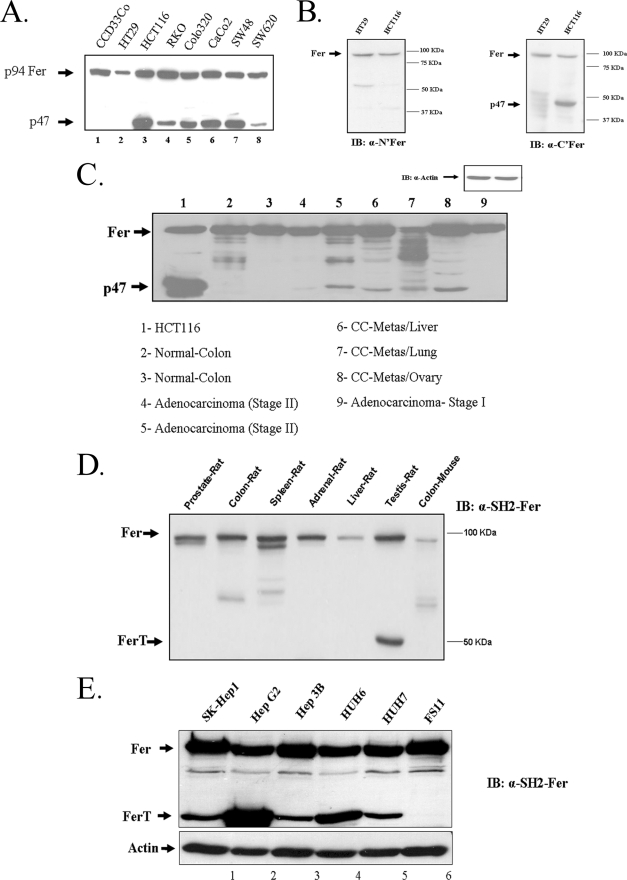
Examination of the expression of Fer in seven human CC cell lines derived from various tumor stages and from normal human colonic cells (CCD33Co) revealed that, in addition to Fer, a protein of about 47kDa MW (p47) also reacted with the αSH2-Fer Ab in six of the CC cell lines analyzed. However, p47 was neither detected in the HT29 adenocarcinoma cells, nor in the normal colonic CCD33Co cells (Fig. 1A).
FIGURE 1.
Fer and a Fer-related proteins accumulating in CC cells. A, whole cell lysates were prepared from normal human colonic cells CCD33Co (lane 1) and from seven human CC lines (lanes 2–8). Proteins were resolved by SDS-PAGE and were reacted with αSH2-Fer Ab, using WB analysis. The migration distances of the p94Fer and p47 proteins are indicated. B, lysates from HT29 and from HCT116 cells were reacted with Ab directed toward the unique N-terminal tail of Fer (left panel), or Ab directed toward the C-terminal end of Fer (right panel), by WB. β-Actin served as a loading control. C, WB with αSH2-Fer Ab of whole cell lysates from HCT116 cells (1), from normal human colon tissue (2, 3), from stage II primary colorectal adenocarcinoma (4, 5), from CC metastases in the liver (6), from CC metastases in the lung (7), from CC metastases in the ovary (8) and from stage I adenocarcinoma (9). The migration distances of Fer and the p47 protein are marked. These data represent one of three independent experiments which gave similar results. D, levels of the Fer proteins in normal mouse and rat tissues. WB with αSH2-Fer Ab of whole cell lysates from rat prostate tissue (1), from normal rat colon tissue (2), from normal rat spleen tissue (3), from normal rat adrenal tissue (4), from normal rat liver tissue (5), from normal rat testis tissue (6), and from normal mouse colon tissue (7). The migration distances of Fer and the rat ferT are marked. These data represent one of three independent experiments which gave similar results. E, protein lysates were prepared from five HCC cell lines and from the primary fibroblasts of human FS11 cells. Proteins were reacted with αSH2-Fer Ab in a WB analysis.
To gain an indication whether p47 represents a truncated variant of Fer, like FerT, lysates from the CC cells were reacted with αFer Ab directed toward either the N-terminal tail or the C-terminal end of the protein. While αC terminus Ab reacted with p47, the αN-terminal Ab, reacted only with the 94 kDa full-length Fer (Fig. 1B). These results suggested the accumulation in CC cells of a truncated variant of Fer, which lacks the N-terminal portion of the somatic kinase and could exert the structure of FerT (6).
To examine whether the presence of p47 in CC cell lines reflects the accumulation of this protein in a tumor-specific manner, whole cell lysates from normal human colon, primary CC tumors and from metastases of CC tumors in the lungs, liver and ovaries were reacted with αSH2-Fer Ab in a WB analysis. The p47 protein was not detected in normal colon tissues nor in a stage I colon adenocarcinoma lysate (Fig. 1C). This protein was also absent from mice normal colon tissue and from various rat and mouse tissues (Fig. 1D). However, it was detected in primary stage II human CC tumors. Furthermore, p47 was also present in CC metastases in the liver, lungs and ovaries (Fig. 1C). Notably, the p47 was also present in five cell lines derived from hepatocellular carcinoma (HCC) tumors and analyzed using the αFer Ab (Fig. 1E).
FerT Is Expressed in CC Cells
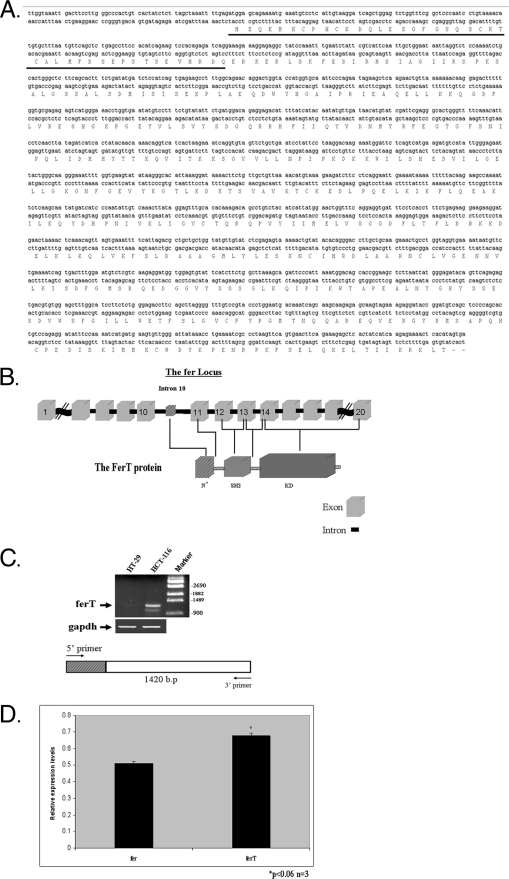
To conclusively characterize and identify the Fer-related p47 protein, mRNAs containing Fer-related sequences were cloned from HCT116 cells. The open reading frame (ORF) of a RACE product containing fer RNA sequences was found to encode a truncated variant of Fer, which very closely resembles the mouse and rat testis-specific FerT proteins. Furthermore, the ORF of this RNA was found to be identical to the ORF of the human ferT RNA cloned from human testis RNA and described here for the first time. Like the predicted human and mouse (6) FerT proteins, the truncated variant in CC cells contains intact SH2 and kinase domains of Fer, which are linked to a unique 43 amino acid-long N-terminal tail (Fig. 2A). We, therefore, conclude that the ferT RNA is expressed in CC cells. Alignment of the ferT cDNA sequence with the human fer locus indicated that the unique N-terminal tail encoded by the ferT RNA is encoded by intron 10 of the fer gene. The first nucleotide of the translation initiation codon of the ferT mRNA is transcribed from nucleotide 26,813 in intron 10 of the human fer locus. This intron comprises 48,281 nucleotides (ensemble human gene view) and the remainder of the FerT protein is encoded by exons 11–20 of the fer gene (Fig. 2B).
FIGURE 2.
ferT is expressed in CC cells. A, nucleotide sequence of the p47 cDNA and its longest ORF translation product are shown. The unique N-terminal sequence preceding the human fer sequence is underlined. B, N-terminal tail of FerT is encoded by intron 10 of the human fer gene. The structure of the FerT protein is shown. The unique N-terminal tail, the SH2, and kinase domains (KD) are depicted. Exons of the fer locus encoding the Fer and FerT proteins are indicated and correspond to the encoded domains of FerT. C, ferT mRNA accumulates in HCT116 cells. RNA was extracted from HT29 and from HCT116 cells. The RNA samples were subjected to semi-quantitative RT-PCR analysis using a unique 5′ ferT primer and a 3′ fer primer (diagram below striped box represents unique ferT sequences). The gapdh RNA served as an internal control. D, HCT116 RNAs were extracted, and the relative levels of the fer and ferT mRNAs were determined using qRT-PCR and normalized to the gapdh RNA levels. Values represent means ± S.E.
In a complementary approach, a semi quantitative RT-PCR analysis was performed on RNA prepared from HCT116 and from HT29 cells. This was carried out using a 3′-primer, which is common to fer and ferT, and a unique primer corresponding to the 5′-end of the ferT cDNA. Consistent with the accumulation of FerT in HCT116 cells, this analysis revealed an expected product of 1420 bp and clearly demonstrated the preferential accumulation of the ferT mRNA in HCT116 cells (Fig. 2C). qRT-PCR analysis demonstrated similar levels of the fer and ferT RNAs in HCT116 cells (Fig. 2D).
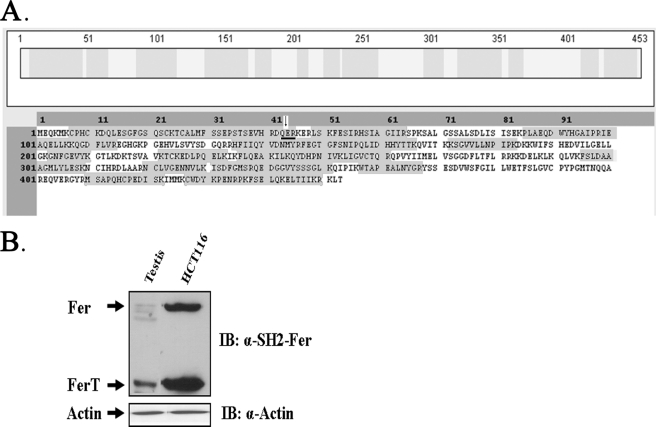
To further confirm the link between the cloned ferT RNA and p47, the amino acid sequence of this protein was directly determined. P47 was immunopurified from HCT116 lysates and was then resolved in preparative SDS-PAGE. The band containing the silver-stained protein was subjected to MS analysis. 38 peptides were obtained. Of these, 5 consisted of the unique N-terminal sequence of FerT and 33 were composed of the common FerT/Fer aa sequence (Fig. 3A). Notably, one peptide contained the expected joint point between the FerT N-terminal tail and the Fer amino acid sequence (Fig. 3A). Finally, the human testis FerT protein migration profile on SDS-PAGE was identical to that of the CC FerT protein (Fig. 3B). Taken together, these findings imply that the meiotic FerT protein is encoded and translated from the ferT RNA in CC cells.
FIGURE 3.
Identification of the human FerT protein in CC cells. A, FerT protein, purified from HCT116 lysates, was subjected to mass spectrometry analysis. Shadowed fragments highlight peptides obtained from the mass spectrometry analysis that match the predicted FerT protein sequence. The sequence spanning the joining point between the unique FerT N-terminal sequences and the Fer amino acid sequence, is underlined. The arrow indicates the beginning of the common Fer/FerT amino acid sequence. B, protein lysates from human testis and from HCT116 cells were reacted with αSH2-Fer Ab, using WB analysis. The migration distance of the FerT protein is indicated. These data represent one out of three independent experiments that gave similar results.
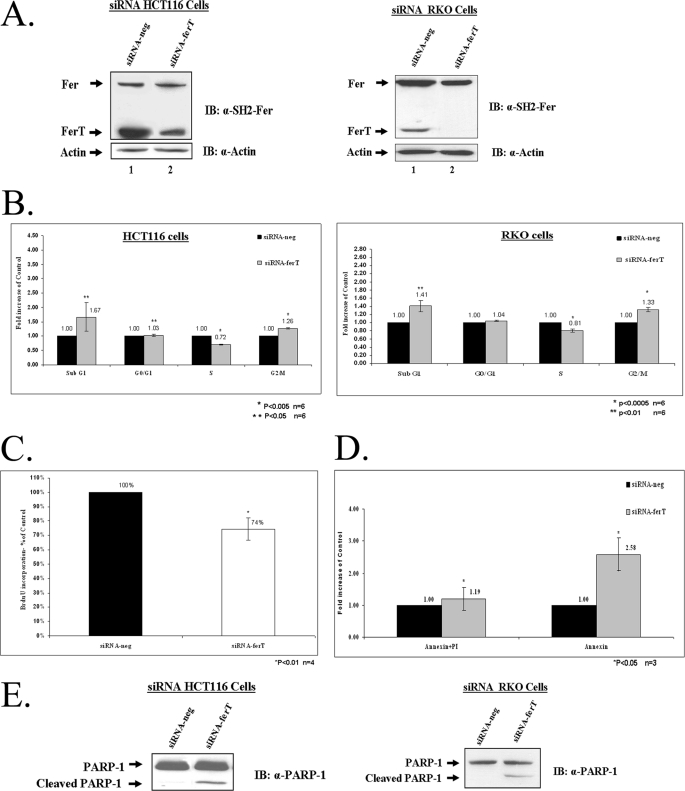
siRNA directed toward the unique 5′ of the ferT mRNA, down-regulated specifically the FerT levels in HCT116 and RKO cell lines, also linking the p47 protein to the ferT transcript which had been identified (Fig. 4A). To gain insight into the outcome of FerT knock-down in CC cells, cultures treated with the siRNA-ferT were subjected to flow-cytometry analysis. Knock-down of FerT decreased the percentage of cells residing in the S phase and increased the fraction of G2/M cells, together with an increase in the sub-G1 fraction (Fig. 4B). The attenuation of the G1-S transition was further demonstrated by the reduction in the level of BrdU incorporation upon the knock-down of FerT (Fig. 4C). The increased accumulation of the sub-G1 population in the treated cells was found to reflect the induction of apoptotic death upon knock-down of FerT, as seen by staining the cells with Annexin V (Fig. 4D) which stains membranes of cells undergoing apoptosis (22). The onset of apoptosis in FerT-depleted cells was corroborated by the identification of cleaved poly(ADP-ribose) polymerase-1 (PARP-1) (23) in the treated CC cells (Fig. 4E).
FIGURE 4.
Down-regulation of FerT impairs cell-cycle progression and invokes apoptosis in CC cells. FerT was knocked-down using selective siRNA directed toward the unique 5′ sequences of the ferT RNA (siRNA-ferT) in HCT116 and RKO cells. siRNA-neg was used as a negative control. A, WB analysis was performed using αSH2-Fer Ab and β-actin served as a loading control. This figure represents one out of three independent experiments which gave similar results. B, distribution of HCT116 and RKO cells in the various cell cycle fractions. C, percentage of cells incorporating BrdU. D, annexin V staining of treated HCT116 cells. B–D, values represent means ± S.E. E, WB analysis was performed using αPARP-1 Ab. This figure represents one out of three independent experiments, which gave similar results.
A ferT Promoter Is Embedded in Intron 10 of the fer Gene
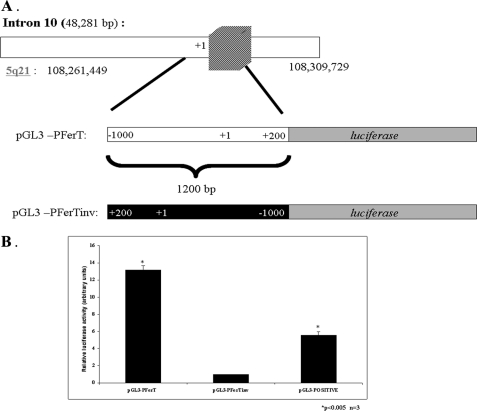
To further explore the regulation of ferT expression in CC cells, we looked for a promoter embedded in intron 10 of the fer locus, from which the 5′-end of the cloned ferT RNA is encoded. A 1200 bp long intronic fragment extending from 1000 bp upstream of the ferT cDNA 5′-end (nucleotide 26758 in intron 10) to 200 bp downstream of this point (Fig. 5A) was amplified and cloned from genomic DNA of HCT116 cells. HCT116 cells were then transfected with a plasmid carrying the putative ferT promoter linked to a luciferase reporter gene. The luciferase activity, driven by the intronic fer fragment, was 12-fold higher than the activity driven by the same fragment when inversely inserted upstream of the luciferase gene (Fig. 5B). These results suggest the existence of a promoter in intron 10 of the fer locus, which directs the transcription of ferT.
FIGURE 5.
Intronic promoter residing in intron 10 of the fer gene. A, schematic description of the 1200 bp long putative ferT promoter derived from intron 10 of the fer gene. Intron 10 of fer is presented in the upper scheme. The striped box denotes exonic ferT sequences. The amplified, 1200 bp long fragment directly (PGL3-PferT) or inversely (PGL3-PferTinv) inserted upstream of a luciferase reporter gene is shown below. The 5′-end point of the cloned ferT cDNA is marked +1. B, luciferase activities in the HCT116 cells transfected with the pGL3-PferT, pGL3-PferTinv, and pGL3-positive plasmids are shown. Luciferase activity values are normalized to βGal activities encoded by a co-transfected pSV βgal plasmid. The calculated luciferase activities were the average of three independent transfection experiments. Histograms present mean ± S.E.
BORIS Binds to the ferT Promoter
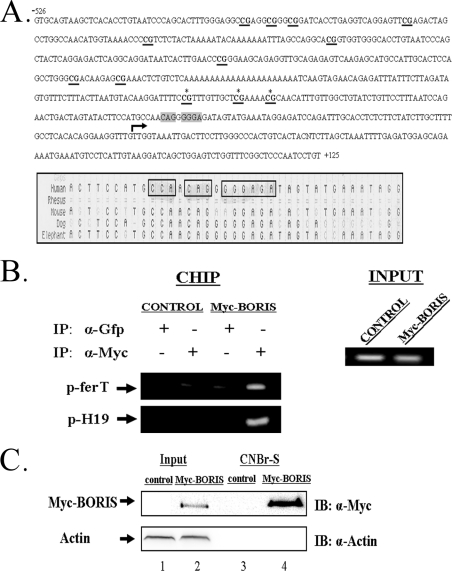
“MathInspector” analysis of the DNA fragment carrying the ferT promoter revealed a conserved potential binding site for the CTCF/BORIS transcription factors family. Analysis of this sequence of the ferT promoter using the University of California Santa Cruz Genome Browser showed high conservation between mammalian species (Fig. 6A). BORIS is the paralog of CTCF (CCCTC binding factors) and it is normally expressed only in the testis (24). However, in addition to its normal expression in the testis, recent studies revealed that various tumors and cancer cell lines are also expressing BORIS with frequent co-expression of cancer testis antigens (18, 25–28).
FIGURE 6.
BORIS binding to the ferT promoter. A, DNA sequence of 526 nucleotides extending upstream of the +1 nucleotide (arrow) of the cloned ferT cDNA and 125 nucleotides downstream of this point are shown. The BORIS potential binding site is shadowed in gray. CpG islands in this region are underlined, and the three sites lying proximal to the BORIS binding site are marked with asterisks. Below, alignment of conserved BORIS binding sites from five mammals. Conserved nucleotides are framed by triangles. B, ChIP analysis; Myc-BORIS was immunoprecipitated from HCT116 cells transfected with the pEIRES Myc-BORIS (Myc-BORIS) expression vector or with the empty vector (control) and fixed with 1% formaldehyde to crosslink protein-DNA interactions. Co-precipitated DNA was eluted, amplified by PCR, with primers that cover the BORIS binding site in the ferT promoter region. The H19DMR promoter served as a positive control (20). C, nuclear extracts prepared from HCT116 cells transfected with the pEIRES Myc-BORIS vector or with the empty vector (control) were incubated with a ferT promoter probe linked to CNBr-S beads. Bound complexes were purified and resolved in SDS-PAGE. The presence of Myc-BORIS was analyzed in the crude nuclear extracts (1, 2) and in the purified fractions (3, 4) using WB analysis. β-Actin served as loading and negative control. These data present one out of three independent experiments which gave similar results.
To examine whether BORIS can bind its potential sequence in the putative ferT promoter, we carried out a ChIP analysis. BORIS was immunoprecipitated from Myc-BORIS overexpressing HCT116 cells and the co-precipitation of ferT promoter sequences with chromatin-associated BORIS was verified using PCR analysis. The H19 promoter served as a positive control (20) (Fig. 6B). To further establish the binding of BORIS to an identified site in the ferT promoter, purification through sequence-specific DNA affinity chromatography was carried out.
Nuclear proteins were extracted from Myc-BORIS over expressing HCT116 cells and from control cells harboring the empty vector. The proteins were purified using CNBr-S beads covalently bound to 75-bp long (nucleotide −115 to −39, Fig. 6A) repeats of the potential BORIS binding site from the ferT promoter. The bound proteins were eluted, separated in SDS-PAGE, and reacted with αMyc Ab. Myc-BORIS was found to bind the DNA site derived from the ferT promoter (Fig. 6C).
BORIS Regulates the ferT RNA Level in CC Cells
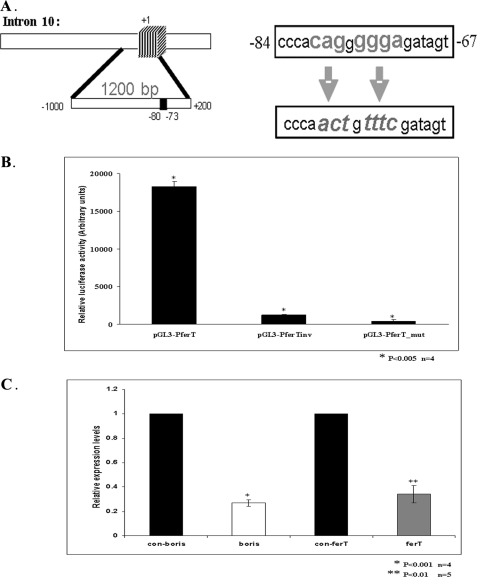
To emphasize the functional role of BORIS binding to the ferT promoter we mutated the BORIS binding site extending from nucleotide −80 to −73 upstream of the +1 ferT 5′ site (Fig. 7A). The introduced mutations almost completely abolished the luciferase activity driven by the ferT promoter (Fig. 7B). To more directly link BORIS to the regulation of the ferT expression, the boris transcript was down-regulated using specific siRNAs. Knock-down of boris significantly decreased the endogenous ferT RNA levels in HCT116 cells, as was measured using qRT-PCR assay (Fig. 7C).
FIGURE 7.
BORIS regulates the ferT RNA level in CC cells. A, BORIS binding site in the ferT promoter, extending from nucleotide −80 to −73 relative to the +1 site, is indicated. Presented to the right of this scheme are the BORIS binding site conserved nucleotides (in bold, upper triangle), which were substituted (italics, lower triangle) in the ferT promoter (pGL3-PferT_mut) and directly inserted upstream of a luciferase reporter gene. B, luciferase activities directed by the pGL3-PferT, pGL3-PferTinv, and pGL3-PferT_mut plasmids in HCT116 cells. Histograms represent mean luciferase activities ± S.E., normalized to the β-Gal activities. C, ferT (gray histogram) and boris (empty histogram) RNA levels in HCT116 cells transfected with selective siRNAs directed toward the boris RNA. The ferT RNA level in cells transfected with negative control (siRNA-neg) (black histogram) is presented as well. Relative RNA levels were determined using qRT-PCR analysis and the gapdh RNA served as an internal control. Values represent means ± S.E.
Expression of FerT in CC Cells Is Controlled by DNA Methylation
DNA methylation changes have been recognized as one of the most common molecular alterations in human tumors, including colon cancer. Many cancers were shown to exert a global hypomethylation profile of DNA, compared with normal tissues (29–31). Also BORIS expression, like other members of the CTA family, is regulated by methylation/demethylation (18, 32). To unravel the role of methylation in the regulation of ferT expression, malignant and normal cells were treated with the demethylating agent, 5-aza-2-deoxycytidine (5-Aza-dC).
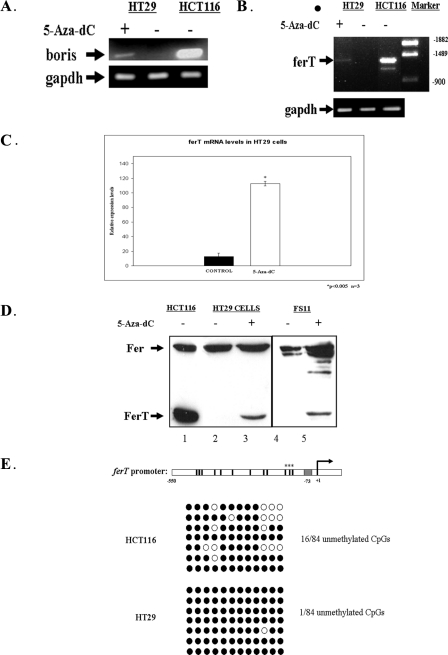
The levels of the boris transcript were found to be in direct correlation with the ferT RNA expression profile in HCT116 and HT29 cells, when untreated or subjected to the 5-Aza-dC treatment (Fig. 8, A and B). While the level of the boris and ferT transcripts were relatively high in untreated HCT116 cells, expression levels of these RNAs in HT29 cells could only be detected upon exposure of these cells to 5-Aza-dC (Fig. 8, A and B). qRT-PCR analysis revealed that treatment with 5-Aza-dC induced the expression of the ferT RNA with a 9-fold increase in HT29 cells (Fig. 8C). Accordingly, 5-Aza-dC also induced the accumulation of the FerT protein in HT29 CC cells and in primary human foreskin FS11 fibroblasts, which normally do not express this testis-specific protein (Fig. 8D). This envisages the involvement of DNA methylation in the regulation of ferT expression.
FIGURE 8.
DNA methylation controls the expression of FerT in somatic cells. A, Boris RNA levels in untreated HCT116 and HT29 cells, and in HT29 cells treated with 5-Aza-dC, as determined using semi quantitative RT-PCR analysis. The gapdh RNA served as an internal control. B, ferT RNA levels in the untreated and treated samples as determined using a unique 5′ ferT primer and a 3′ fer primer in a semi quantitative RT-PCR analysis. The gapdh RNA served as an internal control. C, ferT RNA levels in HT29 cells untreated or treated with 5-Aza-dC as determined using qRT-PCR and normalized to the gapdh RNA levels. D, Fer and FerT protein levels in untreated HCT116 (1), and HT29 cells (2), in 5-Aza-dC-treated HT29 cells (3), in untreated (4) and 5-Aza-dC-treated (5) FS11 cells. Proteins were resolved by SDS-PAGE and were reacted with αSH2-Fer Ab, using WB analysis. These data represent one out of three independent experiments which gave similar results. E, genomic bisulfite sequencing of the ferT promoter region (−550 bases upstream of the +1 5′-end of the ferT cDNA). 12 CpG sites dispersed along the ferT promoter are marked in the upper scheme. The BORIS binding site is shown in gray. After PCR amplification and cloning, 7 HCT116 and 7 HT29 genomic clones were analyzed. Methylated CpG sites are indicated in black and unmethylated in white.
We therefore examined the methylation profile of the CpG islands residing next to the BORIS binding site, which plays a key role in the functioning of the ferT promoter. Whereas almost all of the 12 CpG islands (Fig. 6A) in intronic fer DNA from HT29 cells were found to be methylated (1/84 unmethylated CpGs), a significantly higher fraction of these sites (16/84 unmethylated CpGs) were unmethylated in genomic DNA extracted from HCT116 cells (Fig. 8E). Notably, the three sites most proximal to the BORIS binding sequence were most frequently found to be demethylated in HCT116 (Figs. 6A and 8E).
DISCUSSION
FerT is a meiosis and post-meiosis specific tyrosine kinase that normally uniquely accumulates in spermatogenic cells. In this work, we describe the expression of the human FerT protein in CC cells. The ferT RNA was cloned from these malignant cells and was found to be identical to the human testicular ferT, cloned, and described here for the first time. Examination of the human ferT longest ORF revealed that, like the mouse FerT, the human FerT bears a 43 amino acid long unique N terminus that differs from the ubiquitously expressed Fer (6).
Accumulation of FerT in CC cells casts this protein as a new member of a wider group of CTA (33). It should be noted, however, that the accumulation of FerT is not necessarily restricted to CC cells and it seems to be present also in other types of cancer like HCC. Although the regulatory role of FerT in malignant cells is still elusive, we showed here that down-regulation of this protein impaired cell cycle progression and induced apoptosis in CC cells.
The 5′-end of the ferT cDNA, identified by us using a RACE analysis, lies within intron 10 of the ubiquitously expressed fer gene and the unique N-terminal tail of FerT is encoded by this intron. These findings suggest that the ferT transcript is initiated in this intronic region. In compliance with this notion, an intronic fragment extending 1000 bp upstream of the 5′-end of the cloned ferT cDNA exerts transcription-promoting activity and is most probably part of the ferT promoter. Thus, while the intronic ferT promoter is not active in normal somatic cells, it becomes functional in CC cells. Bioinformatic analysis of the ferT promoter revealed a conserved binding site of BORIS, a member of the CTA group which positively regulates the transcription of other CTA-encoding genes (28).
Indeed, we found that BORIS bound the putative ferT promoter and that mutation of its binding site abolished the transcription-directing activity of the ferT promoter. Moreover, down-regulation of the boris transcript using selective siRNAs significantly reduced the ferT RNA expression levels.
DNA methylation changes have been recognized as one of the most common affecters of modified gene expression profiles in human tumors, including colon cancer (29–31). Accordingly, like other members of the CTA group, the boris gene expression is tightly regulated by DNA methylation (18, 32).
In parallel to boris, the expression of ferT is also induced by the demethylating agent 5-Aza-dC (34). Moreover, 5-Aza-dC induces the accumulation of the FerT protein in normal and cancer cells. Thus, the induction of FerT expression in somatic cells by 5-Aza-dC could result from the accumulation of BORIS in the treated cells. Because it was reported that BORIS can reprogram the methylation profile next to its binding site (35), this transcription factor could also affect the methylation profile of the ferT promoter.
In compliance with this notion, the methylation profiles of the intronic promoter sequences from HCT116 cells that express FerT exerted hypomethylation of CpG sequences, which lie in proximity to the BORIS binding site. This differs from HT29 cells, which do not express FerT and in which the fer intronic region next to the BORIS binding site is methylated.
Hence, like other members of the CTA group, demethylation and expression of the BORIS transcription factor govern the expression of the ferT gene and enable the accumulation of the FerT protein in CC cells. Collectively, our findings portray FerT as a new CTA whose expression in cancer cells is controlled through the activation of an intronic promoter which resides in a ubiquitously expressed somatic gene. Unlike melanoma, bladder, and non-small cell lung carcinoma, which were reported to frequently express CTA, CC is considered a low CTA gene expresser (11). Thus, further studies should reveal whether FerT is frequently expressed in CC and in HCC tumors and can therefore serve as a new target for CC and HCC diagnosis and immunotherapy (17).
Acknowledgment
We thank Avrille Goldreich for editing this manuscript.
This work was supported by a grant from the Israeli Chief Scientist of the Ministry of Health.
- CTA
- cancer testis antigens
- RACE
- rapid amplification of cDNA ends
- BORIS
- brother of the regulator of imprinted sites
- PARP
- poly(ADP-ribose) polymerase-1
- CC
- colon carcinoma
- 5-Aza-dC
- 5-aza-2-deoxycytidine.
REFERENCES
- 1. Hao Q. L., Heisterkamp N., Groffen J. (1989) Isolation and sequence analysis of a novel human tyrosine kinase gene. Mol. Cell Biol. 9, 1587–1593 [DOI] [PMC free article] [PubMed] [Google Scholar]
- 2. Ben-Dor I., Bern O., Tennenbaum T., Nir U. (1999) Cell cycle-dependent nuclear accumulation of the p94fer tyrosine kinase is regulated by its NH2 terminus and is affected by kinase domain integrity and ATP binding. Cell Growth Differ. 10, 113–129 [PubMed] [Google Scholar]
- 3. Letwin K., Yee S. P., Pawson T. (1988) Novel protein-tyrosine kinase cDNAs related to fps/fes and eph cloned using anti-phosphotyrosine antibody. Oncogene 3, 621–627 [PubMed] [Google Scholar]
- 4. Pasder O., Shpungin S., Salem Y., Makovsky A., Vilchick S., Michaeli S., Malovani H., Nir U. (2006) Down-regulation of Fer induces PP1 activation and cell-cycle arrest in malignant cells. Oncogene 25, 4194–4206 [DOI] [PubMed] [Google Scholar]
- 5. Allard P., Zoubeidi A., Nguyen L. T., Tessier S., Tanguay S., Chevrette M., Aprikian A., Chevalier S. (2000) Links between Fer tyrosine kinase expression levels and prostate cell proliferation. Mol. Cell Endocrinol. 159, 63–77 [DOI] [PubMed] [Google Scholar]
- 6. Fischman K., Edman J. C., Shackleford G. M., Turner J. A., Rutter W. J., Nir U. (1990) A murine fer testis-specific transcript (ferT) encodes a truncated Fer protein. Mol. Cell Biol. 10, 146–153 [DOI] [PMC free article] [PubMed] [Google Scholar]
- 7. Hazan B., Bern O., Carmel M., Lejbkowicz F., Goldstein R. S., Nir U. (1993) ferT encodes a meiosis-specific nuclear tyrosine kinase. Cell Growth Differ. 4, 443–449 [PubMed] [Google Scholar]
- 8. Keshet E., Itin A., Fischman K., Nir U. (1990) The testis-specific transcript (ferT) of the tyrosine kinase FER is expressed during spermatogenesis in a stage-specific manner. Mol. Cell Biol. 10, 5021–5025 [DOI] [PMC free article] [PubMed] [Google Scholar]
- 9. Kierszenbaum A. L., Rivkin E., Tres L. L. (2008) Expression of Fer testis (FerT) tyrosine kinase transcript variants and distribution sites of FerT during the development of the acrosome-acroplaxome-manchette complex in rat spermatids. Dev. Dyn. 237, 3882–3891 [DOI] [PubMed] [Google Scholar]
- 10. Priel-Halachmi S., Ben-Dor I., Shpungin S., Tennenbaum T., Molavani H., Bachrach M., Salzberg S., Nir U. (2000) FER kinase activation of Stat3 is determined by the N-terminal sequence. J. Biol. Chem. 275, 28902–28910 [DOI] [PubMed] [Google Scholar]
- 11. Scanlan M. J., Simpson A. J., Old L. J. (2004) The cancer/testis genes: review, standardization, and commentary. Cancer Immun. 4, 1. [PubMed] [Google Scholar]
- 12. Baylin S. B., Herman J. G. (2000) DNA hypermethylation in tumorigenesis: epigenetics joins genetics. Trends Genet. 16, 168–174 [DOI] [PubMed] [Google Scholar]
- 13. Zendman A. J., Ruiter D. J., Van Muijen G. N. (2003) Cancer/testis-associated genes: identification, expression profile, and putative function. J. Cell Physiol. 194, 272–288 [DOI] [PubMed] [Google Scholar]
- 14. Koslowski M., Bell C., Seitz G., Lehr H. A., Roemer K., Müntefering H., Huber C., Sahin U., Türeci O. (2004) Frequent nonrandom activation of germ-line genes in human cancer. Cancer Res. 64, 5988–5993 [DOI] [PubMed] [Google Scholar]
- 15. Caballero O. L., Chen Y. T. (2009) Cancer/testis (CT) antigens: potential targets for immunotherapy. Cancer Sci. 100, 2014–2021 [DOI] [PMC free article] [PubMed] [Google Scholar]
- 16. Almeida L. G., Sakabe N. J., deOliveira A. R., Silva M. C., Mundstein A. S., Cohen T., Chen Y. T., Chua R., Gurung S., Gnjatic S., Jungbluth A. A., Caballero O. L., Bairoch A., Kiesler E., White S. L., Simpson A. J., Old L. J., Camargo A. A., Vasconcelos A. T. (2009) CTdatabase: a knowledge-base of high-throughput and curated data on cancer-testis antigens. Nucleic Acids Res. 37, D816–819 [DOI] [PMC free article] [PubMed] [Google Scholar]
- 17. Scudellari M. (2011) A ballsy search for cancer targets. Nature Med. 17, 916–918 [DOI] [PubMed] [Google Scholar]
- 18. Woloszynska-Read A., James S. R., Link P. A., Yu J., Odunsi K., Karpf A. R. (2007) DNA methylation-dependent regulation of BORIS/CTCFL expression in ovarian cancer. Cancer Immun. 7, 21. [PMC free article] [PubMed] [Google Scholar]
- 19. Hikri E., Shpungin S., Nir U. (2009) Hsp90 and a tyrosine embedded in the Hsp90 recognition loop are required for the Fer tyrosine kinase activity. Cell Signal 21, 588–596 [DOI] [PubMed] [Google Scholar]
- 20. Nguyen P., Cui H., Bisht K. S., Sun L., Patel K., Lee R. S., Kugoh H., Oshimura M., Feinberg A. P., Gius D. (2008) CTCFL/BORIS is a methylation-independent DNA-binding protein that preferentially binds to the paternal H19 differentially methylated region. Cancer Res. 68, 5546–5551 [DOI] [PMC free article] [PubMed] [Google Scholar]
- 21. Carmel M., Shpungin S., Nir U. (2000) Role of positive and negative regulation in modulation of the Fer promoter activity. Gene. 241, 87–99 [DOI] [PubMed] [Google Scholar]
- 22. van Engeland M., Ramaekers F. C., Schutte B., Reutelingsperger C. P. (1996) A novel assay to measure loss of plasma membrane asymmetry during apoptosis of adherent cells in culture. Cytometry 24, 131–139 [DOI] [PubMed] [Google Scholar]
- 23. Kaufmann S. H., Desnoyers S., Ottaviano Y., Davidson N. E., Poirier G. G. (1993) Specific proteolytic cleavage of poly(ADP-ribose) polymerase: an early marker of chemotherapy-induced apoptosis. Cancer Res. 53, 3976–3985 [PubMed] [Google Scholar]
- 24. Klenova E. M., Morse H. C., 3rd, Ohlsson R., Lobanenkov V. V. (2002) The novel BORIS + CTCF gene family is uniquely involved in the epigenetics of normal biology and cancer. Semin Cancer Biol 12, 399–414 [DOI] [PubMed] [Google Scholar]
- 25. D'Arcy V., Pore N., Docquier F., Abdullaev Z. K., Chernukhin I., Kita G. X., Rai S., Smart M., Farrar D., Pack S., Lobanenkov V., Klenova E. (2008) BORIS, a paralogue of the transcription factor, CTCF, is aberrantly expressed in breast tumours. Br. J. Cancer 98, 571–579 [DOI] [PMC free article] [PubMed] [Google Scholar]
- 26. Hong J. A., Kang Y., Abdullaev Z., Flanagan P. T., Pack S. D., Fischette M. R., Adnani M. T., Loukinov D. I., Vatolin S., Risinger J. I., Custer M., Chen G. A., Zhao M., Nguyen D. M., Barrett J. C., Lobanenkov V. V., Schrump D. S. (2005) Reciprocal binding of CTCF and BORIS to the NY-ESO-1 promoter coincides with derepression of this cancer-testis gene in lung cancer cells. Cancer Res. 65, 7763–7774 [DOI] [PubMed] [Google Scholar]
- 27. Smith I. M., Glazer C. A., Mithani S. K., Ochs M. F., Sun W., Bhan S., Vostrov A., Abdullaev Z., Lobanenkov V., Gray A., Liu C., Chang S. S., Ostrow K. L., Westra W. H., Begum S., Dhara M., Califano J. (2009) Coordinated activation of candidate proto-oncogenes and cancer testes antigens via promoter demethylation in head and neck cancer and lung cancer. PLoS ONE 4, e4961. [DOI] [PMC free article] [PubMed] [Google Scholar]
- 28. Vatolin S., Abdullaev Z., Pack S. D., Flanagan P. T., Custer M., Loukinov D. I., Pugacheva E., Hong J. A., Morse H., 3rd, Schrump D. S., Risinger J. I., Barrett J. C., Lobanenkov V. V. (2005) Conditional expression of the CTCF-paralogous transcriptional factor BORIS in normal cells results in demethylation and derepression of MAGE-A1 and reactivation of other cancer-testis genes. Cancer Res. 65, 7751–7762 [DOI] [PubMed] [Google Scholar]
- 29. Gama-Sosa M. A., Slagel V. A., Trewyn R. W., Oxenhandler R., Kuo K. C., Gehrke C. W., Ehrlich M. (1983) The 5-methylcytosine content of DNA from human tumors. Nucleic Acids Res. 11, 6883–6894 [DOI] [PMC free article] [PubMed] [Google Scholar]
- 30. Goelz S. E., Vogelstein B., Hamilton S. R., Feinberg A. P. (1985) Hypomethylation of DNA from benign and malignant human colon neoplasms. Science 228, 187–190 [DOI] [PubMed] [Google Scholar]
- 31. Feinberg A. P., Gehrke C. W., Kuo K. C., Ehrlich M. (1988) Reduced genomic 5-methylcytosine content in human colonic neoplasia. Cancer Res. 48, 1159–1161 [PubMed] [Google Scholar]
- 32. Renaud S., Pugacheva E. M., Delgado M. D., Braunschweig R., Abdullaev Z., Loukinov D., Benhattar J., Lobanenkov V. (2007) Expression of the CTCF-paralogous cancer-testis gene, brother of the regulator of imprinted sites (BORIS), is regulated by three alternative promoters modulated by CpG methylation and by CTCF and p53 transcription factors. Nucleic Acids Res. 35, 7372–7388 [DOI] [PMC free article] [PubMed] [Google Scholar]
- 33. Boon T., Old L. J. (1997) Cancer tumor antigens. Current Opin. Immunol. 9, 681–683 [DOI] [PubMed] [Google Scholar]
- 34. Jones P. A. (1985) Altering gene expression with 5-azacytidine. Cell 40, 485–486 [DOI] [PubMed] [Google Scholar]
- 35. Bhan S., Negi S. S., Shao C., Glazer C. A., Chuang A., Gaykalova D. A., Sun W., Sidransky D., Ha P. K., Califano J. A. (2011) BORIS binding to the promoters of cancer testis antigens, MAGEA2, MAGEA3, and MAGEA4, is associated with their transcriptional activation in lung cancer. Clin. Cancer Res. 17, 4267–4276 [DOI] [PMC free article] [PubMed] [Google Scholar]


