

Abstract
Background:
There is increasing recognition that the two measures in the Heaviness of Smoking Index (HSI), time to first cigarette of the day (TTFC) and daily consumption (cigarettes per day [CPD]), are strong predictors of quitting behavior.
Methods:
Use of Waves 1–4 of International Tobacco Control cohort with around 8,000 respondents per wave and 6,000 for prediction of quit outcomes at the next wave. We measured TTFC and CPD at each wave and quit outcomes at the next wave. We also looked at the relative utility of the standard categorical scoring compared with a continuous score using the square root of CPD minus the natural log of TTFC in minutes.
Results:
We found considerable consistency of the measures across years with a small decrease as duration between measurements increased. For a 3-year gap, the correlations were .72 and .70 for the continuous and categorical composite HSI measures, respectively, and were at least .63 for the individual components. Both TTFC and CPD independently predicted maintenance of quit attempts (for at least 1 month) in each of the three wave-to-wave replications, and these effects were maintained when controlling for demographic factors. CPD also predicted making attempts consistently, but the results for TTFC was not consistently significant.
Discussion:
Both TTFC and CPD are fairly reliable over time and are important predictors of quitting. There are only small effects of mode of computing the scores, and the two items can be used either individually or combined as the HSI.
Introduction
The concept of dependence or addiction is a central one for tobacco use. However, there is little consensus as to how to measure it. The best-known measures are those developed by Fagerström and his colleagues. He initially developed the Fagerström Tolerance Questionnaire that was subsequently revised to become the Fagerström Test for Nicotine Dependence (FTND; Heatherton, Kozlowski, Frecker, & Fagerstrom, 1991). However, research has indicated that the two items in these measures that are most predictive are time to first cigarette (TTFC) and cigarettes per day (CPD; Baker et al., 2007). Heatherton, Kozlowski, Frecker, Rickert, and Robinson (1989) developed an algorithm for combining the two into a Heaviness of Smoking Index (HSI). Recent research has indicated that both items have predictive validity (Hyland et al., 2006; IARC, 2008), but at least some suggest that TTFC is more predictive (Baker et al.; IARC) and at least one study has found a curvilinear effect with those moderately dependent being least likely to quit (Chaiton, Cohen, McDonald, & Bondy, 2007).
One problem with the current version of the HSI is that it imposes categories on two essentially continuous measures, and there is no good evidence that the cutpoints are optimal (Husten, 2009; IARC, 2008). However, as both measures, especially the TTFC, are highly skewed, there are problems with using these as continuous measures. One of us (Borland & Owen, 1995) has experimented with using transforms to normalize the distributions, using a square root transform for CPD and a log transform for TTFC, to provide an index that is normally distributed and can be readily used as a continuous measure. The use of a continuous measure is preferable to a categorical one in that it allows for an exploration of the parametric nature of the relationship between the two components (or the composite HSI) and outcomes. For example, it allows us to answer the question: “Is the maintenance of quit attempts linearly related to HSI score?” This is important for theorizing about the underlying nature of dependence, such as distinguishing between continuum models (more or less addicted) and threshold models (addicted or not).
The aims of this study are (a) to explore the relative utility of the mathematical transforms over the categorical ones used in the FTND and the HSI; (b) to test the independent predictive validity for cessation outcomes, both predicting making quit attempts and medium-term maintenance among those who try; and (c) to assess the utility of using the two measures independently as compared with the combined into a scale.
Methods
Sample
Respondents were restricted to daily smokers for measurement of dependence, and all those with data were followed up for quit outcomes in the next wave. Details of the sample sizes used are in Table 1. Some respondents contributed data to multiple pairs.
Table 1.
Respondent characteristics for the three wave-to-wave transitions
| Waves 1–2 |
Waves 2–3 |
Waves 3–4 |
|
| n = 6,116 | n = 4,974 | n = 4,975 | |
| Age (years) | |||
| M (SD) | 43.3 (14.2) | 44.7 (14.0) | 45.5 (13.6) |
| Sex | |||
| Female (%) | 55.5 | 56.3 | 56.9 |
| Country (%) | |||
| Canada | 24.9 | 26.7 | 25.1 |
| USA | 19.8 | 21.3 | 22.0 |
| UK | 27.9 | 25.6 | 26.1 |
| Australia | 27.3 | 26.5 | 26.8 |
Design
A longitudinal study whereby various indices of dependence are used to predict making quit smoking attempts, and among those who tried, medium-term maintenance (defined as staying quit for at least 1 month), with outcomes measured at the next year’s wave of the survey.
A full description of the International Tobacco Control Project conceptual framework and methods has been published elsewhere (Fong et al., 2006; Thompson et al., 2006). Critical to this paper is that cohorts are followed annually in four countries, USA, UK, Canada, and Australia, with the measures of interest being asked in each wave.
Measures
CPD was assessed by: “On average, how many cigarettes do you smoke each day, including both factory-made and roll-your-own cigarettes?” to provide a report of daily consumption, and for the standard HSI, the codes are 0: 1–10 CPD; 1: 11–20 CPD; 2: 21–30 CPD; and 3: 31+ CPD. TTFC was ascertained by “How soon after waking do you usually have your first smoke?” Standard HSI codes are 0: 61+ min; 1: 31–60 min; 2: 6–30 min; and 3: ≤5 min. When summed, they give a scale with a range of 0–6.
In addition to coding the two items as per the standard, called categorical HSI here, we also constructed an alternative continuous transform. CPD was square root transformed to improve normality. For the same reason, TTFC underwent a natural logarithmic transformation. They were combined by subtracting the natural log of minutes to first cigarette from the square root of CPD and adding a constant to eliminate negative values. We describe this measure as the HSI (continuous). The HSI (continuous) has a possible range of around 16: between a 1 CPD smoker who smokes it 16 hr (960 min or 6.87 in log transform) after waking for a score of −5.87 and a 100 CPD smoker who smokes immediately on waking with a score of 10. Adding 6 to eliminate negatives gives a range of up to 16.
Potential moderator variables assessed were the demographic variables: country of origin, sex, and age (18–24, 25–39, 40–54, and 55+ years). Household income and highest level of education attained were equated across the four countries and coded into low, medium, and high.
Outcomes, assessed at the next wave of the survey, were reporting having made a quit attempt of at least 24 hr since the previous wave and among those whether the quit attempt lasted for at least 1 month (medium-term maintenance). Smokers quit for less than 1 month at follow-up were excluded from these analyses because this outcome was not determined.
Analysis
Sets of logistic regression analyses were performed to examine the associations between heaviness of smoking variables measured at one wave, and separately having made a quit attempt, and medium-term maintenance among those who did at the next wave. The two component measures were assessed in one set of analyses and the composite HSI measure in another. We first analyzed the bivariate associations between the given variable and the relevant outcome. Then, we controlled for sociodemographic factors (cohort, country, sex, age, education, and income), and for the analyses using TTFC and CPD, both were added to give estimates of their independent contributions to prediction. We conducted three wave-to-wave replications of the associations. We also checked for interactions with country. As no interactions with country were found, these interaction terms were removed from the final models reported.
We used Nagelkerke’s R2 as the indicator of the predictive power of the measures instead of odds ratios (ORs) for this purpose because ORs are affected by the range of the predictor (i.e., they report change in odds per unit change), and as the continuous measures have around twice the range of the categorical ones, for equal predictive power, they will return ORs closer to unity.
Results
The descriptive statistics for these measures are shown in Table 2, reporting transformed and back-transformed means (where meaningful), with 95% CIs calculated using the transformed data. We also report the mean calculated from the raw data directly to show the difference the transformation process makes. The transformed measures have low skewness and excess in kurtosis (all under 1) compared with skewness scores for the untransformed (raw) measures for CPD on Wave 1 of 3.1 and TTFC of 3.5. For excess in kurtosis, the corresponding scores were 37.6 and 12.8, respectively. The transforms effectively normalize these measures.
Table 2.
Descriptive statistics for TTFC (log), CPD (square root), and HSI
| Measure | Wave | Raw means | Back-transformed meana | Mean of transformed scores (95% CI) | Skewness | Kurtosis |
| TTFC | W1 | 54.0 | 25.3 | 3.23 (3.19–3.26) | .077 | −.142 |
| W2 | 56.8 | 26.8 | 3.29 (3.26–3.32) | −.022 | −.160 | |
| W3 | 51.9 | 24.3 | 3.19 (3.16–3.22) | −.032 | −.083 | |
| W4 | 58.9 | 24.5 | 3.20 (3.16–3.24) | −.083 | −.069 | |
| CPD | W1 | 18.5 | 15.4 | 3.93 (3.91–3.96) | −.148 | .580 |
| W2 | 17.9 | 15.0 | 3.87 (3.84–3.90) | −.210 | .416 | |
| W3 | 17.9 | 15.2 | 3.90 (3.89–3.93) | −.211 | .502 | |
| W4 | 17.7 | 15.5 | 3.94 (3.91–3.97) | −.047 | .854 | |
| HSI | W1 | — | — | 1.61 (1.55–1.66) | −.443 | .123 |
| W2 | — | — | 1.48 (1.42–1.54) | −.395 | .047 | |
| W3 | — | — | 1.63 (1.59–1.69) | −.417 | .188 | |
| W4 | — | — | 1.69 (1.63–1.75) | −.309 | .253 |
Note. CPD = cigarettes per day; HSI = Heaviness of Smoking Index; TTFC = time (mins) to first cigarette upon waking.
Back-transformed means are designed to reconvert the transformed scores into minutes (TTFC) or cigarettes (CPD). As can be seen, these scores are lower than the raw means (especially for TTFC) as they down-weight high values.
The correlation coefficients in Table 3 demonstrate the interwave reliability of both the continuous and the categorical versions of the three heaviness of smoking measures across two, three, and four waves of data collection. The HSI exhibits the highest interwave reliability across all time periods, but the correlations for both CPD and TTFC are only slightly lower. The reliability of all measures decreases slightly over longer time periods, but even across four waves, the measures still show reasonably adequate reliability (all rs > .62).
Table 3.
Interwave reliability of continuous and categorical heaviness of smoking measures
| Continuous | Categorical | |||
| Across two waves | W1–W2 (n = 5,459) | TTFC | .75 | .70 |
| CPD | .76 | .71 | ||
| HSI | .81 | .77 | ||
| W2–W3 (n = 4,356) | TTFC | .73 | .70 | |
| CPD | .77 | .72 | ||
| HSI | .79 | .77 | ||
| W3–W4 (n = 4,376) | TTFC | .73 | .70 | |
| CPD | .74 | .70 | ||
| HSI | .79 | .76 | ||
| Across three waves | W1–W3 (n = 3,535) | TTFC | .72 | .68 |
| CPD | .72 | .68 | ||
| HSI | .78 | .74 | ||
| W2–W4 (n = 3,080) | TTFC | .70 | .67 | |
| CPD | .69 | .68 | ||
| HSI | .75 | .74 | ||
| Across four waves | W1–W4 (n = 2,594) | TTFC | .68 | .63 |
| CPD | .66 | .64 | ||
| HSI | .72 | .70 |
Note. CPD = cigarettes per day; HSI = Heaviness of Smoking Index; TTFC = time (mins) to first cigarette after waking; W = wave.
All reported correlations are highly significant (p < .0001). Sample sizes are approximate with <0.1% missing data on any comparison. Samples restricted to daily smokers on both waves due to problems in computing TTFC in non–daily smokers.
Table 4 shows that all three measures (TTFC, CPD, and combined as HSI), in both categorical and continuous forms, were predictive of making quit attempts with higher dependence scores being associated with reduced likelihood of a subsequent quit attempt. The effect for HSI remained even after controlling for sociodemographics. In the adjusted analyses for the two measures predicting together, both remained significant for the categorical version, but for the continuous version, in two of the three cases, TTFC became nonsignificant. The data for the continuous measure, broken down by interval, are graphed in Figure 1a and 1b. There is some evidence of a step effect for TTFC at around four in log transform units, which translates to just under an hour (i.e., close to the upper cutoff for the categorical measure). That is, for TTFC below an hour (Categories 1–3), where most cases lie, the probability of a subsequent quit attempt appears close to constant and is higher and constant from an hour or more (Category 0). As shown by the R2 estimates, the two types of measures had similar predictive power, and the HSI as a combined measure performed comparably with its two components when used separately.
Table 4.
Predicting quit attempts at wave N + 1 using measures from wave N: CPD (square root) and TTFC (natural log)
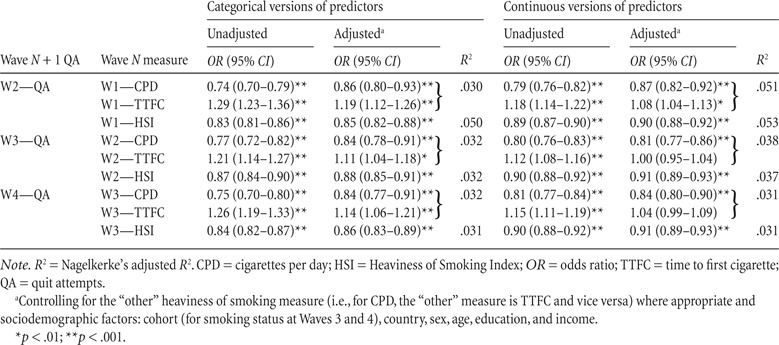 |
Figure 1.
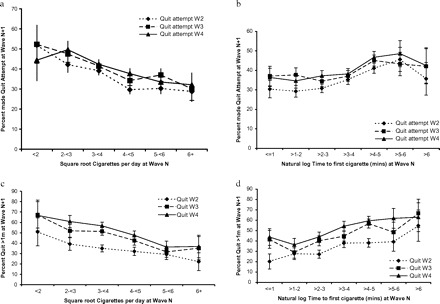
Percent making quit attempts (a and b) and quit success (c and d) as a function of cigarettes per day (square root) and time to first cigarette (natural log). For quit attempts and quit success, the lower level at Wave 2 is because the W1–W2 intersurvey interval was shorter (around 7 months) than for the other two waves (13–14 months).
Table 5 shows the results of the regression analyses using the categorical and continuous versions of the measures. High HSI predicted failure to maintain quit attempts made by the following wave in all three replications. Similarly, for all three waves, both CPD and TTFC independently predicted maintenance at the following wave, such that a higher number of CPD and less TTFC after waking both decreased the likelihood of maintaining the attempt for the criterion time. Additional regression analyses including interactions between CPD and TTFC revealed no significant interactive effects. Figure 1c and 1d show the effects are close to linear (with the appropriate transform). Again, the variance accounted for estimates do not show clear differentiation between the two ways of calculating the measures or the use of the composite HSI versus the use of the components separately.
Table 5.
Predicting sustained quitting (quit > 1 month) at wave N + 1 using dependence measures from wave N
| Wave N + 1 quit (>1 month) | Wave N measure | Categorical versions of predictors |
Continuous versions of predictors |
||||
| Unadjusted | Adjusteda | R2 | Unadjusted | Adjusteda | R2 | ||
| OR (95% CI) | OR (95% CI) | OR (95% CI) | OR (95% CI) | ||||
| W2—quit | W1—CPD | 0.69 (0.62–0.76)** | 0.84 (0.74–0.96)* | .066 | 0.73 (0.69–0.78)** | 0.84 (0.77–0.92)** | .079 |
| W1—TTFC | 1.46 (1.34–1.59)** | 1.33 (1.20–1.48)** | 1.34 (1.26–1.42)** | 1.19 (1.10–1.29)** | |||
| W1—HSI | 0.78 (0.74–0.82)** | 0.79 (0.74–0.83)** | .065 | 0.85 (0.82–0.87)** | 0.85 (0.82–0.88)** | .080 | |
| W3—quit | W2—CPD | 0.60 (0.54–0.67)** | 0.71 (0.62–0.81)** | .105 | 0.74 (0.69–0.79)** | 0.81 (0.74–0.88)** | .099 |
| W2—TTFC | 1.47 (1.35–1.60)** | 1.24 (1.12–1.37)** | 1.29 (1.21–1.37)** | 1.12 (1.04–1.21)* | |||
| W2—HSI | 0.75 (0.71–0.79)** | 0.76 (0.72–0.81)** | .104 | 0.85 (0.82–0.88)** | 0.86 (0.83–0.89)** | .099 | |
| W4—quit | W3—CPD | 0.61 (0.55–0.68)** | 0.72 (0.63–0.82)** | .091 | 0.71 (0.66–0.77)** | 0.76 (0.69–0.84)** | .097 |
| W3—TTFC | 1.47 (1.35–1.61)** | 1.27 (1.14–1.41)** | 1.30 (1.22–1.38)** | 1.12 (1.04–1.21)* | |||
| W3—HSI | 0.75 (0.71–0.80)** | 0.76 (0.72–0.80)** | .090 | 0.84 (0.81–0.87)** | 0.84 (0.81–0.87)** | .095 | |
Note. CPD = cigarettes per day; HSI = Heaviness of Smoking Index; OR = odds ratio; TTFC = time to first cigarette.
Controlling for the “other” heaviness of smoking measure (i.e., for CPD, the “other” measure is TTFC and vice versa) where appropriate and socio-demographic factors: cohort (for smoking status at Waves 3 and 4), country, sex, age, education, and income.
R2 = Nagelkerke’s adjusted R2.
*p < .01; **p < .001.
Discussion
These results show that both TTFC and CPD are independent predictors of quitting outcomes, although their predictive power overlaps somewhat. For predicting maintenance of a quit attempt for at least 1 month, the combined HSI measure worked as well as the two items separately, and the continuous measure was not clearly superior to the categorical one. The same pattern was found for making quit attempts.
The findings for medium-term maintenance are clear evidence of the validity of the HSI and its components as indicators of dependence; however, none of the measures has a strong predictive relationship. The data presented show that the relationship is broadly linear as a function of the transformed measures. This aspect of dependence clearly has a continuous linear relationship with quit maintenance, at least out to 1 month. The finding on predictive capacity for quit attempts suggest a predictive utility for these measures beyond dependence. We suspect that the relationship is due to smokers being less likely to try to quit if they think they are more dependent (presumably based at least in part on their knowledge of their habit) coupled with a reluctance to do something where failure is likely.
The study demonstrates that the categorical scoring method is likely to be adequate for many purposes; however, there may be marginal utility in using the continuous version where it is available as it allows stronger conclusions to be drawn about the nature of the relationship. One other advantage is that if the relative meaning of levels of consumption changes as a result of reduced opportunities to smoke (e.g., result of smoke-free policy; Husten, 2009), there does not have to be a recalibration of the measure by setting new cutpoints for the categories. However, there are disadvantages. Some smokers find making these estimates difficult, and in self-completion surveys, more complete data may be generated by providing categories such that only those consuming or smoking their first cigarette close to category borders will need to think much about which answer best fits them.
In our study, we found monotonic reducing rates of quit success with increasing HSI rather than the curvilinear effect found by Chaiton et al. (2007). We are not sure of the reason for the difference in findings. Chaiton et al. conducted their analyses on the whole sample of smokers rather than separating quit attempts from success among those making attempts, but as we found similar relationships for both, it cannot explain the differences. Our sample includes a Canadian component, so it is also unlikely that differences in the population account for the difference in findings.
Our study used prediction over periods ranging from around 7 to 14 months. We do not know whether the findings would be similar across shorter and longer intervals. In this study, we have not pursued the predictive power of the measures beyond the next wave. We refrained both for reasons of simplicity and because most studies have limited follow-ups, and thus, the prediction of measures taken at one wave for outcomes in the period to follow-up is normative. Given the consistency of the measures across waves, we have little doubt that the measures taken several waves before would have predictive value.
In conclusion, we find evidence that both TTFC and CPD are predictive of quitting outcomes but that little predictive power is lost by combining them over using them individually. How they are used and indeed which method of measuring them does not appreciably alter their utility.
Funding
This research was funded by grants from the National Cancer Institute of the United States (R01 CA 100362), the Roswell Park Transdisciplinary Tobacco Use Research Center (P50 CA111236), Robert Wood Johnson Foundation (045734), Canadian Institutes of Health Research (57897 and 79551), National Health and Medical Research Council of Australia (265903 and 450110), Cancer Research UK (C312/A3726), and Canadian Tobacco Control Research Initiative (014578), with additional support from the Centre for Behavioural Research and Program Evaluation, National Cancer Institute of Canada/Canadian Cancer Society.
Declaration of Interests
None declared.
Ethics Clearance
The study protocol was approved by the institutional review boards or research ethics boards of the University of Waterloo (Canada), Roswell Park Cancer Institute (USA), University of Strathclyde (UK), University of Stirling (UK), The Open University (UK), and The Cancer Council Victoria (Australia).
References
- Baker TB, Piper ME, McCarthy DE, Bolt DM, Smith SS, Kim S, et al. Time to first cigarette in the morning as an index of ability to quit smoking: Implications for nicotine dependence. Nicotine & Tobacco Research. 2007;9(Suppl. 4):555–570. doi: 10.1080/14622200701673480. [DOI] [PMC free article] [PubMed] [Google Scholar]
- Borland R, Owen N. Need to smoke in the context of workplace smoking bans. Preventive Medicine. 1995;24:56–60. doi: 10.1006/pmed.1995.1008. [DOI] [PubMed] [Google Scholar]
- Chaiton MO, Cohen JE, McDonald PW, Bondy SJ. The Heaviness of Smoking Index as a predictor of smoking cessation in Canada. Addictive Behaviours. 2007;32:1031–1042. doi: 10.1016/j.addbeh.2006.07.008. [DOI] [PubMed] [Google Scholar]
- Fong GT, Cummings KM, Borland R, Hastings G, Hyland A, Giovino GA, et al. The conceptual framework of the international tobacco control (ITC) policy evaluation project. Tobacco Control. 2006;15(Suppl. 3):3–11. doi: 10.1136/tc.2005.015438. [DOI] [PMC free article] [PubMed] [Google Scholar]
- Heatherton TF, Kozlowski LT, Frecker RC, Fagerstrom K. The Fagerstrom Test for Nicotine Dependence: A revision of the Fagerstrom Tolerance Questionnaire. British Journal of Addiction. 1991;86:1119–1127. doi: 10.1111/j.1360-0443.1991.tb01879.x. [DOI] [PubMed] [Google Scholar]
- Heatherton TF, Kozlowski LT, Frecker RC, Rickert W, Robinson J. Measuring the heaviness of smoking: Using self-reported time to the first cigarette of the day and number of cigarettes smoked per day. Addiction. 1989;84:791–800. doi: 10.1111/j.1360-0443.1989.tb03059.x. [DOI] [PubMed] [Google Scholar]
- Husten CG. How should we define light or intermittent smoking? Does it matter? Nicotine & Tobacco Research. 2009;11:111–121. doi: 10.1093/ntr/ntp010. [DOI] [PMC free article] [PubMed] [Google Scholar]
- Hyland A, Borland R, Yong H-H, McNeill A, Fong G, O’Connor R, et al. Individual level predictors of cessation behaviours among participants in the International Tobacco Control (ITC) Four Country Survey. Tobacco Control. 2006;15(Suppl. 3):83–94. doi: 10.1136/tc.2005.013516. [DOI] [PMC free article] [PubMed] [Google Scholar]
- IARC. IARC Handbooks of Cancer Prevention: Tobacco Control, Volume 12. Methods for Evaluating Tobacco Control Policies. In: Borland R, Cummings KM, editors; Leon-Roux M, editor. Lyon, France: International Agency for Research on Cancer; 2008. Section 3.3. [Google Scholar]
- Thompson M, Fong GT, Hammond D, Boudreau C, Driezen P, Hyland A, et al. The methodology of the International Tobacco Control (ITC) four-country survey. Tobacco Control. 2006;15(Suppl. 3):12–18. doi: 10.1136/tc.2005.013870. [DOI] [PMC free article] [PubMed] [Google Scholar]