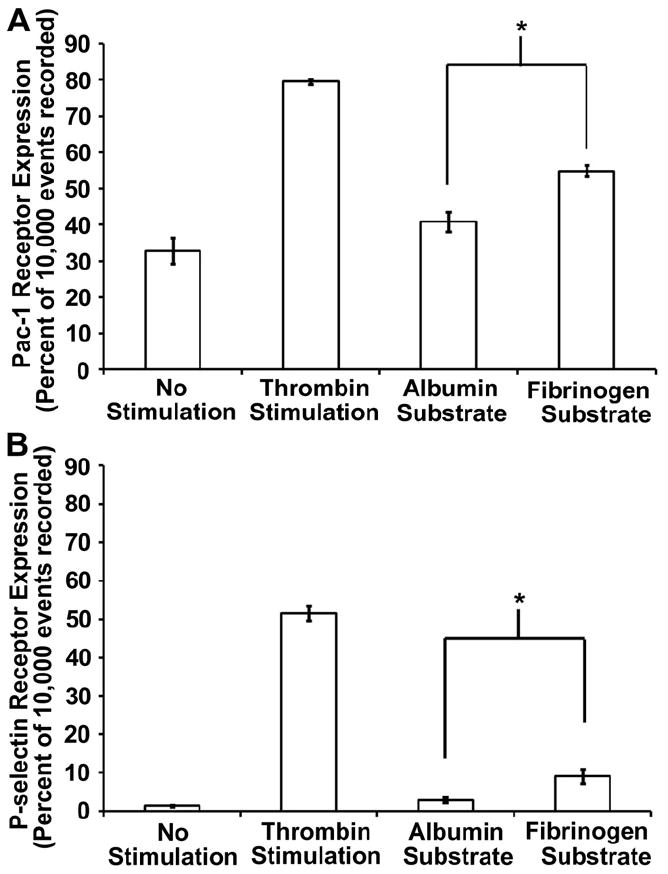
Fig. 5.

Flow cytometry analysis of bulk platelet activation. (A) Pac-1 and (B) P-selectin expression were quantified on washed platelets following perfusion over both an albumin and a fibrinogen substrate. These samples were also compared with unstimulated (negative control) and thrombin stimulated (positive control) samples collected prior to perfusion. Samples (n = 4) represent the average percent of platelets expressing each receptor out of out of 10,000 recorded events. The error bars represent the standard error of the mean calculated from a 95% confidence interval.
