

Abstract
Neurons express multiple types of voltage-gated calcium (Ca2+) channels. Two subtypes of neuronal L-type Ca2+ channels are encoded by CaV1.2 and CaV1.3 pore-forming subunits. To compare targeting of CaV1.2 and CaV1.3 L-type Ca2+ channels, we transfected rat hippocampal neuronal cultures with surface-epitope-tagged sHA-CaV1.2 or sHA-CaV1.3a constructs and found that: (i) both sHA-CaV1.2 and sHA-CaV1.3a form clusters on the neuronal plasma membrane surface; (ii) when compared with sHA-CaV1.2 surface clusters, the sHA-CaV1.3a surface clusters were 10% larger and 25% brighter, but 35% less abundant; (iii) 81% of sHA-CaV1.2 surface clusters, but only 48% of sHA-CaV1.3a surface clusters, co-localized with synapsin clusters; (iv) co-expression with GFP-Shank-1B had no significant effect on sHA-CaV1.2 surface clusters, but promoted formation and synaptic localization of sHA-CaV1.3a surface clusters. In experiments with dihydropyridine-resistant CaV1.2 and CaV1.3a mutants we demonstrated that CaV1.3a L-type Ca2+ channels preferentially mediate nuclear pCREB signaling in hippocampal neurons at low, but not at high, levels of stimulation. In experiments with primary neuronal cultures from CaV1.3 knockout mice we discovered that CaV1.3 channels play a more important role in pCREB signaling in striatal medium spiny neurons than in hippocampal neurons. Our results provide novel insights into the function of CaV1.2 and CaV1.3 L-type Ca2+ channels in the brain.
Keywords: calcium channels, CREB, postsynaptic density, synapse, synaptic plasticity
Introduction
Voltage-dependent calcium (Ca2+) channels are important mediators of neuronal function. Neuronal Ca2+ channels trigger neurotransmitter release, generate dendritic Ca spikes and induce activity-dependent gene regulation. Consistent with multiple functions, neurons express a diverse complement of voltage-gated calcium (Ca2+) channels (Catterall, 2000). N-type (CaV2.2) and P / Q-type (CaV2.1) Ca2+ channels mediate rapid Ca2+ influx into the presynaptic terminal that triggers synaptic vesicle fusion and neurotransmitter release (Dunlap et al., 1995) (excitation–secretion coupling). Neuronal L-type Ca2+ channels are mainly encoded by CaV1.2 (α1C) or CaV1.3 (α1D) pore-forming subunits (Hell et al., 1993; Lipscombe et al., 2004). Neuronal L-type Ca2+ channels do not support synaptic transmission, but play a critical role in coupling neuronal activity to gene transcription (excitation–transcription coupling). It has been shown that Ca2+ influx via postsynaptic L-type Ca2+ channels activates pCREB (Bito et al., 1996; Dolmetsch et al., 2001; Weick et al., 2003; Zhang et al., 2005a) and NFATc4 (Graef et al., 1999) neuronal nuclear transcription factors. Phosphorylation of CREB, acting in conjunction with nuclear translocation of pCREB co-activator TORC (Conkright et al., 2003; Iourgenko et al., 2003; Bittinger et al., 2004; Screaton et al., 2004), promotes transcription of multiple genes (Zhang et al., 2005b). Resulting changes in protein expression may play a role in mediating long-term changes in synaptic strength (Deisseroth et al., 2003).
When compared with channels encoded by the CaV1.2 subunit, the channels encoded by CaV1.3 subunits are less sensitive to dihydropyridines and open at more negative membrane potentials (Koschak et al., 2001; Xu & Lipscombe, 2001; Lipscombe et al., 2004; Olson et al., 2005). Knockout of the CaV1.2 gene leads to embryonic death before day E14.5 (Seisenberger et al., 2000), whereas CaV1.3 knockout mice survive but display congenital deafness and dysfunction of pancreatic β-cell and cardiac sinoatrial node (Platzer et al., 2000; Namkung et al., 2001; Zhang et al., 2002; Mangoni et al., 2003). Immunostaining analysis revealed that neuronal CaV1.2 and CaV1.3 are localized mainly in neuronal cell bodies and proximal dendrites, and can be detected in both synaptic and extrasynaptic compartments (Hell et al., 1993; Davare et al., 2001; Weick et al., 2003; Obermair et al., 2004; Zhang et al., 2005a).
The CaV1.2 (α1C) subunit contains a class 1 PDZ domain-binding carboxy-terminal motif VSXL that has been shown to associate with PDZ domains of NIL-16 (neuronal interleukin-16 precursor protein) (Kurschner & Yuzaki, 1999) and CIPP (channel-interacting PDZ domain protein) (Kurschner et al., 1998). Association of the CaV1.2 subunit with PDZ proteins plays an important role in coupling L-type Ca2+ channel activity with phosphorylation of nuclear CREB (Weick et al., 2003). The carboxyl-terminal region of the CaV1.3 subunit is alternatively spliced (Safa et al., 2001; Xu & Lipscombe, 2001). The ‘long’ CaV1.3a splice-variant also contains a class 1 PDZ domain-binding carboxy-terminal motif ITTL, which associates with the PDZ domain of Shank adaptor protein (Zhang et al., 2005a). Our previous studies demonstrated that association of CaV1.3a with Shank is important for synaptic targeting of CaV1.3-encoded L-type Ca2+ channels, for signaling from CaV1.3 channels to pCREB in hippocampal neurons and for G-protein-coupled receptor-mediated modulation of L-type currents in medium spiny striatal neurons (Olson et al., 2005; Zhang et al., 2005a).
Is there a difference in CaV1.2 and CaV1.3 localization pattern and targeting mechanisms in hippocampal neurons? What is a relative contribution of CaV1.2 and CaV1.3 L-type Ca2+ channels to neuronal pCREB signaling? Finding answers to these questions is the main aim of our study. To compare targeting of CaV1.2 and CaV1.3 L-type Ca2+ channels in a precise and quantitative way we adapted an approach from Obermair et al. (2004) and performed targeting experiments with surface epitope-tagged sHA-CaV1.2 and sHA-CaV1.3 subunits expressed in primary hippocampal neuronal cultures. To compare the contribution of CaV1.2 and CaV1.3 L-type Ca2+ channels to pCREB signaling, we adapted a ‘pharmacological knockout’ approach from Dolmetsch et al. (2001) and performed experiments with dihydropyridine-resistant (DHPR) CaV1.2 and CaV1.3a mutants expressed in hippocampal neurons. Obtained results were complemented by analysis of pCREB signaling in hippocampal and medium spiny striatal neuronal cultures from CaV1.3 knockout mice (Platzer et al., 2000).
Materials and methods
Plasmid construction
sHA-CaV1.2 plasmid has been previously described (Altier et al., 2002). In sHA-CaV1.2 construct the HA tag and the flanking sequences were inserted into extracellular S5-H5 loop of domain II of rat CaV1.2 plasmid between amino acids Q683 and T684. The resulting sequence is 677FNFDEMQTRHYPYDVPDYAVTFDEMQTRRSTFD690 (HA sequence is in bold, added sequence is italic) (Altier et al., 2002). To generate the sHA-CaV1.3a construct we followed the same paradigm and inserted the HA tag and identical flanking sequences into the equivalent location within a rat CaV1.3a plasmid (Xu & Lipscombe, 2001) (between amino acids Q693 and T694). The HA tag and flanking sequences were inserted by polymerase chain reaction (PCR) followed by 3-end ligation using NheI (5′ end) and BamH1 (2751) sites and verified by sequencing. The resulting sequence was 687FNFDETQTRHYPYDVPDYAVTFDEMQTKRSTFD700 (HA sequence is in bold, added sequence is italic). The HA-CaV1.3a-T1033Y DHP-resistant construct was previously described (Zhang et al., 2005a). The sHA-CaV1.2-T1039Y DHP-resistant mutant (He et al., 1997; Dolmetsch et al., 2001) was generated on the basis of sHA-CaV1.2 plasmid by Quick-change kit (Stratagene) and verified by sequencing. The GFP-Shank1B construct was previously described (Sala et al., 2003).
Current recordings in Xenopus oocytes
sHA-CaV1.2 and sHA-CaV1.3a subunits were expressed in Xenopus oocytes as previously described (Bezprozvanny & Tsien, 1995; Zhang et al., 2005a). Briefly, cRNA species encoding sHA-CaV1.2 and sHA-CaV1.3a subunits, β3 and α2δ-1 subunits were synthesized by in vitro transcription procedure with the use of bacteriophage T7 RNA polymerase. Single-stage V–VI Xenopus oocytes were prepared by collagenase A treatment and injected with cRNA mixtures as indicated in the text. Currents were recorded 4–5 days after cRNA injection in 40 mm Ba2+ recording solution [in mm: Ba(OH)2, 40; TEA-OH, 50; KOH, 2; HEPES, 5; adjusted to pH 7.4 with methanesulphonic acid] by two-electrode voltage-clamp amplifier (Model OC-725A, Warner Instruments) controlled by pClamp6 software (Axon Instruments). Ca2+ channel openings were induced by 250-ms step depolarizations from a holding potential of −80 mV to a range of test potentials as indicated in the text. Collected data were analysed off-line using pClamp6 software.
Primary neuronal cultures
Primary E18 rat hippocampal neuronal cultures were established and maintained in vitro as previously described (Maximov & Bezprozvanny, 2002; Zhang et al., 2005a). The animals were anaesthetized with CO2 and decapitated, procedures were approved by the IUCAC committee. For targeting experiments primary hippocampal neuronal cultures at 8–9 days in vitro (DIV) were co-transfected with sHA-CaV1.2 or sHA-CaV1.3 plasmids with β3 and α2δ-1 auxiliary subunits using calcium phosphate method as previously described (Maximov & Bezprozvanny, 2002; Zhang et al., 2005a). The GFP-Shank1B plasmid was included in the transfection mixture when indicated. The generation and breeding of CaV1.3 knockout mice was previously described (Platzer et al., 2000; Olson et al., 2005). In our experiments, male CaV1.3− / − mice were bred to CaV1.3+ / − female mice, and resulting litters were collected at P1–P2. Collected pups were genotyped by PCR and separated into CaV1.3− / − (KO) and CaV1.3+ / − (HET) groups. The hippocampal neuronal cultures from P1–P2 CaV1.3 KO and HET pups were established following the same procedures as for rat, and used for experiments at 9–10 DIV. The striatal medium spiny neuronal (MSN) cultures from CaV1.3 KO and HET P1–P2 pups were established as we previously described for YAC128 HD mice (Tang et al., 2005) and used for experiments at 9–10 DIV.
Immunocytochemistry
Immunostaining experiments with primary hippocampal neuronal cultures have been performed as previously described (Maximov & Bezprozvanny, 2002; Zhang et al., 2005a). For HA surface labeling experiments the neurons were fixed in 4% formaldehyde and 4% sucrose in phosphate-buffered saline (PBS) on ice for 30 min, washed twice with PBS, incubated with blocking solution containing 10% normal goat serum and 5% bovine serum albumin in PBS, and incubated with mouse anti-HA mAb (1 : 1000) for 2–3 h at room temperature, washed with PBS three times, permeabilized with 0.25% Triton in PBS for 5 min, incubated in blocking solution again, and then incubated with rabbit anti-MAP2 pAb (1 : 1000) or rabbit anti-synapsin pAb (1 : 1000) overnight at 4 °C. For anti-HA mAb staining of permeabilized neurons, fixed neurons were permeabilized with 0.25% Triton in PBS for 5 min and labeled with anti-HA mAb (1 : 1000) and rabbit anti-MAP2 pAb (1 : 1000) antibodies for 2–3 h at the same time. The coverslips with stained neurons were washed three times with PBS, incubated with rhodamine- and FITC-conjugated anti-mouse and anti-rabbit secondary antibodies at room temperature for 1 h, washed three times with PBS and mounted on microscopic slides. The images were collected with an Olympus IX-71 microscope with 40 × objective by Cascade-650 camera (Rhoper) and analysed using MetaFluor 6.2 (Universal Imaging) and PhotoShop (Adobe) software packages. Confocal images were collected with Zeiss LS800 (Zeiss, Thornwood, NY, USA).
Quantification of size and intensity of HA and synapsin fluorescent clusters was performed with MetaFluor 6.2 (Universal Imaging) software. The clusters were selected initially using the autotrace function of MetaFluor and then manually inspected. The same settings were used for selection and analysis of sHA-CaV1.2 and sHA-CaV1.3a clusters. Clusters that appear to be composed of multiple puncta and out of focus clusters were discarded. The area (in pixels2) and brightness (in a.u.) of each remaining cluster were recorded by MetaFluor, and cumulative distributions of clusters area and brightness were constructed in Origin. The measurements from at least 100–300 puncta (obtained from neurons from at least two independent transfections) have been used to construct cumulative area and brightness distributions. The midpoints of cumulative distributions were determined in Origin. To quantify the co-localization of HA and synapsin clusters, the HA and synapsin clusters that had at least one pixel in common were scored as ‘co-localized’.
Ca2+ imaging experiments
Ca2+ imaging experiments with primary hippocampal neuronal cultures were performed as previously described (Zhang et al., 2005a). Briefly, primary hippocampal neuronal cultures at 8–10 DIV were co-transfected with sHA-CaV1.2-T1039Y or HA-CaV1.3a- T1033Y plasmids with β3 and α2δ-1 auxiliary subunits and pEGFP-C3 plasmid (Clontech) using the calcium phosphate precipitation method as previously described (Zhang et al., 2005a). Seventy-two hours after transfection the neurons were loaded with 5 μm Fura-2 AM (Molecular Probes), and coverslips with neurons were mounted onto a recording / perfusion chamber (RC-26G, Warner Instrument) positioned on the movable stage of an Olympus IX-70 inverted microscope. The transfected cells were identified by GFP imaging. Following GFP imaging the neurons were perfused with Tyrode solution in the presence of (in μm): tetrodotoxin (TTX), 1; D-AP5, 50; CNQX, 10; nifedipine, 50; and stimulated for 60 s by application of KCl-depolarizing solution (in mm: KCl, 20; KCl, 45; KCl, 90) in Tyrode in the presence of (in μm): TTX, 1; D-AP5, 50; CNQX, 10; nifedipine, 50. In Ca2+ imaging experiments the hippocampal neurons were intermittently excited by 340 nm and 380 nm UV light (DeltaRAM illuminator, PTI) using Fura-2 dichroic filter cube (Chroma Technologies) and 60 × UV-grade oil-immersed objective (Olympus). The emitted light was collected by an IC-300 camera (PTI), and the images were digitized by ImageMaster Pro software (PTI). Baseline (6 min) measurements were obtained prior to KCl stimulation. Images at 340 and 380 nm excitation wavelengths were captured every 5 s and the peak value was measured. Background fluorescence was determined according to manufacturer’s (PTI) recommendations and subtracted. The peak 340 / 380 values were measured for each transfected cell and averaged.
pCREB phosphorylation assay
For pCREB experiments primary hippocampal neuronal cultures at 8–10 DIV were co-transfected with sHA-CaV1.2-T1039Y or HA-CaV1.3a-T1033Y plasmids with β3 and α2δ-1 auxiliary subunits using the calcium phosphate precipitation method as previously described (Zhang et al., 2005a). Seventy-two hours after transfection the neurons were incubated in Tyrode solution in the presence of (in μm): TTX, 1; D-AP5, 50; CNQX, 10; nifedipine, 50; in the dark for 3 h, stimulated for 30 s by application of KCl-depolarizing solution (in mm: KCl, 20; KCl, 45; KCl, 90) in Tyrode solution in the presence of (in μm): TTX, 1; D-AP5, 50; CNQX, 10; nifedipine, 50; fixed, permeabilized and stained with anti-pCREB pAb and anti-HA mAb. In electrical field stimulation (EFS) experiments, the neurons were transferred to Tyrode solution containing (in μm): D-AP5, 50; nifedipine, 50; bicuculline, 20; and stimulated at 5 Hz frequency by current pulses of 0.5-mA amplitude and 150-μs duration (WPI A365 stimulator controlled by Neurolog Digitimer) applied via a pair of platinum electrodes as previously described (Zhang et al., 2005a). Transfected cells were identified by anti-HA mAb staining, and nuclear pCREB pAb staining of transfected neurons was quantified by confocal imaging (Zeiss LS800). The intensity of nuclear pCREB staining in each series of experiments was normalized to mean pCREB signal in unstimulated cells and averaged across different experiments. Primary mice hippocampal and MSN neuronal cultures were stimulated as described above for rat neurons at 9–10 DIV without the addition of nifedipine.
Antibodies
Anti-HA mAb was from Covance (Berkeley, CA, USA), anti-MAP2 mAb and pAb were from Chemicon (Temecula, CA, USA). Anti-pCREB rabbit pAb was from Upstate Biotechnology (Lake Placid, NY, USA). The rabbit anti-synapsin pAb (IB2881) was raised against KLH-conjugated NYLRRRLSDSNFMANLPNGYMTDLQRPQP peptide corresponding to the amino-terminus of Synapsin1.
Results
Targeting of recombinant sHA-CaV1.2 and sHA-CaV1.3a in rat hippocampal neurons
Subcellular localization of endogenous CaV1.2 and CaV1.3 subunits in hippocampal neurons have been described in several previous reports (Hell et al., 1993; Davare et al., 2001; Weick et al., 2003; Obermair et al., 2004; Zhang et al., 2005a). These studies consistently reported clustered distribution of endogenous CaV1.2 and CaV1.3 subunits in soma and proximal dendrites of mature hippocampal neurons. They also suggested that the clusters formed by endogenous CaV1.2 and CaV1.3 subunits are partially co-localized with established synaptic markers (Davare et al., 2001; Weick et al., 2003; Obermair et al., 2004; Zhang et al., 2005a). Is there a difference in CaV1.2 and CaV1.3 localization pattern in neurons? These questions are difficult to address for endogenous channels because the level of endogenous channel expression is quite low and sensitivity of antibodies against endogenous channels is limited. Thus, we reasoned that expression of epitope-tagged CaV1.2 and CaV1.3 subunits will enable us to compare the localization patterns of these channels in a more precise and quantitative way. Insertion of the HA tag into the extracellular surface loop connecting S5 and H5 regions of domain II of CaV1.2 channels enables plasma membrane surface labeling of sHA-CaV1.2 subunits (Altier et al., 2002; Obermair et al., 2004). To compare targeting of recombinant CaV1.2 and CaV1.3 channels we obtained a rat sHA-CaV1.2 construct (Fig. 1A, left) (Altier et al., 2002; Obermair et al., 2004) and generated a sHA-CaV1.3a construct (Fig. 1A, right) by inserting an HA tag into the equivalent position of rat CaV1.3a sequence (see Materials and methods for details). We reasoned that the use of the same HA epitope tag with identical flanking sequences inserted into equivalent positions of rat CaV1.2 and CaV1.3 subunits should minimize experimental variability and enable quantitative comparison of CaV1.2 and CaV1.3 targeting patterns.
Fig. 1.

Surface-epitope-tagged sHA-CaV1.2 and sHA-CaV1.3a targeting constructs. (A) The diagrams of sHA-CaV1.2 (Altier et al., 2002) and sHA-CaV1.3a targeting constructs. The locations of surface HA epitope insertion in both constructs are shown. Also shown are carboxy-terminal PDZ domain-binding consensus – VSNL in CaV1.2 (Kurschner et al., 1998; Kurschner & Yuzaki, 1999; Weick et al., 2003) and –ITTL in CaV1.3a (Zhang et al., 2005a). (B) Confocal images of HEK293 cells transfected with sHA-CaV1.2 and sHA-CaV1.3a constructs and stained with anti-HA mAb without permeabilization (surf) and with permeabilization (perm). Two different transfection experiments yielding similar results are illustrated in (B). (C and D) Current–voltage relationships of currents supported by sHA-CaV1.2 (C) and sHA-CaV1.3a (D) channels co-expressed in Xenopus oocytes with β3 and α2δ-1 subunits. The holding potential was −80 mV. The peak currents in (C and D) are shown as mean ± SEM (n ≥ 3 oocytes for each test potential).
Plasma membrane targeting of sHA-CaV1.2 and sHA-CaV1.3a subunits was confirmed by confocal imaging of transfected HEK293 cells surface-labeled with anti-HA mAb (Fig. 1B). To confirm functional expression of generated constructs, we co-injected sHA-CaV1.2 or sHA-CaV1.3a cRNA with β3 and α2δ-1 cRNA into Xenopus oocytes and performed a series of two-electrode voltage-clamp experiments using 40 mm Ba2+ as a current carrier (see Materials and methods for details). Consistent with the previous report (Altier et al., 2002), we found that sHA-CaV1.2 protein forms functional channels in Xenopus oocytes (Fig. 1C). The sHA-CaV1.3a construct also supported functional channels when expressed in Xenopus oocytes (Fig. 1D). Peak current amplitudes were equal to 0.40 ± 0.05 μA (n = 13) for currents supported by sHA-CaV1.2 and 0.08 ± 0.02 μA (n = 4) for currents supported by sHA-CaV1.3a. Thus, in our experiments sHA-CaV1.2 expressed in Xenopus oocytes ~fivefold more efficiently than sHA-CaV1.3a. In agreement with previous characterization of CaV1.3 channels (Koschak et al., 2001; Xu & Lipscombe, 2001; Olson et al., 2005), we found that the channels supported by sHA-CaV1.3a opened at ~20 mV more negative voltages than the channels supported by sHA-CaV1.2 (Fig. 1C and D).
To analyse targeting of L-type channels in neurons, we co-expressed sHA-CaV1.2 or sHA-CaV1.3a subunits with β3 and α2δ-1 subunits in mature hippocampal neurons cultured at high density and evaluated subcellular localization of expressed channels by immunostaining with anti-HA mAb (see Fig. 2). As in our previous studies of Ca2+ channel targeting (Maximov & Bezprozvanny, 2002; Zhang et al., 2005a), we reasoned that expression of pore-forming α1 subunits with auxiliary β3 and α2δ-1 subunits will facilitate proper assembly and trafficking of channel complexes. Targeting of Ca2+ channels in hippocampal neurons was reported to be influenced by co-expression with β4 subunit (Wittemann et al., 2000; Herlitze et al., 2003). However, because the same β3 and α2δ-1 auxiliary subunits are used in all our experiments, the differences in targeting of L-type Ca2+ channels formed by sHA-CaV1.2 or sHA-CaV1.3a channels are due to targeting motifs in α1 subunits and not due to effects of auxiliary subunits. Consistent with the previous results (Obermair et al., 2004), expression of the sHA-CaV1.2 construct in hippocampal neurons resulted in clusters of HA immunoreactivity in surface-labeling experiments (Fig. 3A). Recombinant sHA-CaV1.3a also formed clusters in surface labeling experiments (Fig. 3B), similar to clusters formed by HA-CaV1.3a subunits tagged at the amino-terminal region (Zhang et al., 2005a).
Fig. 2.

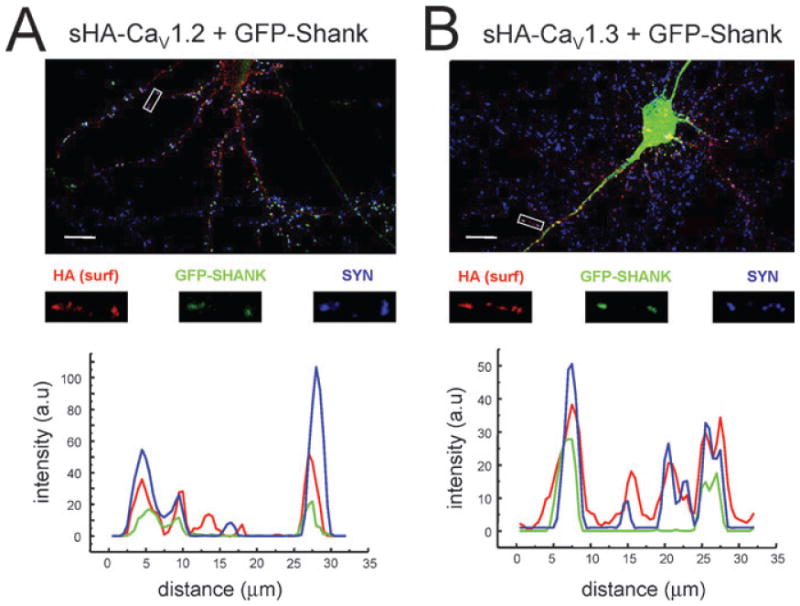
Synaptic targeting of recombinant sHA-CaV1.2 and sHA-CaV1.3a L-type Ca2+ channels in hippocampal neurons. Hippocampal neurons were transfected with sHA-CaV1.2 or sHA-CaV1.3a constructs together with β3 and α2δ-1 auxiliary subunits at 8–9 DIV and analysed 72 h after transfection by HA mAb surface labeling (red) and synapsin pAb (green) immunostaining. Scale bars, 40 μm. Magnified regions and profile scans are shown below for each panel as indicated. The data are representative of three independent transfection experiments with sHA-CaV1.2 and sHA-CaV1.3a constructs.
Fig. 3.

Surface targeting of recombinant sHA-CaV1.2 and sHA-CaV1.3a L-type Ca2+ channels in hippocampal neurons. Hippocampal neurons were transfected with sHA-CaV1.2 (A) or sHA-CaV1.3a (B) constructs together with β3 and α2δ-1 auxiliary subunits at 10 DIV and analysed 72 h after transfection by HA mAb surface labeling (red) and MAP2 pAb (green) immunostaining. Scale bars, 40 μm. Magnified regions are shown below for each panel as indicated. The data are representative of four independent transfection experiments with sHA-CaV1.2 and sHA-CaV1.3a constructs.
The study by Obermair et al. (2004) suggested that membrane-inserted sHA-CaV1.2 channels are clustered but intracellular sHA-CaV1.2 channels are diffusely distributed. To test this hypothesis, we compared the HA staining of hippocampal neurons transfected with sHA-CaV1.2 construct with and without permeabilization with Triton X-100. In agreement with Obermair et al. (2004) we found that sHA-CaV1.2 clusters can be easily detected in non-permeabilized hippocampal neurons (Fig. 3A), but in permeabilized hippocampal neurons sHA-CaV1.2 is mostly diffuse (Fig. 4A). Interestingly, the difference induced by Triton X-100 permeabilization was much less dramatic for hippocampal neurons transfected with sHA-CaV1.3a construct (Figs 3B and 4B). These results indicate that trafficking of CaV1.2 and CaV1.3a channels is likely to be mediated by different cell biological pathways. These data also explain why we observed clustered distribution of HA-CaV1.3a channels tagged at the amino-terminal (which required membrane permeabilization) in our previous targeting experiments (Zhang et al., 2005a).
Fig. 4.

Intracellular targeting of recombinant sHA-CaV1.2 and sHA-CaV1.3a L-type Ca2+ channels in hippocampal neurons. Hippocampal neurons were transfected with sHA-CaV1.2 (A) or sHA-CaV1.3a (B) constructs together with β3 and α2δ-1 auxiliary subunits at 8–9 DIV and analysed 72 h after transfection by permeabilization with 0.25% Triton and labeling with HA mAb (red) and MAP2 pAb (green). Scale bars, 40 μm. Magnified regions are shown below for each panel as indicated. The data are representative of three independent transfection experiments with sHA-CaV1.2 and sHA-CaV1.3a constructs.
Quantitative analysis of sHA-CaV1.2 and sHA-CaV1.3 surface clusters
Both sHA-CaV1.2 and sHA-CaV1.3a constructs form clusters in surface labeling experiments with rat hippocampal neurons (Fig. 3A and B). Are these clusters synaptic? What is their intensity, surface area and density? To answer these questions we performed a quantitative analysis of surface clusters formed by sHA-CaV1.2 and sHA-CaV1.3a constructs expressed in rat hippocampal neurons. Synaptic locations in these experiments were identified by staining with anti-synapsin pAb. By comparing surface HA and synapsin staining we determined that clusters formed by sHA-CaV1.2 and sHA-CaV1.3a partially co-localize with synapsin clusters (Fig. 2). Quantitative analysis revealed that 81% of sHA-CaV1.2 surface clusters co-localized with synapsin clusters, but only 48% of sHA-CaV1.3a surface clusters co-localized with synapsin clusters (Fig. 2, Table 1).
Table 1.
Quantitative analysis of surface clusters formed by sHA-CaV1.2 and sHA-CaV1.3a constructs expressed in hippocampal neurons
| Construct | GFP- Shank1B | Co-localized synapsin | Surface area (%) | Intensity (a.u.) (pixels2) | Density (clusters / 150 μm) |
|---|---|---|---|---|---|
| sHA-CaV1.2 | − | 81% | 16.65 | 2600 | 14.7 ± 1.0 |
| sHA-CaV1.3a | − | 48% | 18.25 | 3250 | 9.7 ± 0.4 |
| sHA-CaV1.2 | + | 77% | 12.75 | 990 | 12.8 ± 0.7 |
| sHA-CaV1.3a | + | 74% | 15.20 | 1430 | 10.9 ± 0.6 |
In the previous study we discovered that the carboxy-terminal of the CaV1.3a subunit binds to PDZ and SH3 domains of Shank modular adaptor protein, and demonstrated that association with Shank is important for proper targeting of CaV1.3a channels in hippocampal neurons (Zhang et al., 2005a). We also demonstrated that Shank is specific for the CaV1.3a subunit and does not bind to CaV1.2 carboxy-terminus (Zhang et al., 2005a). To evaluate a role of Shank in targeting of neuronal L-type Ca2+ channels, in the next series of experiments we co-expressed sHA-CaV1.2 or sHA-CaV1.3a constructs (together with β3 and α2δ-1 subunits) with GFP-Shank1B (Sala et al., 2003) in mature rat hippocampal neurons. In these experiments subcellular localization of sHA-CaV1.2 and sHA-CaV1.3a subunits is determined by surface labeling with anti-HA mAb and compared with subcellular localization of GFP-Shank1B visualized by GFP imaging and synaptic locations identified by staining with anti-synapsin pAb. We found that co-transfection with GFP-Shank1B had no significant effect on localization of sHA-CaV1.2 surface clusters, with 77% of sHA-CaV1.2 surface clusters co-localized with synapsin in these experiments (Fig. 5A, Table 1). In contrast, co-localization of sHA-CaV1.3a clusters with synapsin clusters was increased in the presence of GFP-Shank1B from 48% to 74% (Fig. 5B, Table 1). These data indicate that Shank plays an important role in synaptic targeting of CaV1.3a channels, but not in synaptic targeting of CaV1.2 channels.
Fig. 5.
Synaptic targeting of recombinant sHA-CaV1.2 and sHA-CaV1.3a L-type Ca2+ channels co-expressed in hippocampal neurons with GFP-Shank1B. Hippocampal neurons were transfected with sHA-CaV1.2 (A) or sHA-CaV1.3a (B) constructs together with β3 and α2δ-1 auxiliary subunits and GFP-Shank1B construct (Sala et al., 2003) at 8–9 DIV and analysed 72 h after transfection by HA mAb surface labeling (red), GFP imaging (green) and synapsin pAb (blue) immunostaining. Scale bars, 40 μm. Magnified regions and profile scans are shown below for each panel as indicated. The data are representative of two independent transfection experiments with sHA-CaV1.2 and sHA-CaV1.3a constructs.
To perform further quantitative comparison of surface clusters formed by expressed sHA-CaV1.2 or sHA-CaV1.3a constructs we measured the surface area (in pixels2) and fluorescent intensity (in a.u.) of each cluster (see Materials and methods for details). For a reference, we also measured the surface area of synapsin clusters. When cumulative distributions of cluster areas were compared, we found that the size of surface clusters formed by sHA-CaV1.3a subunits was larger than the size of the clusters formed by sHA-CaV1.2 subunits (Fig. 6A). The midpoint of the cumulative distribution corresponded to the area of 18.65 pixels2 for synapsin clusters, to 18.25 pixels2 for sHA-CaV1.3a surface clusters and to 16.65 pixels2 for sHA-CaV1.2 surface clusters (Fig. 6A, Table 1). Thus, synapsin and sHA-CaV1.3a surface clusters have similar surface area, but the sHA-CaV1.2 surface clusters are 10% smaller in size. The midpoint of cumulative intensity distribution corresponded to 3250 a.u. for sHA-CaV1.3a surface clusters and to 2600 a.u. for sHA-CaV1.2 surface clusters (Fig. 6B, Table 1). Thus, we concluded that sHA-CaV1.3a surface clusters contain 25% more channels than sHA-CaV1.2 clusters. It has been previously estimated that an average sHA-CaV1.2 surface cluster contains eight sHA-CaV1.2 channels (Obermair et al., 2004). Based on this estimate and our results (Fig. 6B), we estimated that an average sHA-CaV1.3a surface cluster contains 10 sHA-CaV1.3a channels. The surface clusters formed by sHA-CaV1.3a are 10% larger in area and 25% brighter than the surface clusters formed by sHA-CaV1.2 subunits (Fig. 6A and B, Table 1). However, our analysis revealed that the clusters formed by sHA-CaV1.2 subunits are more abundant. When normalized to 150 μm of dendritic length in each transfected neuron, we observed 14.7 ± 1.0 (n = 29) sHA-CaV1.2 surface clusters and 9.7 ± 0.4 (n = 39) sHA-CaV1.3a surface clusters (Fig. 6C, Table 1). Thus, sHA-CaV1.2 clusters formed 35% more frequently than sHA-CaV1.3a surface clusters.
Fig. 6.

Quantitative analysis of sHA-CaV1.2 and sHA-CaV1.3a surface clusters. (A) Cumulative distribution of surface area measurements (pixels2) of sHA-CaV1.2 (black), sHA-CaV1.3a (red) and synapsin (green) clusters. (B) Cumulative distribution of brightness measurements (in a.u. of fluorescence) of sHA-CaV1.2 (black) and sHA-CaV1.3a (red) clusters. (C) The density (in puncta / 150 μm of dendritic length) of sHA-CaV1.2 and sHA-CaV1.3a surface clusters. Means ± SEM from 29 dendrites of transfected sHA-CaV1.2 and 39 dendrites of transfected sHA-CaV1.3a (***P < 0.05). The data in (A–C) were obtained from analysis of images collected as shown in Figs 2 and 3. (D) Cumulative distribution of surface area measurements (pixels2) of sHA-CaV1.2 (black) and sHA-CaV1.3a (red) clusters obtained in GFP-Shank1B co-expression experiments. (E) Cumulative distribution of brightness measurements (in a.u. of fluorescence) of sHA-CaV1.2 (black) and sHA-CaV1.3a (red) clusters obtained in GFP-Shank1B co-expression experiments. (F) The density (in puncta / 150 μm of dendritic length) of sHA-CaV1.2 and sHA-CaV1.3a surface clusters obtained in GFP-Shank1B co-expression experiments. Means ± SEM from 19 dendrites of transfected sHA-CaV1.2 and 18 dendrites of transfected sHA-CaV1.3a. The data in (D–F) were obtained from analysis of images collected as shown in Fig. 5.
To evaluate the effects of Shank, we repeated quantitative analysis of surface clusters formed by sHA-CaV1.2 and sHA-CaV1.3a constructs co-expressed in hippocampal neurons with GFP-Shank1B. We found that in these experiments the midpoint of the area cumulative distribution corresponded to 15.20 pixels2 for sHA-CaV1.3a surface clusters and to 12.75 pixels2 for sHA-CaV1.2 surface clusters (Fig. 6D, Table 1). The midpoint of intensity cumulative distribution corresponded to 1430 a.u. for sHA-CaV1.3a surface clusters and to 990 a.u. for sHA-CaV1.2 surface clusters (Fig. 6E, Table 1). Thus, in the presence of GFP-Shank1B sHA-CaV1.3a surface clusters were 19% larger in size and 44% brighter than sHA-CaV1.2 surface clusters (Fig. 6D and E, Table 1), compared with 10% larger and 25% brighter sHA-CaV1.3a clusters observed without GFP-Shank1B (Fig. 6A and B, Table 1). The reduction in absolute values of sHA-CaV1.2 and sHA-CaV1.3a clusters area and intensity observed in these experiments is most likely to be due to reduced levels of targeting constructs expression as a result of GFP-Shank1B co-transfections. When normalized to 150 μm of dendritic length in each transfected neuron, we observed 12.8 ± 0.7 (n = 18) sHA-CaV1.2 surface clusters and 10.9 ± 0.6 (n = 16) sHA-CaV1.3a surface clusters (Fig. 6F, Table 1). The difference in the density of sHA-CaV1.2 surface clusters and sHA-CaV1.3a surface clusters formed in the presence of GFP-Shank1B did not reach a level of statistical significance (P = 0.053). Thus, we concluded that co-expression with GFP-Shank1B makes sHA-CaV1.3a surface clusters as abundant as sHA-CaV1.2 surface clusters compared with 35% difference in the absence of GFP-Shank1B (Fig. 6C, Table 1).
pCREB signaling supported by CaV1.2 and CaV1.3 L-type Ca2+ channels
To compare the contribution of CaV1.2 and CaV1.3 L-type Ca2+ channels to pCREB signaling we adapted a ‘pharmacological knockout’ approach from Dolmetsch et al. (2001) and performed experiments with DHPR CaV1.2 and CaV1.3a mutants expressed in hippocampal neurons. The HA-CaV1.3a-T1033Y plasmid (Fig. 7A, right) encoding DHPR-CaV1.3 subunit was previously described (Zhang et al., 2005a). The sHA-CaV1.2-T1039Y plasmid (Fig. 7A, left) encoding DHPR-CaV1.2 subunit (He et al., 1997; Dolmetsch et al., 2001) was generated as described in Materials and methods. In our experiments mature primary rat hippocampal neuronal cultures were transfected by HA-CaV1.3a-T1033Y or sHA-CaV1.2–1039Y constructs with β3 and α2δ-1 subunits. The functional expression of L-type channels supported by HA-CaV1.3a-T1033Y and sHA-CaV1.2-T1039Y subunits in hippocampal neurons was confirmed by Fura-2 Ca2+ imaging. In these experiments HA-CaV1.3a-T1033Y or sHA-CaV1.2-T1039Y subunits were co-transfected into mature hippocampal neurons together with β3 and α2δ-1 subunits and EGFP plasmid. Transfected neurons were identified by GFP imaging and Ca2+ imaging experiments with Fura-2 were performed as previously described (Zhang et al., 2005a) in the presence of (in μm): TTX, 1 nifedipine, 50; D-AP5, 50; CNQX, 10; to block Ca2+ influx via endogenous L-type Ca2+ channels, N-methyl-D-aspartate (NMDA) and AMPA receptors. We found that 60 s stimulation by 20K or 45K depolarizations resulted in significantly greater Ca2+ elevation in neurons transfected with HA-CaV1.3a-T1033Y construct than in neurons transfected with sHA-CaV1.2-T1039Y construct (Fig. 7B). Similar peak Ca2+ levels were observed in neurons transfected with either construct following 60 s 90K stimulation (Fig. 7B). Thus, we concluded that both constructs support similar Ca2+ influx upon maximal simulation, but that HA-CaV1.3a-T1033Y is more effective at low and intermediate intensity of stimulation. Most likely this phenomenon can be explained by a negative shift in the activation range of CaV1.3 L-type Ca2+ channels when compared with CaV1.2 L-type Ca2+ channels (Koschak et al., 2001; Xu & Lipscombe, 2001; Olson et al., 2005) (Fig. 1C and D).
Fig. 7.

Depolarization-induced pCREB signaling supported by DHPR recombinant CaV1.2 and CaV1.3a L-type Ca2+ channels in hippocampal neurons. (A) The diagrams of sHA-CaV1.2-T1039Y and HA-CaV1.3a-T1033Y DHPR constructs. The locations of HA epitopes, the position of DHPR mutation and carboxy-terminal PDZ domain binding consensus are shown. (B) Hippocampal neurons were transfected with sHA-CaV1.2-T1039Y and HA-CaV1.3a-T1033Y plasmids together with α2δ;-1 and β3 auxiliary subunits and pEGFP-C3 plasmid. Seventy two hours after transfection neurons were loaded with Fura-2 and stimulated for 60 s with 20 mm KCl (20K), 45 mm KCl (45K) or 90 mm KCl (90K) in the presence of 1 μm TTX, 50 μm nifedipine, 50 μm D-AP5 and 10 μm CNQX. An average peak 340 / 380 ratio in transfected (GFP-positive) neurons is shown for sHA-CaV1.2-T1039Y (filled circles, n ≥ 9) and HA-CaV1.3a-T1033Y (open circles, n ≥ 6) constructs. Peak Ca2+ levels in neurons transfected with HA-CaV1.3a-T1033Y construct are significantly higher (***P < 0.05) than in neurons transfected with sHA-CaV1.2-T1039Y construct at 20K and 45K depolarization, but not at 90K depolarization. (C) Hippocampal neurons were transfected with sHA-CaV1.2-T1039Y or HA-CaV1.3a-T1033Y plasmids with β3 and α2δ-1 auxiliary subunits as indicated. Seventy two hours after transfection neurons were stimulated for 30 s with 20 mm KCl (20K), 45 mm KCl (45K) or 90 mm KCl (90K) in the presence of 1 μm TTX, 50 μm nifedipine, 50 μm D-AP5 and 10 μm CNQX. Confocal images of the same field are shown for pCREB (green) and HA (red) staining as indicated. The pCREB nuclear staining of the same cells is shown at 40 × higher magnification. (D) An average (means ± SEM, n = 2 experiments) stimulation-induced increase in normalized pCREB nuclear staining (ΔpCREB) in neurons transfected with sHA-CaV1.2-T1039Y (filled circles, n ≥ 24) or HA-CaV1.3a-T1033Y (open circles, n ≥ 26) is shown as a function of stimulation intensity. pCREB staining in neurons transfected with HA-CaV1.3a-T1033Y is significantly higher (***P < 0.05) than in neurons transfected with sHA-CaV1.2-T1039Y at 20K depolarization and significantly lower (***P < 0.05) at 90K depolarization.
To evaluate the contribution of CaV1.3 L-type Ca2+ channels to pCREB signaling, we co-expressed HA-CaV1.3a-T1033Y or sHA-CaV1.2-T1039Y constructs with β3 and α2δ-1 subunits in mature hippocampal neurons. Transfected neurons were stimulated for 30 s by KCl-induced depolarization (20K, 45K or 90K) in the continuous presence of (in μm): TTX, 1; nifedipine, 50; D-AP5, 50; CNQX, 10; and stained with pCREB-specific pAb as previously described (Zhang et al., 2005a). The transfected neurons were identified by immuno-staining with anti-HA mAb. We discovered that 20K stimulation induced significantly (P < 0.05) stronger nuclear pCREB signals in neurons transfected with HA-CaV1.3a-T1033Y than in neurons transfected with sHA-CaV1.2-T1039Y (Fig. 7C). Quantification of observed pCREB signals by confocal imaging confirmed that 20K stimulation induced significantly stronger pCREB response in HA-CaV1.3a-T1033Y-transfected neurons than in sHA-CaV1.2-T1039Y-transfected neurons (Fig. 7D). However, neurons transfected with sHA-CaV1.2-T1039Y responded equally well to 45K stimulation and even stronger to 90K stimulation (Fig. 7C and D). Thus, CaV1.3a channels play a predominant role in pCREB signaling at low, but not at moderate or high, stimulation intensities.
To analyse pCREB signaling induced by synaptic activity, neurons transfected with sHA-CaV1.2-T1039Y or HA-CaV1.3a-T1033Y (Fig. 8A) were challenged by EFS. These experiments were performed as previously described (Zhang et al., 2005a) in the continuous presence of 50 μm nifedipine and 50 μm D-AP5 to inhibit Ca2+ influx mediated by endogenous L-type Ca2+ channels and NMDA receptors. Neurons were stimulated by EFS at 5 Hz frequency for 30 s and stained with pCREB-specific pAb and anti-HA mAb. Obtained results were evaluated and quantified as described above for KCl-depolarization experiments. Thirty-second 5-Hz EFS induced much stronger (P < 0.001) pCREB signals in neurons transfected with HA-CaV1.3a-T1033Y constructs than in neurons transfected with sHA-CaV1.2-T1039Y constructs (Fig. 8B and C).
Fig. 8.

EFS-induced pCREB signaling supported by DHPR recombinant CaV1.2 and CaV1.3a L-type Ca2+ channels in hippocampal neurons. (A) The diagrams of sHA-CaV1.2-T1039Y and HA-CaV1.3a-T1033Y DHPR constructs. The locations of HA epitope, the position of DHPR mutation and carboxy-terminal PDZ domain-binding consensus are shown. (B) Hippocampal neurons were transfected with sHA-CaV1.2-T1039Y or HA-CaV1.3a-T1033Y plasmids with β3 and α2δ-1 auxiliary subunits as indicated. Seventy two hours after transfection neurons were stimulated for 30 s with 5 Hz EFS in the presence of 50 μm AP-5, 50 μm nifedipine and 20 μm bicuculline. Confocal images of the same field are shown for pCREB (green) and HA (red) staining as indicated. The pCREB nuclear staining of the same cells is shown at 40 × higher magnification. (C) An average increase in normalized pCREB nuclear staining (ΔpCREB) induced by 30-s 5-Hz EFS in hippocampal neurons transfected with sHA-CaV1.2-T1039Y (n = 42) or HA-CaV1.3a-T1033Y (n = 29). pCREB staining in neurons transfected with HA-CaV1.3a-T1033Y is significantly higher (***P < 0.05) than in neurons transfected with sHA-CaV1.2-T1039Y.
pCREB signaling in neurons from CaV1.3 knockout mice
To further evaluate an importance of CaV1.3 L-type Ca2+ channels for pCREB signaling, we performed experiments with primary neurons from CaV1.3 knockout mice (Platzer et al., 2000; Olson et al., 2005). In these experiments we established primary hippocampal neuronal cultures from P1–P2 CaV1.3− / − pups and control CaV1.3+ / − heterozygous littermates. The pCREB signals in these experiments were induced by KCl depolarization or EFS as described above with omission of nifedipine from experimental solutions. The pCREB responses were quantified by pCREB immunostaining and confocal microscopy as described above. We found that 30 s depolarization by 20 mm KCl induced significantly (P = 0.002) stronger nuclear pCREB signals in hippocampal neurons from CaV1.3+ / − mice than in hippocampal neurons from CaV1.3− / − mice (Fig. 9A and B). On average, 20 mm KCl depolarization induced signals equal to 101.8 ± 3.5% (n = 188) for CaV1.3+ / − neurons and 84.3 ± 4.3% (n = 207) for CaV1.3− / − neurons (Fig. 9E). The difference between CaV1.3+ / − and CaV1.3− / − neurons was even more dramatic in EFS experiments (Fig. 9C and D). On average, 30 s 5 Hz stimulation induced 32.1 ± 2.6% (n = 208) pCREB response in CaV1.3+ / − neurons and 13.6 ± 2.4% (n = 208) pCREB response in CaV1.3− / − neurons (Fig. 9F).
Fig. 9.

pCREB signaling in hippocampal neurons from CaV1.3 knockout mice. (A and B) The 9–10 DIV hippocampal neurons from CaV1.3+ / − (A) and CaV1.3− / − (B) mice were stimulated for 30 s by 20 mm KCl (20K) depolarization in the presence of 1 μm TTX, 50 μm D-AP5 and 10 μm CNQX, fixed and stained with anti-pCREB pAb and MAP2 mAb. Confocal images of pCREB (green) and MAP (red) staining in stimulated and unstimulated neurons (no stim) are shown. (C and D) The 9–10 DIV hippocampal neurons from CaV1.3+ / − (C) and CaV1.3− / − (D) were stimulated for 30 s by 5-Hz EFS in the presence of 50 μm D-AP5 and 20 μm bicuculline, fixed and stained with anti-pCREB pAb and MAP2 mAb. Confocal images of pCREB (green) and MAP (red) staining in stimulated and unstimulated neurons (no stim) are shown. (E and F) An average increase in normalized pCREB nuclear staining (ΔpCREB) induced by 30-s 20K (E) and 5-Hz 30-s EFS (F) stimulation of CaV1.3+ / − and CaV1.3− / − hippocampal neurons. The increase in pCREB staining induced by 30-s 20K depolarization or 30-s 5-Hz EFS in CaV1.3− / − neurons is significantly lower (***P < 0.05) than in CaV1.3+ / − neurons.
Our previous studies indicated that CaV1.3 channels play an important role in Ca2+ signaling in striatal MSN (Olson et al., 2005). L-type Ca2+ channels play an important role in pCREB signaling in MSN (Rajadhyaksha et al., 1999). Thus, in the next series of experiments we compared KCl-induced pCREB responses in 9–10 DIV MSN from CaV1.3− / − and CaV1.3+ / − mice. These experiments were performed and quantified as described above for hippocampal neurons. We found that 30 s application of 20 mm KCl induced much stronger (P < 0.001) pCREB signals in MSN from CaV1.3+ / − mice than in MSN from CaV1.3− / − mice (Fig. 10A and B). On average, KCl-induced pCREB signals were equal to 123.4 ± 4.4% (n = 102) in CaV1.3+ +/ − MSN and 41.2 ± 2.5% (n = 123) in CaV1.3− / − MSN (Fig. 10C). Thus, CaV1.3 channels play a crucial role in pCREB signaling in striatal MSN.
Fig. 10.

pCREB signaling in striatal MSN from CaV1.3 knockout mice. (A and B) The 9–10 DIV striatal MSN from CaV1.3+ / − (A) and CaV1.3− / − (B) mice were stimulated for 30 s by 20 mm KCl (20K) depolarization in the presence of 1 μm TTX, 50 μm D-AP5 and 10 μm CNQX, fixed and stained with anti-pCREB pAb and MAP2 mAb. Confocal images of pCREB (green) and MAP (red) staining in stimulated and unstimulated MSN (no stim) are shown. (C) An average increase in normalized pCREB nuclear staining (ΔpCREB) induced by 30-s 20K stimulation of CaV1.3+ / − and CaV1.3− / − MSN. The increase in pCREB staining induced by 20K depolarization in CaV1.3− / − MSN is significantly lower (***P < 0.05) than in CaV1.3+ / − MSN.
Discussion
Differential targeting of CaV1.2 and CaV1.3 L-type Ca2+ channels in hippocampal neurons
Here we used surface-epitope-tagged sHA-CaV1.2 and sHA-CaV1.3a constructs (Fig. 1) encoding pore-forming subunits of neuronal L-type Ca2+ channels to compare targeting of CaV1.2 and CaV1.3 L-type Ca2+ channels in hippocampal neurons. Consistent with previous studies of endogenous CaV1.2 and CaV1.3 localization (Hell et al., 1993; Davare et al., 2001; Weick et al., 2003; Obermair et al., 2004; Zhang et al., 2005a), we found that both sHA-CaV1.2 and sHA-CaV1.3 L-type Ca2+ channels formed surface clusters in proximal dendrites of hippocampal neurons (Fig. 3). Quantitative analysis revealed that sHA-CaV1.2 and sHA-CaV1.3 L-type Ca2+ channels form surface clusters with different properties. In agreement with the previous analysis by Obermair et al. (2004), 80.6% of sHA-CaV1.2 surface clusters were synaptic in our experiments (Fig. 2, Table 1). In contrast, only 48.4% of sHA-CaV1.3 surface clusters were synaptic in our experiments (Fig. 2, Table 1). On average, 14.7 ± 1.0 surface clusters per 150 μm of dendritic length were formed by sHA-CaV1.2 channels and 9.7 ± 0.4 surface clusters per 150 μm of dendritic length were formed by sHA-CaV1.3 channels (Fig. 6C, Table 1). Thus, sHA-CaV1.3 clusters were 34% less frequent than sHA-CaV1.2 surface clusters. However, clusters formed by sHA-CaV1.3 were 10% larger in surface area and 25% brighter than sHA-CaV1.2 clusters (Fig. 6A and B, Table 1).
In our previous studies we demonstrated that PDZ and SH3 domains of postsynaptic adaptor protein Shank specifically bind to the carboxy-terminal region of CaV1.3a subunit, but not to the carboxy-terminal region of CaV1.2 subunit (Zhang et al., 2005a). Consistent with these results, we found that co-expression with GFP-Shank1B had a significant effect on targeting of sHA-CaV1.3a channels, but not on targeting of sHA-CaV1.2 channels. We found that in the presence of GFP-Shank1B a fraction of synaptic sHA-CaV1.3a clusters was increased from 48.4% to 73.6% (Fig. 5, Table 1). In contrast, the fraction of synaptic sHA-CaV1.2 clusters was not significantly affected by co-expression with GFP-Shank1B (Fig. 5, Table 1). We further found that in the presence of GFP-Shank1B sHA-CaV1.2 and sHA-CaV1.3a clusters were formed at similar density (Fig. 6F, Table 1), and that sHA-CaV1.3a clusters were 19% larger and 44% brighter than sHA-CaV1.2 clusters (Fig. 6D and E, Table 1). Thus, the presence of exogenous Shank1B promoted formation and synaptic localization of sHA-CaV1.3a surface clusters, but had no effect on formation or synaptic localization of sHA-CaV1.2 surface clusters.
From these and previous (Zhang et al., 2005a) results we concluded that CaV1.3a L-type Ca2+ channels form a complex with Shank that is important for insertion and / or stabilization of these channels in synaptic plasma membrane. Our results also suggest that CaV1.2 L-type Ca2+ channels rely on different targeting mechanisms that do not involve Shank. Previous studies reported that the carboxy-terminal region of CaV1.2 L-type Ca2+ channels binds to PDZ domains of adaptor proteins NIL-16 (Kurschner & Yuzaki, 1999) and CIPP (Kurschner et al., 1998). Carboxy–terminal association with NIL-16 was proposed to be important for CaV1.2 channels clustering in hippocampal neurons (Weick et al., 2003). The picture emerging from these studies is that CaV1.3 L-type Ca2+ channels rely on association with Shank and CaV1.2 L-type Ca2+ channels rely on association with NIL-16 for proper synaptic targeting and clustering.
Role of CaV1.3 L-type Ca2+ channels in neuronal pCREB signaling
Using DHPR CaV1.2 and CaV1.3a mutants we demonstrated that CaV1.3 L-type Ca2+ channels signal to pCREB more effectively than CaV1.2 L-type Ca2+ channels when hippocampal neurons were stimulated by 30-s depolarization with 20 mm KCl (Fig. 7) or by 30-s application of 5 Hz EFS (Fig. 8). However, CaV1.2 L-type Ca2+ channels signal to pCREB as efficiently as CaV1.3 L-type Ca2+ channels at 30 s 45 mm KCl depolarization (Fig. 7), and even more efficiently at 30 s 90 mm KCl depolarization (Fig. 7). Previous studies demonstrated that association of CaV1.2 and CaV1.3a L-type Ca2+ channels with PDZ adaptors is required for proper targeting of these channels and efficient signaling to nuclear pCREB (Weick et al., 2003; Zhang et al., 2005a). Our present results suggest that even when both CaV1.2 and CaV1.3a are targeted correctly, CaV1.3 L-type Ca2+ channels play a predominant role in pCREB signaling at low, but not at high, stimulation intensities. When compared with CaV1.2 L-type Ca2+ channels, CaV1.3 L-type Ca2+ channels open at more negative membrane potentials (Koschak et al., 2001; Xu & Lipscombe, 2001; Lipscombe et al., 2004; Olson et al., 2005) (Fig. 1C and D), and the predominant role of CaV1.3 in pCREB signaling at low intensities of stimulation most likely reflects the ability of these channels to open at lower levels of depolarization (Fig. 7B).
Our conclusions are further supported by analysis of pCREB signaling in neurons from CaV1.3 knockout mice. When compared with hippocampal neurons from control heterozygous littermates, pCREB signals induced by 30 s 20 mm KCl depolarization were reduced by 20% in hippocampal neurons from CaV1.3 knockout mice (Fig. 9A, C and E). Furthermore, the pCREB response induced by 30-s 5-Hz EFS was reduced by 60% in hippocampal neurons from CaV1.3 knockout mice (Fig. 9B, D and F). One explanation for the relatively mild changes in hippocampal neuronal pCREB signaling induced by CaV1.3 knockout is that only 20% of L-type calcium channels are encoded by CaV1.3 isoform in the hippocampus (Hell et al., 1993). Indeed, no significant differences have been reported when long-term potentiation was analysed in the CA1 hippocampal region of CaV1.3 knockout mice (Clark et al., 2003). Compared with relatively mild effects in hippocampal neurons, pCREB signals induced by 20 mm KCl 30-s depolarization were reduced by 65% in striatal MSN from CaV1.3 knockout mice (Fig. 10). The dramatic phenotype observed in striatal MSN pCREB signaling most likely reflects a predominant role played by CaV1.3 L-type Ca2+ channels in striatal neurons (Olson et al., 2005). Future analysis of striatal synaptic plasticity in CaV1.3 knockout mice may provide additional insights into the neuronal function of CaV1.3 L-type Ca2+ channels.
Acknowledgments
We thank Diana Lipscombe and Weifeng Xu for the CaV1.3 clone; Morgan Sheng and Carlo Sala for GFP-Shank1B plasmid, Richard W. Tsien for the CaV1.2, β3 and α2δ-1 clones; and Tianhua Lei and Linda Patterson for expert technical and administrative assistance. We are grateful to Joerg Striessnig and Emmanuel Bourinet for helpful discussions and comments on the manuscript. This study was supported by the Robert A. Welch Foundation and NIH R01 NS39552 (I.B.), NS34696 (J.S.), Association Française contre les Myopathies (C.A.) and Austrian Science Fund P17159 (J.P.).
Abbreviations
- CIPP
channel-interacting PDZ domain protein
- DHPR
dihydropyridine-resistant
- DIV
days in vitro
- EFS
electrical field stimulation
- MSN
medium spiny neuronal
- NIL-16
neuronal interleukin-16 precursor protein
- NMDA
N-methyl-D-aspartate
- PBS
phosphate-buffered saline
- PCR
polymer chain reaction
- TTX
tetrodotoxin
References
- Altier C, Dubel SJ, Barrere C, Jarvis SE, Stotz SC, Spaetgens RL, Scott JD, Cornet V, De Waard M, Zamponi GW, Nargeot J, Bourinet E. Trafficking of L-type calcium channels mediated by the postsynaptic scaffolding protein AKAP79. J Biol Chem. 2002;277:33598–33603. doi: 10.1074/jbc.M202476200. [DOI] [PubMed] [Google Scholar]
- Bezprozvanny I, Tsien RW. Voltage-dependent blockage of diverse types of voltage-gated Ca2+ channels expressed in Xenopus oocytes by the Ca2+ channel antagonist mibefradil (Ro 40-5967) Molec Pharm. 1995;48:540–549. [PubMed] [Google Scholar]
- Bito H, Deisseroth K, Tsien RW. CREB phosphorylation and dephosphorylation: a Ca(2+)- and stimulus duration-dependent switch for hippocampal gene expression. Cell. 1996;87:1203–1214. doi: 10.1016/s0092-8674(00)81816-4. [DOI] [PubMed] [Google Scholar]
- Bittinger MA, McWhinnie E, Meltzer J, Iourgenko V, Latario B, Liu X, Chen CH, Song C, Garza D, Labow M. Activation of cAMP response element-mediated gene expression by regulated nuclear transport of TORC proteins. Curr Biol. 2004;14:2156–2161. doi: 10.1016/j.cub.2004.11.002. [DOI] [PubMed] [Google Scholar]
- Catterall WA. Structure and regulation of voltage-gated Ca2+ channels. Annu Rev Cell Dev Biol. 2000;16:521–555. doi: 10.1146/annurev.cellbio.16.1.521. [DOI] [PubMed] [Google Scholar]
- Clark NC, Nagano N, Kuenzi FM, Jarolimek W, Huber I, Walter D, Wietzorrek G, Boyce S, Kullmann DM, Striessnig J, Seabrook GR. Neurological phenotype and synaptic function in mice lacking the CaV1.3 alpha subunit of neuronal L-type voltage-dependent Ca2+ channels. Neuroscience. 2003;120:435–442. doi: 10.1016/s0306-4522(03)00329-4. [DOI] [PubMed] [Google Scholar]
- Conkright MD, Canettieri G, Screaton R, Guzman E, Miraglia L, Hogenesch JB, Montminy M. TORCs: transducers of regulated CREB activity. Mol Cell. 2003;12:413–423. doi: 10.1016/j.molcel.2003.08.013. [DOI] [PubMed] [Google Scholar]
- Davare MA, Avdonin V, Hall DD, Peden EM, Burette A, Weinberg RJ, Horne MC, Hoshi T, Hell JW. A beta2 adrenergic receptor signaling complex assembled with the Ca2+ channel Cav1.2. Science. 2001;293:98–101. doi: 10.1126/science.293.5527.98. [DOI] [PubMed] [Google Scholar]
- Deisseroth K, Mermelstein PG, Xia H, Tsien RW. Signaling from synapse to nucleus: the logic behind the mechanisms. Curr Opin Neurobiol. 2003;13:354–365. doi: 10.1016/s0959-4388(03)00076-x. [DOI] [PubMed] [Google Scholar]
- Dolmetsch RE, Pajvani U, Fife K, Spotts JM, Greenberg ME. Signaling to the nucleus by an L-type calcium channel-calmodulin complex through the MAP kinase pathway. Science. 2001;294:333–339. doi: 10.1126/science.1063395. [DOI] [PubMed] [Google Scholar]
- Dunlap K, Luebke JI, Turner TJ. Exocytotic Ca2+ channels in mammalian central neurons. Trends Neurosci. 1995;18:89–98. [PubMed] [Google Scholar]
- Graef IA, Mermelstein PG, Stankunas K, Neilson JR, Deisseroth K, Tsien RW, Crabtree GR. L-type calcium channels and GSK-3 regulate the activity of NF-ATc4 in hippocampal neurons. Nature. 1999;401:703–708. doi: 10.1038/44378. [DOI] [PubMed] [Google Scholar]
- He M, Bodi I, Mikala G, Schwartz A. Motif III, S5 of L-type calcium channels is involved in the dihydropyridine binding site. A combined radioligand binding and electrophysiological study. J Biol Chem. 1997;272:2629–2633. doi: 10.1074/jbc.272.5.2629. [DOI] [PubMed] [Google Scholar]
- Hell JW, Westenbroek RE, Warner C, Ahlijanian MK, Prystay W, Gilbert MM, Snutch TP, Catterall WA. Identification and differential subcellular localization of the neuronal class C and class D L-type calcium channel alpha 1 subunits. J Cell Biol. 1993;123:949–962. doi: 10.1083/jcb.123.4.949. [DOI] [PMC free article] [PubMed] [Google Scholar]
- Herlitze S, Xie M, Han J, Hummer A, Melnik-Martinez KV, Moreno RL, Mark MD. Targeting mechanisms of high voltage-activated Ca2+ channels. J Bioenerg Biomembr. 2003;35:621–637. doi: 10.1023/b:jobb.0000008027.19384.c0. [DOI] [PubMed] [Google Scholar]
- Iourgenko V, Zhang W, Mickanin C, Daly I, Jiang C, Hexham JM, Orth AP, Miraglia L, Meltzer J, Garza D, Chirn GW, McWhinnie E, Cohen D, Skelton J, Terry R, Yu Y, Bodian D, Buxton FP, Zhu J, Song C, Labow MA. Identification of a family of cAMP response element-binding protein coactivators by genome-scale functional analysis in mammalian cells. Proc Natl Acad Sci USA. 2003;100:12147–12152. doi: 10.1073/pnas.1932773100. [DOI] [PMC free article] [PubMed] [Google Scholar]
- Koschak A, Reimer D, Huber I, Grabner M, Glossmann H, Engel J, Striessnig J. Alpha 1D (Cav1.3) subunits can form 1-type Ca2+ channels activating at negative voltages. J Biol Chem. 2001;276:22100–22106. doi: 10.1074/jbc.M101469200. [DOI] [PubMed] [Google Scholar]
- Kurschner C, Mermelstein PG, Holden WT, Surmeier DJ. CIPP, a novel multivalent PDZ domain protein, selectively interacts with Kir4.0 family members, NMDA receptor subunits, neurexins, and neuroligins. Mol Cell Neurosci. 1998;11:161–172. doi: 10.1006/mcne.1998.0679. [DOI] [PubMed] [Google Scholar]
- Kurschner C, Yuzaki M. Neuronal interleukin-16 (NIL-16): a dual function PDZ domain protein. J Neurosci. 1999;19:7770–7780. doi: 10.1523/JNEUROSCI.19-18-07770.1999. [DOI] [PMC free article] [PubMed] [Google Scholar]
- Lipscombe D, Helton TD, Xu W. L-type calcium channels: the low down. J Neurophysiol. 2004;92:2633–2641. doi: 10.1152/jn.00486.2004. [DOI] [PubMed] [Google Scholar]
- Mangoni ME, Couette B, Bourinet E, Platzer J, Reimer D, Striessnig J, Nargeot J. Functional role of L-type Cav1.3 Ca2+ channels in cardiac pacemaker activity. Proc Natl Acad Sci USA. 2003;100:5543–5548. doi: 10.1073/pnas.0935295100. [DOI] [PMC free article] [PubMed] [Google Scholar]
- Maximov A, Bezprozvanny I. Synaptic targeting of N-type calcium channels in hippocampal neurons. J Neurosci. 2002;22:6939–6952. doi: 10.1523/JNEUROSCI.22-16-06939.2002. [DOI] [PMC free article] [PubMed] [Google Scholar]
- Namkung Y, Skrypnyk N, Jeong MJ, Lee T, Lee MS, Kim HL, Chin H, Suh PG, Kim SS, Shin HS. Requirement for the L-type Ca(2+) channel alpha (1D) subunit in postnatal pancreatic beta cell generation. J Clin Invest. 2001;108:1015–1022. doi: 10.1172/JCI13310. [DOI] [PMC free article] [PubMed] [Google Scholar]
- Obermair GJ, Szabo Z, Bourinet E, Flucher BE. Differential targeting of the L-type Ca2+ channel alpha 1C (CaV1.2) to synaptic and extrasynaptic compartments in hippocampal neurons. Eur J Neurosci. 2004;19:2109–2122. doi: 10.1111/j.0953-816X.2004.03272.x. [DOI] [PubMed] [Google Scholar]
- Olson PA, Tkatch T, Hernandez-Lopez S, Ulrich S, Ilijic E, Mugnaini E, Zhang H, Bezprozvanny I, Surmeier DJ. G-protein-coupled receptor modulation of striatal CaV1.3 L-type Ca2+ channels is dependent on a Shank-binding domain. J Neurosci. 2005;25:1050–1062. doi: 10.1523/JNEUROSCI.3327-04.2005. [DOI] [PMC free article] [PubMed] [Google Scholar]
- Platzer J, Engel J, Schrott-Fischer A, Stephan K, Bova S, Chen H, Zheng H, Striessnig J. Congenital deafness and sinoatrial node dysfunction in mice lacking class D L-type Ca2+ channels. Cell. 2000;102:89–97. doi: 10.1016/s0092-8674(00)00013-1. [DOI] [PubMed] [Google Scholar]
- Rajadhyaksha A, Barczak A, Macias W, Leveque JC, Lewis SE, Konradi C. L-type Ca(2+) channels are essential for glutamate-mediated CREB phosphorylation and c-fos gene expression in striatal neurons. J Neurosci. 1999;19:6348–6359. doi: 10.1523/JNEUROSCI.19-15-06348.1999. [DOI] [PMC free article] [PubMed] [Google Scholar]
- Safa P, Boulter J, Hales TG. Functional properties of Cav1.3 (alpha1D), L-type Ca2+ channel splice variants expressed by rat brain and neuroendocrine GH3 cells. J Biol Chem. 2001;276:38727–38737. doi: 10.1074/jbc.M103724200. [DOI] [PubMed] [Google Scholar]
- Sala C, Futai K, Yamamoto K, Worley PF, Hayashi Y, Sheng M. Inhibition of dendritic spine morphogenesis and synaptic transmission by activity-inducible protein Homer1a. J Neurosci. 2003;23:6327–6337. doi: 10.1523/JNEUROSCI.23-15-06327.2003. [DOI] [PMC free article] [PubMed] [Google Scholar]
- Screaton RA, Conkright MD, Katoh Y, Best JL, Canettieri G, Jeffries S, Guzman E, Niessen S, Yates JR, 3rd, Takemori H, Okamoto M, Montminy M. The CREB coactivator TORC2 functions as a calcium-and cAMP-sensitive coincidence detector. Cell. 2004;119:61–74. doi: 10.1016/j.cell.2004.09.015. [DOI] [PubMed] [Google Scholar]
- Seisenberger C, Specht V, Welling A, Platzer J, Pfeifer A, Kuhbandner S, Striessnig J, Klugbauer N, Feil R, Hofmann F. Functional embryonic cardiomyocytes after disruption of the L-type alpha1C (Cav1.2) calcium channel gene in the mouse. J Biol Chem. 2000;275:39193–39199. doi: 10.1074/jbc.M006467200. [DOI] [PubMed] [Google Scholar]
- Tang TS, Slow EJ, Lupu V, Stavrovskaya IG, Sugimori M, Llinas R, Kristal BS, Hayden MR, Bezprozvanny I. Disturbed Ca2+ signaling and apoptosis of medium spiny neurons in Huntington’s disease. Proc Natl Acad Sci USA. 2005;102:2602–2607. doi: 10.1073/pnas.0409402102. [DOI] [PMC free article] [PubMed] [Google Scholar]
- Weick JP, Groth RD, Isaksen AL, Mermelstein PG. Interactions with PDZ proteins are required for L-type calcium channels to activate cAMP response element-binding protein-dependent gene expression. J Neurosci. 2003;23:3446–3456. doi: 10.1523/JNEUROSCI.23-08-03446.2003. [DOI] [PMC free article] [PubMed] [Google Scholar]
- Wittemann S, Mark M, Rettig J, Herlitze S. Synaptic localization and presynaptic function of calcium channel beta 4-subunits in cultured hippocampal neurons. J Biol Chem. 2000;275:37807–37814. doi: 10.1074/jbc.M004653200. [DOI] [PubMed] [Google Scholar]
- Xu W, Lipscombe D. Neuronal Ca(V)1.3alpha(1) L-type channels activate at relatively hyperpolarized membrane potentials and are incompletely inhibited by dihydropyridines. J Neurosci. 2001;21:5944–5951. doi: 10.1523/JNEUROSCI.21-16-05944.2001. [DOI] [PMC free article] [PubMed] [Google Scholar]
- Zhang H, Maximov A, Fu Y, Xu F, Tang TS, Tkatch T, Surmeier DJ, Bezprozvanny I. Association of CaV1.3 L-type calcium channels with Shank. J Neurosci. 2005a;25:1037–1049. doi: 10.1523/JNEUROSCI.4554-04.2005. [DOI] [PMC free article] [PubMed] [Google Scholar]
- Zhang X, Odom DT, Koo SH, Conkright MD, Canettieri G, Best J, Chen H, Jenner R, Herbolsheimer E, Jacobsen E, Kadam S, Ecker JR, Emerson B, Hogenesch JB, Unterman T, Young RA, Montminy M. Genome-wide analysis of cAMP-response element binding protein occupancy, phosphorylation, and target gene activation in human tissues. Proc Natl Acad Sci USA. 2005b;102:4459–4464. doi: 10.1073/pnas.0501076102. [DOI] [PMC free article] [PubMed] [Google Scholar]
- Zhang Z, Xu Y, Song H, Rodriguez J, Tuteja D, Namkung Y, Shin HS, Chiamvimonvat N. Functional roles of Ca(v)1.3 (alpha(1D)) calcium channel in sinoatrial nodes: insight gained using gene-targeted null mutant mice. Circ Res. 2002;90:981–987. doi: 10.1161/01.res.0000018003.14304.e2. [DOI] [PubMed] [Google Scholar]