

Summary
EPAC proteins are the guanine nucleotide exchange factors that act as the intracellular receptors for cyclic AMP. Two variants of EPAC genes including EPAC1 and EPAC2 are cloned and are widely expressed throughout the brain. But, their functions in the brain remain unknown. Here, we genetically delete EPAC1 (EPAC1-/-), or EPAC2 (EPAC2-/-) or both EPAC1 and EPAC2 genes (EPAC-/-) in the forebrain of mice. We show that EPAC null mutation impairs long-term potentiation (LTP) and that this impairment is paralleled with the severe deficits in spatial learning and social interactions and is mediated in a direct manner by miR-124 transcription and Zif268 translation. Knockdown of miR-124 restores Zif268 and hence reverses all aspects of the EPAC-/- phenotypes, whereas expression of miR-124 or knockdown of Zif268 reproduces the effects of EPAC null mutation. Thus, EPAC proteins control miR-124 transcription in the brain for processing spatial learning and social interactions.
Introduction
Excitatory transmission at the central synapses is primarily mediated by the amino acid glutamate (Edmonds et al., 1995). The efficacy of glutamate transmission can be persistently changed following the specific patterns of neuronal activities (Nicoll and Malenka, 1995) and these changes, as seen in long-term potentiation (LTP) and long-term depression (LTD) in the hippocampus, are widely considered as a cellular substrate of spatial learning and memory consolidation (Bliss and Collingridge, 1993; Malenka and Nicoll, 1999) and typically require rapid new gene expression (Soderling and Derkaxh, 2000; Kelleher et al., 2004).
In the brain, a major cellular signaling molecule that is linked with gene expression is cyclic AMP (cAMP) (West et al., 2001), which is known to play roles in cognition such as learning and memory formation (Benito and Barco, 2010; Impey et al., 2004). A classical and direct cellular target of cAMP is protein kinase A (PKA). Another binding substrate of cAMP, as called exchange protein directly activated by cAMP (EPAC), has been identified recently (de Rooij et al., 1998; Kawasaki et al., 1998; Zhang et al., 2009). Two variants of EPAC proteins have been cloned; EPAC1 and EPAC2, which are encoded by Rapgef3 and Rapgef4 genes, respectively (Boss, 2006; Zhang et al., 2009).
EPAC proteins have multiple domains consisting of one (EPAC1) or two (EPAC2) cAMP regulatory binding motifs and a guanine nucleotide exchange factor (GEF) (Boss, 2006). When cAMP binds a regulatory motif, it causes a conformational change of EPAC proteins and hence activates a Ras-like small GTPase Rap1/2 (Rehmann et al., 2003). In the cardio-vascular system, EPAC1-Rap1 signaling controls endothelial cell growth and vascular formation (Sehrawat et al., 2008). In the pancreatic β-cells, EPAC2 regulates insulin secretion (Zhang et al., 2009). Both EPAC1 and EPAC2 genes are expressed throughout the brain including the hippocampus, striatum and prefrontal cortex (Kawasaki et al., 1998). But, their neurological functions are yet to be described.
In this study, we report that both EPAC1-/- and EPAC2-/- mice are phenotypically normal while double knockout (EPAC-/-) mice exhibit severe deficits in LTP, spatial learning and social interactions, showing functional redundancy of EPAC proteins in the brain in vivo. Additionally, we identify that EPAC proteins via activation of Rap1 directly interacts with the regulatory element upstream of miR-124 gene and restricts miR-124. We further show that miR-124 directly binds to and inhibits Zif268 translation. These findings reveal an unexpected mechanism by which the mutation of EPAC genes cause cognition and social dysfunctions. Thus, targeting these genes can be considered as a promising strategy for the treatment of some neurological disorders.
Results
Generation of Genetically Modified EPAC Strains of Mice
EPAC1 and EPAC2 proteins are very similar and expressed in largely overlapping patterns throughout the brain (Kawasaki et al., 1998), suggesting functional redundancy. To test this idea and explore the in vivo functions of EPAC1 and EPAC2 proteins in the brain, we genetically deleted EPAC1 (EPAC1-/- , Figure 1A-1C) or EPAC2 (EPAC2-/-, Figure 1D and 1E) or both EPAC1 and EPAC2 genes in the forebrain of mice (EPAC-/-, see Experimental Procedures and Figure 1F). A complete gene deletion in the null alleles was confirmed by RT-PCR and Western blot analysis of EPAC1 (Figure 1C and 1F) or EPAC2 (Figure 1E and 1F) mRNA and proteins. Additionally, we demonstrated that a combined deletion of both EPAC1 and EPAC2 genes inactivated the GEFs for Rap1, whereas a single gene deletion (EPAC1-/- or EPAC2-/-) alone had no effect (Figure 1G and 1H), showing a synergistic action between EPAC1 and EPAC2 proteins.
Figure 1. Generation of Genetically Modified EPAC Strains of Mice.
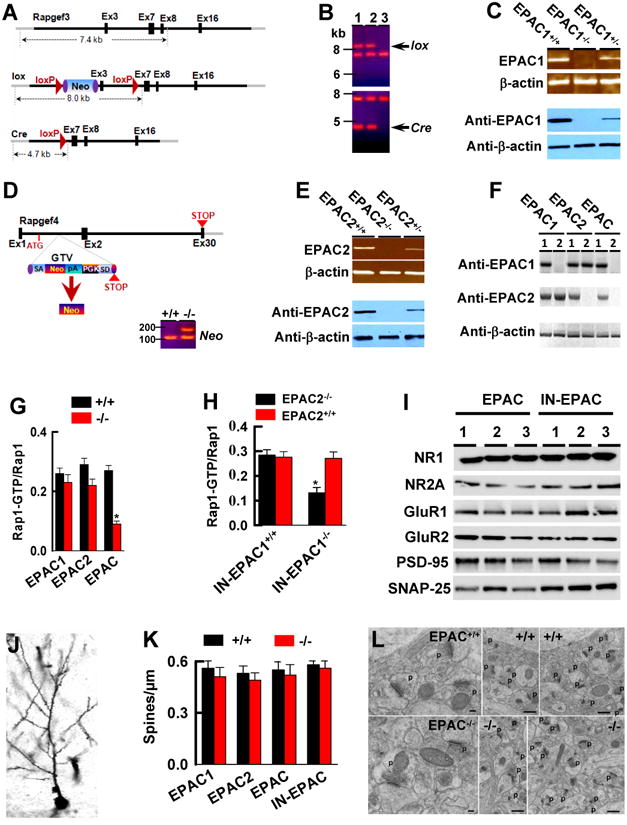
(A-C) EPAC1 gene targeting construct and deletion strategies (A) and Southern blots (B) of the homozygous (lane 1), heterozygous (lane 2) and wildtype (lane 3) of the floxed (B, top) and the constitutive (B, bottom) EPAC1 knockouts. RT-PCR and Western blots of EPAC1 mRNA (C, top) and protein (C, bottom) in EPAC1-/- mice.
(D and E) The mouse embryonic stem cells (D, top) carrying EPAC2 allele disrupted by inserting a gene trap vector in the first axon were cloned to generate EPAC2 mutant mice. Southern blot (D, bottom) of null mutant mice verified the Neo signal. EPAC2 mRNA (E, top) and protein (E, bottom) are deleted in EPAC-/- mice.
(F) A combined deletion of EPAC1 and EPAC2 proteins in the forebrain of EPAC-/- mice.
(G and H) EPAC activity is reduced in the forebrain of EPAC-/- (G) and IN-EPAC1-/- (H) mice. Data are mean ± SEM (n = 4 assays, *p < 0.01, compared to the respective wildtype control mice).
(I) Western blots of the membrane fractions from homozygous (lane 1), heterozygous (lane 2) and wildtype (lane 3) mice. Similar results were observed in each of the four experiments.
(J and K) A representative image shows a Golgi-labeled CA1 pyramidal neuron (J). Bar graph shows averaged spine densities for each genotype (K) (mean ± SEM, n = 4, p > 0.01).
(L) Electron microscopy of the CA1 area reveals normal synaptic ultrastructure in EPAC-/- mice. P: pre-synaptic terminal. Scale bars are 100 nm in the 2 left micrographs and 500 nm in the others. Similar results were observed in each of three assays.
Synaptic Structures Are Normal in EPAC Null Alleles
We next examined whether EPAC null mutation caused developmental changes or alterations in synaptic structures. We compared the overall synaptic protein compositions (Figure 1I), synaptic spines (Figure 1J), and spine densities (Figure 1K and 1L) as well as synaptic vesicles (Figure 1L) among genotypes, we discovered no abnormalities in EPAC-/- alleles. In contrast to our findings, an earlier study suggested that EPAC2 protein was involved in synaptic remodeling via regulation of spine turnover (Woolfrey et al., 2009). However, this previous work was conducted in the in vitro cultured neurons and thus relevance to the in vivo neuronal functions of endogenous EPAC2 protein is questionable. Additionally, we analyzed the series cryostat brain sections (Figure S1A and S1B) from adult mice. As shown for regions (Figure S1C) including the hippocampus, striatum and the prefrontal cortex known to express EPAC genes, there were no structural deficits in EPAC-/- neurons.
Synaptic Transmission Is Abnormal in EPAC Null Alleles
We next examined whether EPAC null mutation affects functional state of synapses. We used whole-cell patch clamp recordings from the CA1 pyramidal neurons blind, with direct comparison of littermates derived from heterozygous mating. In this series of the studies, we first analyzed the evoked excitatory post-synaptic currents (EPSCs) by stimulation of the Schaffer-collateral fibers. Since the peak amplitude of EPSCs at a given stimulation varies from slice to slice, we constructed the input-output curves by plotting the normalized EPSCs amplitude against the stimulus intensities. We found that the evoked EPSCs in response to the elevated stimulus intensities were dramatically reduced in EPAC-/- and inducible (IN-EPAC-/-) neurons, compared to controls (Figure 2A, n = 16 recordings/8 mice). We also examined the spontaneous release of glutamate transmitter (Figure 2B) and demonstrated that the frequency (Figure 2C) but not the mean amplitude (Figure 2D) of the spontaneous EPSCs in EPAC null alleles decreased significantly, compared to the controls (n = 14 recordings/7 mice/group, p < 0.01).
Figure 2. Synaptic Transmission and LTP Are Abnormal in EPAC-/- Neurons.

(A) Excitatory synaptic strength decreases in EPAC-/- and IN-EPAC-/- neurons. Traces are EPSCs at holding potential of – 70 mV in response to stimulus intensities from 1 to 4 mV at an interval of 0.5 mV. The EPSCs amplitudes are normalized to the base line (defined as 1.0) and plotted against the stimulus intensities (mean ± SEM (n = 16 recordings/8 mice/group, * p < 0.01, compared to the respective wild-type control mice).
(B-D) Representatives (B) are spontaneous EPSCs. Bar graphs show the frequency (C) and mean amplitudes of EPACs (D, mean ± SEM, n = 14 recordings/7 mice/group, *p < 0.01, compared to the respective wild-type control mice).
(E and F) Representative traces are recorded at the holding potentials of -80, -40, 0, 20, or 40 mV. The normalized EPSCs (N.C.) mediated by AMPA (E) and the NMDA receptors (F) are plotted against the holding potentials (mV). Data are mean ± SEM (n = 12 recordings/6 mice/group).
(G and H) The peak amplitudes of the intracellular EPSPs (G) are normalized to the baseline (defined as 1.0). The traces (G, top) are representative EPSPs at basal line (black) and 60 min after tetanus (red). Arrow indicates the time of tetanus. A bar graph (H) shows the normalized EPSPs amplitude 60 min after tetanus in CA1 neurons and the dentate granule cells (DG) (mean ± SEM, n = 12 recordings/6 mice/group, *p < 0.01, compared to the respective wild-type control mice).
(I) The peak amplitudes of EPSPs are normalized to the baseline (defined as 1.0). The traces are EPSPs at basal line (black) and 30 min after tetanus (red, mean ± SEM, n =12 recordings/6 mice/group). In Figure 2C-2I, E1-/-, E2-/-, E-/-, IN-E-/-, and E+/- indicate EPAC1-/-, EPAC2-/-, EPAC-/-, IN-EPAC-/-, and heterozygous (EPAC+/-) mice, respectively.
In the post-synaptic sites, we analyzed the current-voltage (I-V) relations of the normalized AMPA receptor- (Figure 2E) and NMDA receptor- (Figure 2F) mediated EPSCs. We found that neither the voltage-dependence nor the reversal potentials of the evoked EPSCs were altered in EPAC-/- neurons (n = 12 recordings/6 mice/group). Collectively, these findings indicate that EPAC null mutation reduces glutamate release from presynaptic terminals without altering the receptor channel conductance on the postsynaptic sites.
LTP Is Abnormal in EPAC Null Alleles
To extend analysis of synaptic functions, we examined whether LTP, an activity-dependent long-lasting enhancement of synaptic transmission (Nicoll and Malenka, 1995), was altered in EPAC null alleles. In this study, we performed the intracellular sharp electrode recordings of the excitatory postsynaptic potentials (EPSPs) in CA1 pyramidal neurons. We observed that brief high frequency stimulation (tetanus) increased the peak amplitudes of the evoked EPSPs in control littermates. This increase (LTP) was maintained over 90 min (Figure 2G and 2H, 1.78 ± 0.15, n = 12 recordings/6 mice/group). In EPAC-/- neurons, however, a short-term enhancement but not LTP was found; the peak amplitudes decayed to the basal levels after 30 min of the tetanus (1.05 ± 0.71, n = 14 recordings/7 mice/group, p < 0.01). Similar to CA1 pyramidal neurons, an absence of LTP was observed in the EPAC-/- granule cells (Figure 2H). LTP deficits in EPAC-/- cells was not due to the developmental abnormalities because it was found in the inducible EPAC-/- mice (IN-EPAC-/-), in which EPAC1 gene was deleted after development was completed (1.09 ±0.79 in CA1 and 1.11 ± 0.68 in the dentate granule cells, respectively, Figure 2G and 2H).
It should be mentioned that there was a reduction of synaptic strength in EPAC-/- neurons in response to the elevated stimulus intensities under the basal condition (Figure 2A). Thus, the failure expression of LTP in EPAC-/- mice could be a functional consequence of a general synaptic deficit. To investigate this possibility, we examined the capacity of EPAC-/- neurons for LTD expression by applying 300 stimuli over the course of 3 min. We found that the magnitude of LTD did not differ among groups (Figure 2I). Thus, EPAC null mutation specifically impairs LTP.
Spatial Learning and Memory Deficits in EPAC Null Alleles
LTP of synaptic transmission in the hippocampus is widely considered as a cellular substrate of spatial learning and memory formation (Nicoll and Malenka, 1995; Kessels and Malinow, 2009). Thus, we asked whether the deficits of LTP, particularly in its late phase, were paralleled with the abnormalities in spatial information acquisition. To answer this question, we carried out the Morris water maze tests. Prior to the tests, we tested the exploratory activity and locomotion of mice in the open field. We measured the floor plane movements (Figure 3A) and vertical plane entries (i.e. rearing, Figure 3B) as well as the stereotypic behaviors (i.e. grooming, Figure 3C) and found that all parameters examined were normal in EPAC null alleles (n = 16 mice per group).
Figure 3. EPAC Null Mutation Impairs Spatial Learning and Social Interactions.

(A-C) Distance moved (A), rearing (B) and grooming (C) in the open field tests are identical among genotypes (mean ± SEM , n = 12 mice per group).
(D and E) EPAC null alleles show abnormalities in spatial learning. The latency (D) and swim path length to reach a hidden platform are plotted against the blocks of trials. A bar graph (E) shows the percentage of time spent in searching of a hidden platform in each quadrant during the probe trial (mean ± SEM, n =16 mice/group, *p < 0.01, compared to the EPAC+/- and IN-EPAC+/+ mice, respectively).
(F and G) EPAC null alleles show the abnormalities in reversal learning. The latency (F) to reach a hidden platform and the percentage of time spent (G) in searching of a new hidden platform in each quadrant (mean ± SEM, n =16 mice/group, *p < 0.01, compared to the EPAC+/- and IN-EPAC+/+ mice, respectively).
(H) The latency to reach a visible platform is identical among genotypes (mean ± SEM, n =16 mice/group).
(I and J) Adult EPAC-/- mice have abnormal social interactions. Time spent in each chamber (I) and sniffing time (J) with an unfamiliar mouse and unfamiliar object during the 10-min test (mean ± SEM, n = 15 mice per group, *p < 0.01, compared to the EPAC+/- and IN-EPAC+/+ mice, respectively).
(K-M) EPAC- mice are abnormal in juvenile plays. Bar graphs show nose-to-nose sniffing (K), front approach (L) and push/crawl (M) with an unfamiliar mouse during juvenile play (mean ± SEM, n = 18 mice per group, *p < 0.01, compared to the EPAC+/+ and IN-EPAC+/+ mice, respectively).
We next trained adult male mice in the hidden platform version of the Morris water maze with four trials per day. Consistent with previous studies using pharmacological reagents (Ouyang et al., 2008), we found that EPAC null mutant mice had a significant longer latency and swim path length to reach the platform, compared to the other groups (Figure 3D, n = 16 mice/group, p < 0.01). At the end of the training, we placed mice for a one-day probe trial, in which the platform in the water maze was removed and mice were allowed to search the pool for 60 sec. Our data demonstrated that all groups, but not EPAC null mutants, had preference searching in the targeting quadrant (Figure 3E, n = 16 mice/group), showing the spatial learning and memory deficits in EPAC null alleles.
To further analyze the capacity of the spatial information acquisition, the same groups of mice were tested in the reversal water maze training, in which the hidden platform in the maze was placed to the opposite quadrant. We found that EPAC null mutants had longer latency to find new platform location (Figure 3F, n = 16 mice/group, p < 0.01) and spent less time in a newly trained quadrant (Figure 3G, n = 16 mice/group, p < 0.01). This finding indicates that EPAC null alleles had abnormal reversal learning. In the visible platform version of the water maze test, however, all mice showed the similar latencies to find the platform (Figure 3H, n = 16 mice/group, p < 0.01). Thus, the spatial learning and memory deficits were not associated with the abnormal gross performance in EPAC null alleles.
Social Behavioral Deficits in EPAC Alleles
EPAC genes are expressed in the hippocampus and in all other regions of the forebrain (Kawasaki et al., 1998). Thus, EPAC null mutation may have effects on the other categories of behaviors. For this consideration, we examined the social approach and preference of mice for exploring two different types of stimuli (the unfamiliar mouse and the unfamiliar object) in an automated three-chamber apparatus, as previously described (Silverman, et al., 2010). In this test, we used adult male mice at 90 ± 2 days old of age. We showed that EPAC null alleles spent only half as much time as other groups in the mouse site (Figure 3I) and in sniffing the unfamiliar mice (Figure 3J, n = 15 mice/group, p < 0.01). These data indicate that EPAC null mutation impairs the social behaviors.
We next asked whether this impairment of social interactions occurs in EPAC null alleles at the younger age. We carried out the juvenile play tests using the postnatal mice at 21 days old of age. In each of the tests, two unfamiliar male mice were paired for 30-min sessions of play in the arena. Consistent with the social deficits observed during the adulthood, the juvenile EPAC null alleles had fewer nose-to-nose sniffing (Figure 3K, n = 18 mice per group, p < 0.01), front approach (Figure 3L, n = 18 mice per group, p < 0.01) and push/crawl (Figure 3M, n = 18 mice per group, p < 0.01) to their pairs, compared to the age-matched control mice.
Expression of miR-124 in EPAC Null Alleles
Spatial learning and social behaviors are a complex of physiological responses that are involved in a variety of transcriptional and translational events (Soderling and Derkaxh, 2000; Kelleher et al., 2004). To determine which of these events are linked with EPAC null mutation, we examined small (∼21-23 nucleotides), non-coding RNA transcripts (miRNAs), which are known to negatively regulate the learning capacities via restricting mRNA translation (Bartel, 2004; He and Hannon, 2004; Schratt et al., 2006). We conducted the miRNA arrays with a total of 785 probe sets to compare the expression of miRNAs in the forebrain of EPAC-/- mice with the control littermates. Combined with qPCR analysis we found a number of brain-enriched miRNAs that were significantly altered in EPAC-/- mice (Figure 4A and 4B, n = 12 assays/6 mice/group); three were massively up-regulated whereas three were down-regulated (Figure 4A and 4B, n = 12 assays/6 mice/group). Of these miRNAs, miR-124 is of particularly interest because of its ability to coordinate synaptic functions in memory consolidation (Rajasethupathy et al., 2009; Fischbach and Carew, 2009; Arvanitis et al., 2010).
Figure 4. miR-124 Inhibits Zif268 mRNA translation.
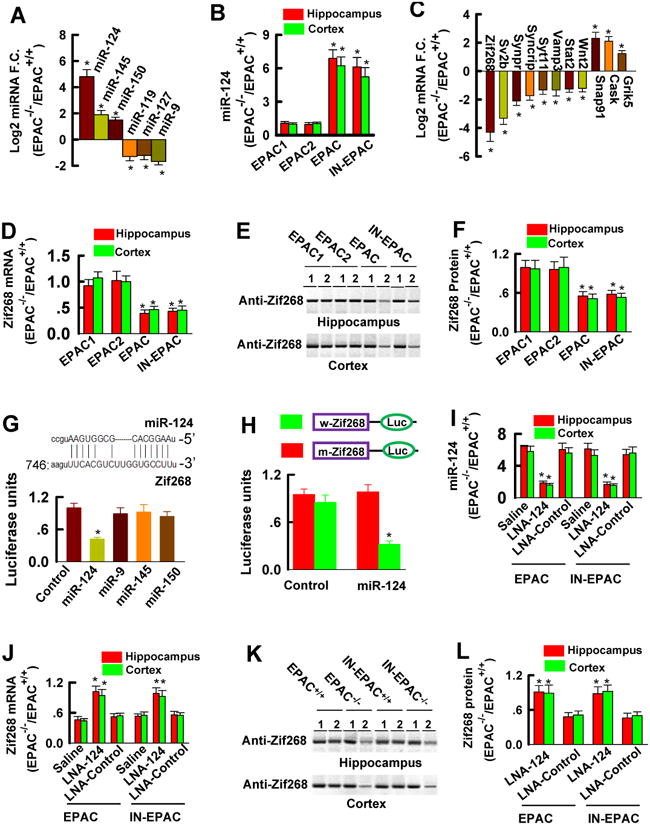
(A) miRNA array shows miRNA fold changes (F.C.) in the forebrain of EPAC-/- mice versus EPAC+/+ mice (mean ±SEM, n = 12 assay, *p < 0.01).
(B) qPCR shows miR-124 in the hippocampus and the prefrontal cortex of adult mice (mean ± SEM, n = 6, *p < 0.01).
(C) mRNA array shows mRNA fold changes (F.C.) in the forebrain of EPAC-/- mice versus EPAC+/+ mice (mean ±SEM, n = 12 assay, *p < 0.01).
(D) qPCR shows Zif268 mRNA in the hippocampus and prefrontal cortex of adult mice (mean ± SEM, n = 6, *p < 0.01).
(E and F) Representative (E) and summarized data (F) show Zif268 protein levels in the homozygous mutants (lane 1) and control littermates (lane 2) (mean ± SEM, n = 4, *p < 0.01).
(G and H) miR-124 binding sequence in the 3′ UTR region of Zif268 and inhibits the wildtype (G), but not the mutant (H), Zif268 3′UTR luciferase activity (mean ± SEM, n = 4, *p < 0.01, compared to control).
(I) qPCR shows miR-124 in the hippocampus and the prefrontal cortex 48 hours after the injections of LNA-miR-124 or LNA-control, or saline (Mean ± SEM, n = 6 assays, *p < 0.01, compared to control).
(J) Zif268 mRNA in adult mice 48 hours after injection of saline or LNA-miR-124 (LNA-124) or LNA-control. Data are expressed as the ratio of mRNA in EPAC-/- versus EPAC+/+ mice (mean ± SEM , n = 6 assays/3 mice, *p < 0.01, compared to saline).
(K and L) Representative (K) and summarized Zif268 protein (L) in adult mice 48 hours after injection of LNA-miR-124 (lane 1) or LNA-control (lane 2). Data are expressed as the ratio of band intensities in homozygous (-/-) versus wild-type control (+/+) (mean ± SEM, n = 6 assays/3 mice/group, *p < 0.01, compared to LNA-control).
miR-124 Inhibits Zif268 mRNA Translation
miR-124 binds to a complementary sequence (GUGCCU) in the mRNA 3′-untranslated region (3′UTR) and facilitates the mRNA degradation (Lim et al., 2005). To search for the specific mRNA targets of miR-124 in EPAC-/- mice, we carried out a genome-wide gene expression analysis with 36,422 probe sets (Figure S2). We identified 11 genes that were significantly altered in EPAC-/- mice (Figure 4C, also see Figure S2). The most notable gene was Zif268, also known as Egr1; it was dramatically down-regulated (Figure 4C-4F, n = 12 assays/6 mice per group). Zif268 encodes a zinc finger transcription factor essential for stabilizing synaptic plasticity and spatial learning (Hall et al., 2000; Jones et al., 2001; Bozon et al., 2003; Baumgartel et al., 2008; Renaudineau et al., 2009). Since Zif268 contains a miR-124 conserved binding site in its 3′UTR region (Figure 4G), we hypothesize that miR-124 binds directly to and inhibits Zif268 mRNA translation. To test this hypothesis, we created a wild-type 3′UTR segment and its mutant of Zif268 and placed these segments into the luciferase reporter system. When co-expressed with miR-124, a wild-type reporter showed significant inhibition (Figure 4H, n = 4), compared to its mutant, demonstrating that miR-124 directly targets to Zif268.
Knockdown of miR-124 Rescues the EPAC-/- Phenotypes
To directly determine whether miR-124 inhibition of Zif268 mediates the EPAC-/- phenotypes, we created a saline-formulated, locked-nucleic acid-modified (LNA) anti-sense oligonucleotide (LNA-miR-124). As a control, we used LNA-negative (LNA-control, or control). We injected 3 μl of LNA-miR-124 (50 mg/ml) or LNA-control directly into the third ventricle of adult mice. 48 hrs after the injection, real-time PCR was used to analyze miR-124. We found that LNA-miR-124 induced a stable silencing of miR-124 in the hippocampus and the prefrontal cortex, whereas LNA-control did not (Figure 4I, n = 6 assays/3 mice). Following inhibition of endogenous miR-124, Zif268 mRNA (Figure 4J, n = 6 assays/3 mice) and protein (Figure 4K and 4L, n = 6 assays/3 mice) in EPAC-/- mice were elevated to a level comparable with that in EPAC+/+ mice.
Although knockdown of miR-124 produced little effect on synaptic transmission (Figure 5A, n = 10 recordings/5 mice/group), it completely restored the capacity of EPAC-/- neurons to express LTP (Figure 5B, n = 12 recordings/6 mice/group, p < 0.01) and resulted in a significant improvement of spatial learning (Figure 5C-5E, n = 16 mice/group, p < 0.01) and social interactions in both adult (Figure 5F and 5G, n = 16 mice/group, p < 0.01) and juvenile (Figure 5H, n = 18 mice/group, p < 0.01) EPAC-/- mice. Thus, LTP and the behavioral deficits observed in EPAC null alleles can be reversed by knockdown of miR-124.
Figure 5. Knockdown of miR-124 Rescues the EPAC-/- Phenotypes.

(A) LNA-miR-124 produces no effects on basal synaptic transmission. Representative EPSCs are recorded at the holding potential of – 70mV in response to stimulus intensities from 1 to 4 mV at an interval of 0.5 mV in slices from mice 48 hours after the injection of LNA-miR-124 (LNA-124). The peak amplitudes of EPSCs are normalized to the baseline (defined as 1.0) and plotted against the stimulus intensity (mean ± SEM, n = 10 recordings/5 mice/group).
(B) LNA-miR-124 reverses the LTP deficits in EPAC-/- neurons. The peak amplitudes of EPSPs are normalized to the baseline (defined as 1.0). EPSPs sweeps (above the graphs) taken at the time indicated by the letter on the x axis. Arrow indicates the time of tetanus. Data are mean ± SEM (n =12 recordings/6 mice/group).
(C-E) LNA-miR-124 rescues the spatial learning deficits in EPAC null alleles. The latency (C) and swim path length (D) to reach a hidden platform in the Morris water maze are plotted against the blocks of trials. A bar graph (E) shows the percentage of time spent in searching of a hidden platform in each quadrant during the probe trial (mean ± SEM, n =16 mice/group, *p < 0.01, compared to the injection of LNA-control in EPAC+/+ mice).
(F and G) LNA-miR-124 rescues the social behavioral deficits in EPAC null alleles. Time spent in each chamber (F) and sniffing time (G) with an unfamiliar mouse and unfamiliar object during the 10-min test (mean ± SEM, n = 16 mice per group, *p < 0.01, compared to the LNA-control in EPAC+/+ mice).
(H) LNA-miR-124 improves the juvenile plays of EPAC-/- mice. The push/crawl and the nose-to-nose sniffing with an unfamiliar mouse during juvenile play (mean ± SEM, n = 18 mice per group, *p < 0.01, compared to the LNA-control in EPAC+/+ mice).
Expression of miR-124 Mimics the Effects of EPAC Null Mutation
We next investigated whether expression of miR-124 mimics the effects of EPAC null mutation. We constructed type 1/2 recombinant adeno-associated virus (rAAV1/2) vectors to express miR-124 (rAAV1/2-miR-124, Figure 6A). As a control, a negative miRNA sequence (GTGTAACACGTCTATACGCCCA, rAAV1/2-control, or control) was expressed. We found that expression of miR-124 in the hippocampus of EPAC+/+ mice reduced the endogenous Zif268 to a level similar to that observed in EPAC-/- mice (Figure 6B and 6C, n = 4, p < 0.01). When miR-124 was expressed in the hippocampus of EPAC-/- mice, however, there was no further decrease of Zif268 (Figure 6C, n = 4, p < 0.01), indicating that EPAC null mutation occludes the inhibitory effects of miR-124 on Zif268 translation. This inhibition was specific since expression of miR-124 had no effect on several other genes (Figure 6B, n = 6, p < 0.01), including cyclic AMP-response element binding protein (CREB) and brain-derived growth factor (BDNF). Importantly, we found that expression of miR-124 did not alter the basal synaptic transmission (Figure 6D and 6E, n = 12 recordings/6 mice/group), but it resulted in a loss of a late phase of LTP (Figure 6F and 6G, n = 15 recordings/5 mice/group, p < 0.01) and disrupted the spatial learning and memory (Figure 6H-6K, n = 15 mice per group, *p < 0.01). Notably, however, the social behaviors were normal when miR-124 was expressed in the hippocampus (Figure 6L-6N, n = 15 mice per group).
Figure 6. miR-124 Mimics the Effects of EPAC Null Mutation.
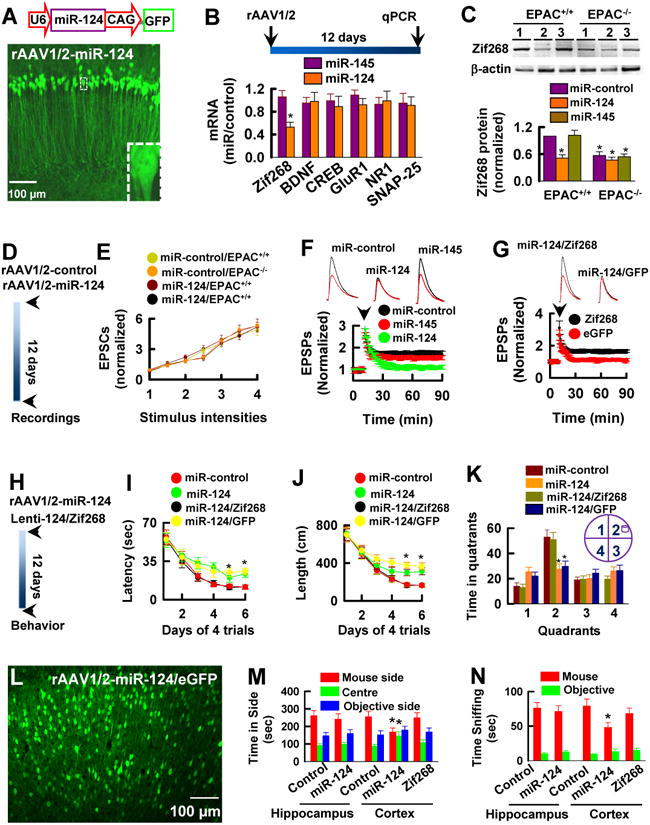
(A) The rAAV1/2 vector (top) for expression of miR-124 and eGFP and a representative image (bottom) is taken in the hippocampus of adult mice 12 days after the rAAV1/2-124 injection.
(B) miR-124 inhibits Zif268 mRNA expression. qPCR shows mRNA expression profiling in the hippocampus of adult mice 12 days after injection of rAAV1/2-miR-124 (miR-124) or rAAV1/2-miR-145 (miR-145) and rAAV1/2-negative control (control). Data are expressed as the ratio of miR-124 or miR-145 expression versus control (mean ± SEM, n = 4 assays, *p < 0.01, compared to miR-145).
(C) miR-124 reduces Zif268 protein expression. Western blots of Zif268 protein in the hippocampus of adult mice 12 days after expression of control (lane 1) or miR-124 (lane 2) or miR-145 (lane 3). The intensities of each band are normalized to β-actin in EPAC+/+ mice control lane (mean ± SEM, n = 4 assays, *p < 0.01, compared to miR-control in EPAC+/+ mice).
(D and E) miR-124 produces no effects on basal synaptic transmission. The experimental schedule (D) and the amplitudes of EPSCs (E) normalized to the baseline (defined as 1.0) and plotted against the stimulus intensity (mean ± SEM, n = 12).
(F and G) miR-124 inhibits LTP expression. The peak amplitudes of EPSPs are normalized to the baseline (defined as 1.0). EPSPs sweeps taken at the time indicated by the letter on the x axis. Arrow indicates the time of tetanus. Data are mean ± SEM (n =15 recordings/5 mice/group).
(H-K) miR-124 causes the spatial learning deficits. The experimental schedule (H) and the latency (I) and swim path length (J) to reach a hidden platform are plotted against the blocks of trials. The percentage of time spent (K) in searching of a hidden platform in each quadrant during the probe trial (mean ± SEM, n =15 mice/group, *p < 0.01, compared to miR-control).
(L-N) Expression of miR-124 in the prefrontal cortex but not in the hippocampus causes the social behavioral deficits. An image shows miR-124-eGFP in the prefrontal cortex of adult male mice 12 days after the injection of the rAAV1/2-miR-124-IRES-eGFP. Bar graphs show the time spent in each chamber (M) and sniffing time (N) with an unfamiliar mouse and unfamiliar object (mean ± SEM, n = 15 mice/group, *p < 0.01, compared to control).
It has been known that the social behaviors are largely processed in the prefrontal cortex of the brain (Walsh et al., 2008; Silverman et al., 2010). We thus expressed miR-124 in this region by injection of the rAAV1/2-miR-124/eGFP virus particles and found it did cause the social behavioral deficits (Figure 6L-6N, n = 15 mice per group). Significantly, miR-124 phenotypes including the deficits of LTP (Figure 6G, n = 12 recordings/ 6 mice/ group, p < 0.01), spatial learning (Figure 6H-6K, n = 15 mice per groups) and social behaviors (Figure 6L-6N, n = 15 mice per groups) can be reproduced by knockdown of endogenous Zif268 using LNA-Zif268 antisense (Figure S3, n = 13 mice per groups). Together, these results demonstrate that miR-124 transcription mediates the EPAC effects in regulation of LTP, spatial learning and social interactions by controlling Zif268 translation.
EPAC-Rap1 Signaling Restricts miR-124 Transcription
EPAC proteins activate Rap1 guanine nucleotide exchange factor (de Rooij et al., 1998; Kawasaki et al., 1998; Zhang et al., 2009), which is implicated in a wide range of neuronal responses including gene expression, cell proliferation, differentiation and synaptic plasticity (Zhu et al., 2002; Stork, 2003; Schwamborn and Puschel, 2004; Liu et al., 2010). To determine whether Rap1 is linked directly with miR-124 transcription, we performed Chromatin Immunoprecipitation (ChIP) with anti-Rap1 antibody. We identified a physical association of Rap1 with the regulatory element (R1 site) upstream of miR-124 transcript (Figure 7A, n = 4 assays, p < 0.01). We subsequently cloned the R1 fragment in a miR-124 luciferase reporter construct. Co-expression of the reporter with a wild-type Rap1a suppressed miR-124 transcription in HEK293 cells in vitro (Figure 7B, n = 4 assays, p < 0.01) as well as in the hippocampal neurons (Figure 7C, n = 5 assays, p < 0.01). As a control, we expressed a dominant-negative mutant Rap1 (Rap1aS17N), which blocks the endogenous Rap1 by sequestering and depleting the intracellular pool of the available GEF (Farnsworth, et al., 1991) and we found that it produced little effect on miR-124 transcription (Figure 7B and 7C).
Figure 7. Rap1 Restricts miR-124 Transcription.
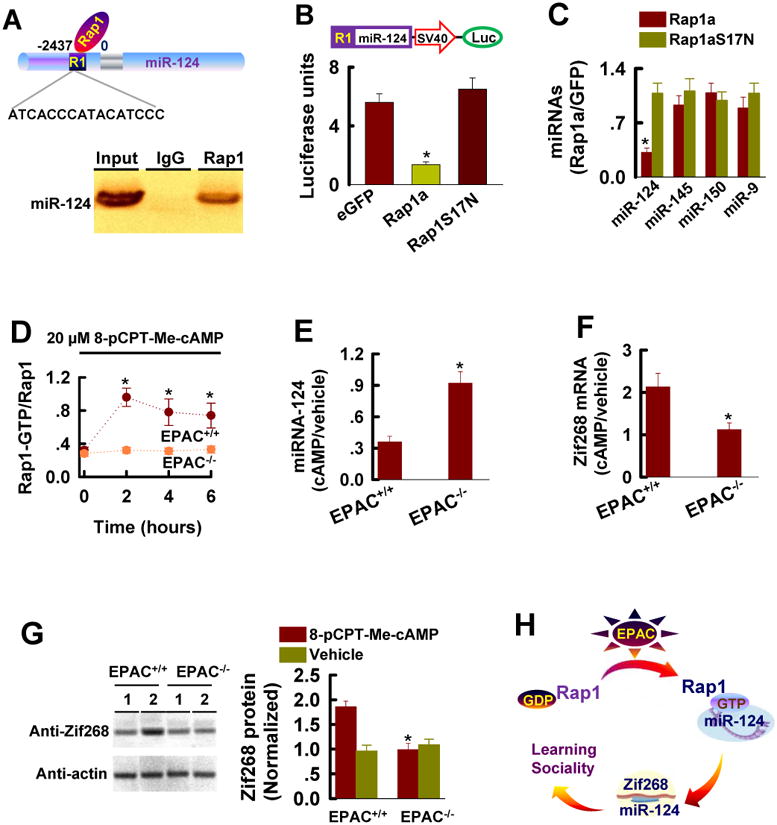
(A) Rap1binds a sequence in the stem-loop precursor of miR-124 transcript (top). Northern blot (bottom) shows miR-124 precursor in the ChIP.
(B) Expression of miR-124 luciferase reporter construction (top) with wild-type Rap1a in HEK293 cells have lower luciferase activity, compared with controls (eGFP or Rap1aS17N). Data are mean ± SEM (n = 4, *p < 0.01).
(C) Rap1 inhibits miR-124 transcription in the hippocampal neurons. qPCR analysis of miRNA in the neuronal cultures (DIV16) from the mouse hippocampus 72 hours after expression of a dominant mutant Rap1a (Rap1aS17N) or wild-type Rap1a. Data are the miRNA fold changes in cells expressing Rap1aS17N or Rap1a versus eGFP (mean ± SEM, n = 4 assays, *p < 0.01 compared to Rap1aS17N).
(D) Rap1 activity, as expressed the ratio of Rap1-GTP versus Rap1 is measured at the indicated time points after incubation of neuronal cultures (DIV16) with 20 μM 8-pCPT-Me-cAMP. Data are mean ± SEM (n = 5 assays, *p < 0.01, compared to a time point of 0 hour).
(E) miR-124 is measured 6 hours after incubation of the EPAC+/+ or EPAC-/-neuronal cultures (DIV16) with 20 μM 8-pCPT-Me-cAMP or vehicle. Data are expressed as the ratio of 8-pCPT-Me-cAMP (cAMP) treatment versus vehicle (mean ± SEM , n = 5 assays, *p < 0.01, compared to EPAC-/- neurons).
(F) Zif268 mRNA is measured 6 hours after incubation of the EPAC+/+ or EPAC-/-neuronal cultures (DIV16) with 20 μM 8-pCPT-Me-cAMP or vehicle. Data are expressed as the ratio of 8-pCPT-Me-cAMP (cAMP) treatment versus vehicle (mean ± SEM , n = 5 assays, *p < 0.01, compared to EPAC-/- neurons).
(G) Zif268 protein is measured 6 hours after incubation of the EPAC+/+ or EPAC-/-neuronal cultures (DIV16) with vehicle (lane 1) or 20 μM 8-pCPT-Me-cAMP (lane 2). Band intensities are normalized to actin in vehicle treated EPAC+/+ neurons (mean ± SEM , n = 5 assays, *p < 0.01, compared to vehicle).
(H) A working model demonstrating that miR-124 inhibition of Zif268 translation constitutes a specific signaling event downstream of EPAC proteins in regulation of plasticity, and spatial learning as well as social interactions.
We next asked whether activation of endogenous Rap1 by application of EPAC agonist suppresses miR-124 transcription in the central neurons. We treated the neuronal cultures (DIV16) with 8-pCPT-2′-Me-cAMP-AM, which is known to selectively activate both EPAC1 and EPAC2 proteins (Chepurny et al., 2009). Our data showed that 8-pCPT-2′-Me-cAMP-AM at a concentration of 20 μM activated Rap1 in EPAC+/+ but not in EPAC-/- neurons (Figure 7D, n =4 assays) and this effect of 8-pCPT-2′-Me-cAMP-AM was observed in 60 min and lasted for over 6 hours after the treatment (Figure 7D, n =4 assays). As expected, application of 8-pCPT-2′-Me-cAMP-AM, but not vehicle, reduced miR-124 transcription (Figure 7E, n = 4 assays) and significantly, this reduction was closely associated with a robust increase of Zif268 mRNA (Figure 7F and 7G, n =4 assays). Collectively, these data demonstrate that EPAC signaling directly controls miR-124 transcription and Zif268 translation via activation of Rap1.
Discussion
In the present study, we show that a combined deletion of both EPAC1 and EPAC2 genes inactivates Rap1, whereas a single deletion of either gene does not, indicating a synergistic action between EPAC1 and EPAC2 proteins in the brain. Our results also reveal that Rap1 is physically associated the regulatory element upstream of miR-124 gene and restricts miR-124 transcription. We further identify that miR-124 binds to and inhibits Zif268 translation. Zif268 is a transcriptional factor essential for activity-dependent change of synaptic transmission and cognition (Hall et al., 2000; Jones et al., 2001; Bozon et al., 2003; Baumgartel et al., 2008; Renaudineau et al., 2009). Thus, most parsimonious explanation for our present findings is that upon EPAC null mutation, an inactivation of Rap1 relieves the restriction of miR-124 transcription and hence induces miR-124 expression. Expression of miR-124 facilitates Zif268 mRNA degradation and results in the deficits of spatial learning and social interactions, as illustrated in Figure 7H.
The behavioral deficits observed in EPAC-/- mice are not due to the developmental abnormalities since every facet of these phenotypes is found in an inducible mutant line (IN-EPAC-/-), in which EPAC1 gene is deleted after development is completed. Additionally, all EPAC null alleles are found to be vital and fertile and have normal neuronal structures. Notably, our results indicate that LTP and the behavioral defects in EPAC null mutants are directly linked with a striking increase of miR-124 transcription; knockdown of miR-124 by administration of LNA-miR-124 completely reverses, whereas over-expression of miR-124 reproduces, all aspects of the EPAC-/- phenotypes.
It should be mentioned that previous studies reported that miR-124 expression was elevated in the brain during development (Krichevsky et al., 2003; Stark et al., 2004) and that miR-124 stimulated neuronal differentiation in chick spinal cord (Visvanathan et al., 2007), suggesting the involvement of miR-124 in neuronal developmental processes. However, our results reveal that although miR-124 is increased, neurons in the brain are developmentally normal in EPAC-/- mice. Consistent with our findings, several other studies demonstrated that genetic ablation of miR-124 either in C.elegans (Clark et al., 2010) or in chick spinal cord (Cao et al., 2007) did not result in any obvious defects in neuronal differentiation. Thus, roles of endogenous miR-124 in brain development need to be further investigated.
Previous studies using pharmacological reagents showed that EPAC signaling pathway regulates vesicular release probability and the number of releasable vesicles in the central neurons (Sakaba and Neher, 2003; Zhong and Zucker, 2005), but the mechanism underlying this regulation remains unknown. An earlier report indicated that EPAC2 protein interacts directly with Rim2 and controls insulin secretion in p-cells (Fhjimoto et al., 2002). Rim proteins including Rim1 and Rim2 interacts with voltage-gated P/Q- and N-type Ca2+ channels in the central neurons and controls synaptic vesicle fusion in the active zone of the terminals (Kaeser et al., 2011). Thus, it is probably that genetic deletion of EPAC genes impairs a Rim-associated vesicle fusion event, leading to a reduction of transmitter release from the pre-synaptic terminals. Consistent with this notion, our data showed that genetic deletion of EPAC genes weakened the strength of synaptic transmission in the central neurons. It is also noted that the weakening of synaptic transmission was associated with down-regulation of several synaptic genes in the forebrain of EPAC null alleles. The most notable gene is Sv2b, which decreased in EPAC null alleles by 46 ± 5.2 % of control (Figure 4C and Figure S2). Sv2b is a synaptic vesicle protein that functions as redundant Ca2+ regulator in neurotransmitter release (Janz et al., 1999; Custer et al., 2006). Thus, decays of the basal synaptic transmission in EPAC-/- neurons could be also due to a reduction of Sv2b expression.
Our electrophysiological recordings show that LTP is impaired in EPAC-/- neurons, indicating that functions of EPAC proteins extend beyond the basal synaptic transmission. LTP is an activity-dependent long-lasting enhancement of synaptic transmission and is one major form of plasticity in the central neurons (Nicoll and Malenka, 1995). The induction (during tetanus) of LTP requires activation of post-synaptic NMDA receptors (Nicoll and Malenka, 1995) whereas expression of LTP or a late phase of LTP (i.e. 60 min after the induction), is involved of a series of the genomic responses for rapid new gene expression (Soderling and Derkaxh, 2000; Kelleher et al., 2004). Consistent with this general idea, our data reveal that both NMDA receptor channel activity at post-synaptic sites and LTP induction are normal in EPAC-/- neurons. Interestingly, our data demonstrate that a late phase of LTP is impaired in EPAC-/- mice and that this impairment correlates with a striking increase of miR-124 transcription, which caused Zif268 mRNA degradation. Zif268 is known as a critical transcriptional factor for stabilizing synaptic responses in LTP expression (Hall et al., 2000). Notably, either knockdown of miR-124 or expression of Zif268 is able to restore the capacity of EPAC-/- neurons to express LTP. Thus, EPAC signaling is directly linked with a key aspect of the genomic responses including miR-124 transcription and Zif268 translation for LTP expression.
Several rare non-synonymous variants of EPAC genes were reported in patients with ASDs (Baccchelli et al., 2003) and one of them was found to be the loss of function mutation (Woolfrey et al., 2009). But the implications of these mutations in ASDs behaviors are not characterized yet. ASDs patients have been diagnosed as the abnormalities of social interactions and mental retardation (Geschwind and Levitt, 2007; Kelleher and Bear, 2008; Ramocki and Zoghbi, 2008). Additionally, the most human ASDs show poor language development and restricted and repetitive behaviors (Walsh et al., 2008; Levy et al., 2009). In our present study, we show that genetic deletion of EPAC genes specifically defects the spatial learning and social interactions, suggesting a possibly mechanism by which the mutation of EPAC genes might reflect these ASDs behaviors.
In conclusion, our results in the present studies provide genome-wide evidence that EPAC1 and EPAC2 proteins synergistically regulates miR-124 transcription and hence control Zif268 translation in the brain for processing spatial learning and social interactions.
Experimental Procedures
Animals
Care and experiments with animals were in accordance with institutional guidelines and those of the National Institute of Health and the Animal Care and Use Committee (Huazhong University of Science and Technology, Wuhan, China, Louisiana State University Health Sciences Center, New Orleans). Adult (90 ± 2 days old of age) male 129Sv strain of mice was used and grouped as the followings for the behavioral tests; 1) the open field tests, 2) the Morris water maze tests, reversal learning test, and visible platform version of the maze tests, and 3) the social behavioral tests. The juvenile male 129sv strain of mice at 21 ±1 days old of age were used for the juvenile play tests. All wild-type control (+/+) and homozygous (-/-) mice were derived from the same litters of the heterozygous (+/-) breading pairs.
Generation of EPAC1 and EPAC2 Mutant Mice
EPAC1 is ubiquitously expressed throughout the brain and the peripheral tissues. To identify the specific impacts of EPAC1 deletion in brain function, we generated a conditional mutant strain of mice with a selective deletion of EPAC1 in the hippocampus (EPAC1-/- mice) by gene targeting in embryonic stem (ES) cells. The mouse Rapgef3 region was isolated from a genomic mouse BAC library of 129Sv background, which was isogenic to the ES cell line that was used for the homologous recombination. The rTgV BAC clone collection containing genomic fragments of 15-25 kb in size was screened by PCR using the primers listed in table S1. The first primer pair amplified a 412 bp genomic fragment of Rapgef3 gene in intron 2 and the second primer pair amplified a 682 bp genomic fragment of Rapgef 3 gene intron 6. The isolated clone rTgV was subsequently analyzed by sequencing approximately 12 kb of the gene region that was used for the homology arms of the targeting vector. Two loxP sites were inserted into the flanking Rapgef3 exons 3 to 6 with a long homology region of 6.3 kb and a short homology region of 1.6 kb. The positive selection neomycin gene (Neo) was flanked by FRT sites. Diphtheria Toxin A (DTA) was used as a negative selection marker for avoiding the isolation of non-homologous recombined ES cell clones and enhancing the chance of isolating ES cell clones harboring the distal loxP site. The integrity of the recombined region was verified by DNA sequencing (see also Extended Experimental Procedures).
Electrophysiology
The slices (350 μm) of the hippocampus were cut from male mice at 90 ± 5 days old of age and were placed in a holding chamber for at least 1 hr. A single slice was then transferred to the recording chamber and submerged and perfused with artificial CSF (ACSF, 2 ml/min) that had been saturated with 95% O2-5% CO2. The composition of the ACSF was (in mM): 124 NaCl, 3 KCl, 1.25 NaH2PO4, 2 MgCl2, 2 CaCl2, 26 NaHCO3, and 10 dextrose. Whole-cell patch clamp recordings (5 MΩ) at voltage-clamp mode, and the sharp electrode (50 ± 2 MΩ) intracellular recordings at current-clamp mode in the hippocampus were visualized with IR-DIC using an Axioskop 2FS equipped with Hamamatsu C2400-07E optics, as described before (Wang et al., 2003; Liu et al., 2003; Peng et al., 2004; Tu et al., 2010, see also Extended Experimental Procedures).
Open Field Tests
Adult male mice at 90 ±2 days old of age were used in this study. Mice were placed in the center of an open-field arena (40 × 40 × 30 cm3) for 60 min and then habituated by daily placing in the same chamber for 10 min per day for three consecutive days. After the 3-day habituation, the general locomotion was assessed for a 30-min period. Specifically, we measured, 1) distance moved in the arena, 2) rearing, as the number of times the mice lifted both forepaws from the ground, and 3) grooming, as the time that the mice groomed with its mouth and/or paws.
Morris Water Maze Tests and the Reversal Maze Tests
Additional adult male mice at 90 ±2 days old of age were used in the hidden platform versions of the Morris water maze tests using Stoelting poo-60135 as described before (Tu et al., 2010, see also Extended Experimental Procedures).
Genome-wide Microarrays
The forebrain was isolated from mice and placed in RNAlater solution (Qiagen) and tissues were homogenized using a TissueRuptor homogenizer (50/60 Hz) according to the manufacturer's protocol. Total RNA was prepared from harvested hippocampal tissue with the miRNeasy Mini Kit (Qiagen) and treated with an RNase-free DNase (Qiagen) according to the manufacturer's instructions. The RNA concentration was measured by spectrophotometer (DU 640; BECKMAN). RNA integrity was verified by electrophoresis in a 1% agarose gel. For microRNA expression profiling analysis, Mouse OneArray™ v2 (RmiOA.2) chips with 785 unique miRNA probes and 105 experimental control probe sets (Phalanx Biotech Group) were used. For gene expression profiling analysis, mouse whole genome OneArray™ microarray v2 (MOA-002) chips with 26,423 mouse genome probes and 872 experimental control probes were used.
Datasets for single and dual channel experiments were analyzed with GeneChip Robust Multichip Average (GC-RMA) and normalized using OneArray Software (Phalanx Biotech Group). All hybridized chips met standard quality control criteria were calculated as the fold-changes. The statistical relevance was expressed as the p values.
Reverse Transcription and Quantitative PCR (qPCR)
The miscript cDNA synthesis kit (Qiagen) was used for the reverse transcription reaction according to the manufacturer's instructions. We used 1 μg total RNA, with 4 μl 5× miscript reaction mix and 1 μl miscript reverse transcriptase. The total volume was 20 μl. Samples were incubated for 5 min at 25 °C. All samples were then heated to 42 °C for 30 min, and reactions were stopped by heating to 85 °C for 5 min. For qPCR all specific primers were selected using Beacon Designer Software (BioRad) and synthesized by IDT (Coralville, IA), as listed in Supplementary Table 1. The PCR amplification of each product was further assessed using 10-fold dilutions of mouse brain cDNA library as a template and found to be linear over five orders of magnitude and at greater than 95% efficiency. All the PCR products were verified by sequencing. The reactions were set up in duplicate in total volumes of 10 μl containing 5 μl 2× miscript sybr green pcr kit (Qiagen) and 2 μl template (1:10 dilution from RT product) with a final concentration of 400 nM of the primer. The PCR cycle was as follows: 95 °C/3 min, 45 cycles of 95 °C/30 sec, 58 °C/45 sec and 95 °C/1 min, and the melt-curve analysis was performed at the end of each experiment to verify that a single product per primer pair was amplified. Furthermore, the sizes of the amplified DNA fragments were verified by gel electrophoresis on a 3% agarose gel. The amplification and analysis were performed using an iCycler iQ Multicolor Real-Time PCR Detection System (BioRad). Samples were compared using the relative CT method. The fold increase or decrease was determined relative to a vehicle-treated control after normalizing to a housekeeping gene using 2-ΔΔCT, where ACT is (gene of interest CT) - (GAPDH CT), and ΔΔCT is (ΔCT treated) - (ΔCT control). The ranges of CT for GAPDH were from 17.6 to 18.1 (17.9 ± 0.1, n=6) for the vehicle control and 17.6 to 17.9 (17.8 ± 0.1, n=6) for the treatment with Δ9-THC.
Luciferase Reporters
A wild-type (GUGCCUU) and a mutant (CUUAAGU) Zif268 3′ UTR were cloned into the SV40-driven renilla luciferase reporter plasmid (psiCHECK™-2, Promega). HEK293 cells (3 × 10⁵ cells per well) were co-transfected with the pre-miRNA constructs or the empty control vector (pcDNA3.2/V5, 500 ng), or pre-miR-124 and wild-type or the mutant Zif268 3′ UTR plasmid (200 ng). Cells were harvested and cell lysates were assayed for firefly and renilla luciferase activities using the dual-luciferase reporter assay system (Promega) according to the manufacturer's protocol. The data were normalized to the co-transfected β-galactosidase plasmid (Invitrogen) and expressed as the relative luciferase activity (units). A wild-type human Ras family small GTP binding protein Rap1a and a dominant-negative mutant Rap1aS17N were co-expressed in HEK293 cells with the luciferase reporter vector containing a R1 fragment upstream of mi-R-124 transcript at kpnI and XhoI sites (Missouri S & T cDNA Resource Center).
Chromatin Immunoprecipitation (ChIP)
ChIP assay was performed using a magna ChIP™ G chromatin immunoprecipitation kit (Millipore) following the manufacture's protocol. Briefly, the cell cultures (3 × 10⁶ cells) from the forebrain were chemically cross-linked by Buffer A/formaldehyde/PBS mix with 1.1% final formaldehyde concentration in the presence of protease inhibitor cocktail II. 10 min after incubation, glycine (50 μM) was added to quench the formaldehyde, and cells were washed with 1 ml of ice cold PBS. Pellet cells were centrifuged for 5 min at 500 g, and re-suspended in ice cold buffer C. After 10 min incubation, pellet samples were centrifuged and re-suspended in 100 μl of the buffer D/PI mix. Shear DNA was generated by a sonicator to an optimal DNA fragment size of 200-1000 bp and incubated with 1 × ChIP elution buffer/PI mix and 5 μg anti-Rap1 antibody (BD Biosciences) or non-specific IgG and Protein G magnetic beads overnight with rotation at 4°C. Beads were washed five times with RIPA buffer and once with TE buffer containing 50 mM NaCl. Bound complexes were eluted from the beads by heating at 65°C with occasional vortexing and crosslinking was reversed by overnight incubation at 65°C. After immunoprecipitation, recovered chromatin fragments were subjected to Affymetrix microarray.
Generation of High Infectious rAAV1/2 and Lenti Virus Particles
Pre-miR-124 (Accession: MI0000716, sequence: AGGCCUCUCUCUCCGUGUUCACAGCGGACCUUGAUUUAAAUGUCCAUACAAUUAA GGCACGCGGUGAAUGCCAAGAAUGGGGCUG), and pre-miR-145 (accession: MI0000169, sequence: CUCACGGUCCAGUUUUCCCAGGAAUCCCUUGGAUGCUAAGAUGGGGAUUCCUGGA AAUACUGUUCUUGAG), and pre-miR-150 (accession: MI-0000172, sequence: CCCUGUCUCCCAACCCUUGUACCAGUGCUGUGCCUCAGACCCUGGUACAGGCCUG GGGGAUAGGG) were cloned into the rAVE construct containing eGFP through ApaI/KpnI (GenDetect, New Zealand), creating a vector rAVE-U6/miR-124-IRES-CAP/eGFP, rAVE-U6/miR-145-IRES-CAP/eGFP and rAVE-U6/miR-150-IRES-CAG/eGFP vectors. The rAVE plasmids were co-transfected with the AAV helper1 and helper 2 into HEK293 cells to generate the rAAV1/2 virus particles. The constructs of lenti-Zif268-IRES-eGFP were generated by cloning the cDNA encoding Zif268 gene (pcDNA3-Egr1, Addgene) into the lenti-IRES-eGFP vectors (Invitrogen) under the control of the CMV promoter. Generation of the infectious virus particles (> 2 × 10¹⁰ genomic particle/ml) were described previously (Wang et al., 2003; Liu et al., 2003; Peng et al., 2004; Tu et al., 2010]). Activated virus particles were coded by experimenters (D.L and X.S). Other experimenters (Y.Y and W.T), who were unaware of the coded particles, injected the particles (2 μl at 0.2 μl/min) into each side of the dorsal hippocampus (3.1 mm posterior to bregma; 2.3 mm lateral to the midline; 2.9 mm below dura, or the prefrontal cortex.
In this study, 12 days (otherwise, as indicated in the test) after the virus injection, mice were used for the phenotyping assays including miRNA, mRNA and protein expression assays, electrophysiological recordings, and behavioral tests.
Administration of LNA-miR-124 and LNA-Zif268
LNA-miR-124, LNA-miR-145, LNA-control (GTGTAACACGTCTATACGCCCA), and LNA-Zif268 antisense (GGTAGTTGTCCATGGTGG) were purchased from Exigon (Woburn, MA), and dissolved in saline with a concentration of 50 mg/ml. 3 μl solution was then injected directly into the third ventricle. Experiments including qPCR, Western blot, electrophysiological recordings and behavioral tests were conducted 48 hours after the injection.
GEF for Rap1 Assay
EPAC-GEF activity was analyzed using Rap1 activation assay kit (Millipore) according the manufacture's instruction. Briefly, the hippocampus was isolated from adult male mice (the homozygous mutants and control littermates) at 90 ± 5 days old of age. Cell lysates were prepared using assay buffer (20 mM HEPES [pH 7.4], 150 mM NaCl, 50 mM KF, 50 mM β-glycerolphosphate, 5 mM MgCl2, 1 mM Na3VO4, 1% Triton X-100, 10% glycerol plus 1× protease inhibitor cocktail). Total cell lysates (400 μg) were incubated with 25 μl of recombinant GST-Ral GDS-RBD agarose (650 μg protein per ml of resin) by end-over-end rotation at 4°C for 1 h. The resins were recovered and washed as described above for the precipitation assay. The resin-bound fractions were resolved by sodium dodecyl sulfate-polyacrylamide gel electrophoresis, and cellular GTP-Rap1 levels were analyzed by immunoblotting with anti-Rap1-GTP and anti-rap1, respectively. The band intensities were then normalized to anti-Rap1 in the input lane (defined as 1.0).
In this study, 8-pCPT-2′-O-Me-cAMP-AM (BioLog Life Science Institute, Bremen, Germany) was dissolved in a vehicle solution containing 0.1% DMSO and 0.1%BSA.
Electron Microscopy
The sections from the CA1 stratum radiatum of the hippocampus of three male EPAC-/- at 96 days old of age and three control littermates (EPAC+/+ mice) were studied. Mice were perfused with 2% paraformaldehyde + 2% glutaraldehyde in 0.1 M phosphate buffer, then postfixed in 1% osmium tetroxide in 0.1 M cacodylate buffer, stained en bloc with 1% uranyl acetate in 50% ethanol, dehydrated in an ethanol series and then put in propylene oxide and embedded in epon. Thin sections were stained with lead citrate.
Golgi Staining and Synaptic Spine Analysis
Golgi staining was performed on four strains of male mutant mice and their respective wild-type controls at 90 ±5 days old of age. In this study, FD rapid Golgi Stain kit (FD NeuroTechnologies, ) was used. Briefly, brains were removed from mice and immediately immersed in solution A and B for 2 weeks at room temperature and transferred into solution C for 24 hours at 4°C, as instructed on the manufacture's experimental methods. The brains were sliced using a Vibratome (VT1000S; Leica) at a thickness of 100 μm. Bright-field microscopy (Axio Observer; Zeiss) images were taken of CA1 pyramidal neurons (80 cell with a total of 80 cm length of dendrites per group were analyzed). Images were coded and synaptic spines counted in software with Image Probes. All the spines counted were also measured for spine length and spine densities were expressed as spine/μm dendrite.
Statistics
Comparisons between genotypes were carried out using two-way ANOVA. Electrophysiological experiments and biochemical assays were analyzed using the Student t-test. LTP analysis was performed on 10 min blocks of data within the last 30 min of the recording.
Supplementary Material
Acknowledgments
This work was supported by National Natural Science Foundation of China (Grant 81130079 YL), National Institute of Health (NIH/NINDS, R01NS5051383Y.L and NIH/NIA R01AG033282Y.L), the New Century Excellent Talents in University (NCET-10-0421, LQZ) and the NIH/NIDCD Intramural Program (RSP and YXW).
Footnotes
Publisher's Disclaimer: This is a PDF file of an unedited manuscript that has been accepted for publication. As a service to our customers we are providing this early version of the manuscript. The manuscript will undergo copyediting, typesetting, and review of the resulting proof before it is published in its final citable form. Please note that during the production process errors may be discovered which could affect the content, and all legal disclaimers that apply to the journal pertain.
References
- Arvanitis DN, Jungas T, Behar A, Davy A. Ephrin-B1 reverse signaling controls a posttranscriptional feedback mechanism via miR-124. Mol Cell Biol. 2010;30:2508–2517. doi: 10.1128/MCB.01620-09. [DOI] [PMC free article] [PubMed] [Google Scholar]
- Bacchelli E, et al. Screening of nine candidate genes for autism on chromosome 2q reveals rare nonsynonymous variants in the cAMP-GEFII gene. Mol Psychiatry. 2003;8:916–924. doi: 10.1038/sj.mp.4001340. [DOI] [PubMed] [Google Scholar]
- Bartel DP. MicroRNAs: genomics, biogenesis, mechanism, and function. Cell. 2004;116:281–297. doi: 10.1016/s0092-8674(04)00045-5. [DOI] [PubMed] [Google Scholar]
- Baumgärtel K, Genoux D, Welzl H, Tweedie-Cullen RY, Koshibu K, Livingstone-Zatchej M, Mamie C, Mansuy IM. Control of the establishment of aversive memory by calcineurin and Zif268. Nat Neurosci. 2008;11:572–578. doi: 10.1038/nn.2113. [DOI] [PubMed] [Google Scholar]
- Benito E, Barco A. CREB's control of intrinsic and synaptic plasticity: implications for CREB-dependent memory models. Trends Neurosci. 2010;33:230–240. doi: 10.1016/j.tins.2010.02.001. [DOI] [PubMed] [Google Scholar]
- Bliss TV, Collingridge GL. A synaptic model of memory. Nature. 1993;361:31–39. doi: 10.1038/361031a0. [DOI] [PubMed] [Google Scholar]
- Bos JL. Epac proteins: multi-purpose cAMP targets. Trends Biochem Sci. 2006;31:680–686. doi: 10.1016/j.tibs.2006.10.002. [DOI] [PubMed] [Google Scholar]
- Bozon B, Davis S, Laroche S. A requirement for the immediate early gene zif268 in reconsolidation of recognition memory after retrieval. Neuron. 2003;40:695–701. doi: 10.1016/s0896-6273(03)00674-3. [DOI] [PubMed] [Google Scholar]
- Cao X, Pfaff SL, Gage FH. A functional study of miR-124 in the developing neural tube. Genes Dev. 2007;21:531–536. doi: 10.1101/gad.1519207. [DOI] [PMC free article] [PubMed] [Google Scholar]
- Chepurny OG, Leech CA, Kelley GG, Dzhura I, Dzhura E, Li X, Rindler MJ, Schwede F, Genieser HG, Holz GG. Enhanced Rap1 activation and insulin secretagogue properties of an acetoxymethyl ester of an Epac-selective cyclic AMP analog in rat INS-1 cells: studies with 8-pCPT-2′-O-Me-cAMP-AM. J Biol Chem. 2009;284:10728–10736. doi: 10.1074/jbc.M900166200. [DOI] [PMC free article] [PubMed] [Google Scholar]
- Clark AM, Goldstein LD, Tevlin M, Tavaré S, Shaham S, Miska EA. The microRNA miR-124 controls gene expression in the sensory nervous system of Caenorhabditis elegans. Nucleic Acids Res. 2010;38:3780–3793. doi: 10.1093/nar/gkq083. [DOI] [PMC free article] [PubMed] [Google Scholar]
- Custer K, Austin NS, Sullivan JM, Bajjalieh SM. Synaptic vesicle protein 2 enhances release probability at quiescent synapses. J Neurosci. 2006;26:1303–1313. doi: 10.1523/JNEUROSCI.2699-05.2006. [DOI] [PMC free article] [PubMed] [Google Scholar]
- de Rooij J, Zwartkruis FJ, Verheijen MH, Cool RH, Nijman SM, Wittinghofer A, Bos JL. Epac is a Rap1 guanine-nucleotide-exchange factor directly activated by cyclic AMP. Nature. 1998;396:474–477. doi: 10.1038/24884. [DOI] [PubMed] [Google Scholar]
- Edmonds B, Gibb AJ, Colquhoun D. Mechanisms of activation of glutamate receptors and the time course of excitatory synaptic currents. Annu Rev Physiol. 1995;57:495–519. doi: 10.1146/annurev.ph.57.030195.002431. [DOI] [PubMed] [Google Scholar]
- Farnsworth CL, Marshall MS, Gibbs JB, Stacey DW, Feig LA. Preferential inhibition of the oncogenic form of RasH by mutations in the GAP binding/“effector” domain. Cell. 1991;64:625–633. doi: 10.1016/0092-8674(91)90246-u. [DOI] [PubMed] [Google Scholar]
- Fischbach SJ, Carew TJ. MicroRNAs in memory processing. Neuron. 2009;63:714–716. doi: 10.1016/j.neuron.2009.09.007. [DOI] [PubMed] [Google Scholar]
- Fujimoto K, Shibasaki T, Yokoi N, Kashima Y, Matsumoto M, Sasaki T, Tajima N, Iwanaga T, Seino S. Piccolo, a Ca2+ sensor in pancreatic beta-cells. Involvement of cAMP-GEFII.Rim2. Piccolo complex in cAMP-dependent exocytosis. J Biol Chem. 2002;277:50497–50502. doi: 10.1074/jbc.M210146200. [DOI] [PubMed] [Google Scholar]
- Geschwind DH, Levitt P. Autism spectrum disorders: developmental disconnection syndromes. Curr Opin Neurobiol. 2007;17:103–111. doi: 10.1016/j.conb.2007.01.009. [DOI] [PubMed] [Google Scholar]
- Hall J, Thomas KL, Everitt BJ. Rapid and selective induction of BDNF expression in the hippocampus during contextual learning. Nat Neurosci. 2000;3:533–535. doi: 10.1038/75698. [DOI] [PubMed] [Google Scholar]
- He L, Hannon CJ. MicroRNAs: small RNAs with a big role in gene regulation. Nat Rev Genet. 2004;5:522–531. doi: 10.1038/nrg1379. [DOI] [PubMed] [Google Scholar]
- Impey S, McCorkle SR, Cha-Molstad H, Dwyer JM, Yochum GS, Boss JM, McWeeney S, Dunn JJ, Mandel G, Goodman RH. Defining the CREB regulon: a genome-wide analysis of transcription factor regulatory regions. Cell. 2004;119:1041–1054. doi: 10.1016/j.cell.2004.10.032. [DOI] [PubMed] [Google Scholar]
- Janz R, Goda Y, Geppert M, Missler M, Sudhof TC. SV2A and SV2B function as redundant Ca2+ regulators in neurotransmitter release. Neuron. 1999;24:1003–1016. doi: 10.1016/s0896-6273(00)81046-6. [DOI] [PubMed] [Google Scholar]
- Jones MW, Errington ML, French PJ, Fine A, Bliss TV, Garel S, Charnay P, Bozon B, Laroche S, Davis S. A requirement for the immediate early gene Zif268 in the expression of late LTP and long-term memories. Nat Neurosci. 2001;4:289–296. doi: 10.1038/85138. [DOI] [PubMed] [Google Scholar]
- Kawasaki H, Springett GM, Mochizuki N, Toki S, Nakaya M, Matsuda M, Housman DE, Graybiel AM. A family of cAMP-binding proteins that directly activate Rap1. Science. 1998;282:2275–2279. doi: 10.1126/science.282.5397.2275. [DOI] [PubMed] [Google Scholar]
- Kelleher RJ, Bear M. The autistic neuron: troubled translation? Cell. 2008;135:401–406. doi: 10.1016/j.cell.2008.10.017. [DOI] [PubMed] [Google Scholar]
- Kelleher RJ, 3rd, Govindarajan A, Jung HY, Kang H, Tonegawa S. Translational control by MAPK signaling in long-term synaptic plasticity and memory. Cell. 2004;116:467–479. doi: 10.1016/s0092-8674(04)00115-1. [DOI] [PubMed] [Google Scholar]
- Kessels HW, Malinow R. Synaptic AMPA receptor plasticity and behavior. Neuron. 2009;61:340–350. doi: 10.1016/j.neuron.2009.01.015. [DOI] [PMC free article] [PubMed] [Google Scholar]
- Kaeser PS, Deng L, Wang Y, Dulubova I, Liu X, Rizo J, Südhof TC. RIM proteins tether Ca2+ channels to presynaptic active zones via a direct PDZ-domain interaction. Cell. 2011;144:282–295. doi: 10.1016/j.cell.2010.12.029. [DOI] [PMC free article] [PubMed] [Google Scholar]
- Krichevsky AM, King KS, Donahue CP, Khrapko K, Kosik KS. A microRNA array reveals extensive regulation of microRNAs during brain development. RNA. 2003;9:1274–1281. doi: 10.1261/rna.5980303. [DOI] [PMC free article] [PubMed] [Google Scholar]
- Levy SE, Mandell DS, Schultz RT. Autism. Lancet. 2009;374:1627–1638. doi: 10.1016/S0140-6736(09)61376-3. [DOI] [PMC free article] [PubMed] [Google Scholar]
- Lim LP, Lau NC, Garrett-Engele P, Grimson A, Schelter JM, Castle J, Bartel DP, Linsley PS, Johnson JM. Microarray analysis shows that some microRNAs downregulate large numbers of target mRNAs. Nature. 2005;433:769–773. doi: 10.1038/nature03315. [DOI] [PubMed] [Google Scholar]
- Liu S, Lau L, Wei J, Zhu D, Zou S, Sun HS, Fu Y, Liu F, Lu Y. Expression of Ca2+-permeable AMPA Receptor Channels Primes Cell Death in Transient Forebrain Ischemia. Neuron. 2004;43:43–55. doi: 10.1016/j.neuron.2004.06.017. [DOI] [PubMed] [Google Scholar]
- Liu C, Takahashi M, Li Y, Dillon TJ, Kaech S, Stork PJ. The interaction of Epac1 and Ran promotes Rap1 activation at the nuclear envelope. Mol Cell Biol. 2010;30:3956–3969. doi: 10.1128/MCB.00242-10. [DOI] [PMC free article] [PubMed] [Google Scholar]
- Malenka RC, Nicoll RA. Long-term potentiation—a decade of progress? Science. 1999;285:1870–1874. doi: 10.1126/science.285.5435.1870. [DOI] [PubMed] [Google Scholar]
- Nicoll RA, Malenka RC. Contrasting properties of two forms of long-term potentiation in the hippocampus. Nature. 1995;377:115–118. doi: 10.1038/377115a0. [DOI] [PubMed] [Google Scholar]
- Ouyang M, Zhang L, Zhu JJ, Schwede F, Thomas SA. Epac signaling is required for hippocampus-dependent memory retrieval. Proc Natl Acad Sci USA. 2008;105:11993–11997. doi: 10.1073/pnas.0804172105. [DOI] [PMC free article] [PubMed] [Google Scholar]
- Peng L, Zhong X, Tu W, Soundarapandian MM, Molner P, Zhu D, Lau L, Liu S, Liu F, Lu Y. ADAR2-Dependent RNA Editing of AMPA Receptor Subunit GluR2 Determines Vulnerability of Neurons in Forebrain Ischemia. Neuron. 2006;49:719–733. doi: 10.1016/j.neuron.2006.01.025. [DOI] [PubMed] [Google Scholar]
- Rajasethupathy P, Fiumara F, Sheridan R, Betel D, Puthanveettil SV, Russo JJ, Sander C, Tuschl T, Kandel E. Characterization of small RNAs in Aplysia reveals a role for miR-124 in constraining synaptic plasticity through CREB. Neuron. 2009;63:803–817. doi: 10.1016/j.neuron.2009.05.029. [DOI] [PMC free article] [PubMed] [Google Scholar]
- Ramocki MB, Zoghbi HY. Failure of neuronal homeostasis results in common neuropsychiatric phenotypes. Nature. 2008;455:912–918. doi: 10.1038/nature07457. [DOI] [PMC free article] [PubMed] [Google Scholar]
- Rehmann H, Prakash B, Wolf E, Rueppel A, de Rooij J, Bos JL, Wittinghofer A. Structure and regulation of the cAMP-binding domains of Epac2. Nat Struct Biol. 2003;10:26–32. doi: 10.1038/nsb878. [DOI] [PubMed] [Google Scholar]
- Renaudineau S, Poucet B, Laroche S, Davis S, Save E. Impaired long-term stability of CA1 place cell representation in mice lacking the transcription factor zif268/egr1. Proc Natl Acad Sci U S A. 2009;106:11771–11775. doi: 10.1073/pnas.0900484106. [DOI] [PMC free article] [PubMed] [Google Scholar]
- Sakaba T, Neher E. Direct modulation of synaptic vesicle priming by GABA(B) receptor activation at a glutamatergic synapse. Nature. 2003;424:775–778. doi: 10.1038/nature01859. [DOI] [PubMed] [Google Scholar]
- Schratt GM, Tuebing F, Nigh EA, Kane CG, Sabatini ME, Kiebler M, Greenberg ME. A brain-specific microRNA regulates dendritic spine development. Nature. 2006;439:283–289. doi: 10.1038/nature04367. [DOI] [PubMed] [Google Scholar]
- Sehrawat S, Cullere X, Patel S, Italiano J, Jr, Mayadas TN. Role of Epac1, an exchange factor for Rap GTPases, in endothelial microtubule dynamics and barrier function. Mol Biol Cell. 2008;19:1261–1270. doi: 10.1091/mbc.E06-10-0972. [DOI] [PMC free article] [PubMed] [Google Scholar]
- Silverman JL, Yang M, Lord C, Crawley JN. Behavioral phenotyping assays for mouse models of autism. Nat Rev Neurosci. 2010;11:490–502. doi: 10.1038/nrn2851. [DOI] [PMC free article] [PubMed] [Google Scholar]
- Soderling TR, Derkaxh VA. Postsynaptic protein phosphorylation and LTP. Trends Neurosci. 2000;23:75–80. doi: 10.1016/s0166-2236(99)01490-3. [DOI] [PubMed] [Google Scholar]
- Schwamborn JC, Puschel AW. The sequential activity of the GTPases Rap1B and Cdc42 determines neuronal polarity. Nat Neurosci. 2004;7:923–929. doi: 10.1038/nn1295. [DOI] [PubMed] [Google Scholar]
- Stark A, Brennecke J, Bushati N, Russell RB, Cohen SM. Animal MicroRNAs confer robustness to gene expression and have a significant impact on 3′UTR evolution. Cell. 2005;123:1133–1146. doi: 10.1016/j.cell.2005.11.023. [DOI] [PubMed] [Google Scholar]
- Stork PJS. Does Rap1 deserve a bad Rap? Trends Biochem Sci. 2003;5:267–275. doi: 10.1016/S0968-0004(03)00087-2. [DOI] [PubMed] [Google Scholar]
- Tu W, Xu X, Peng L, Zhong X, Zhang W, Soundarapandian MM, Balel C, Wang M, Jia N, Zhang W, Lew F, Chan SL, Chen Y, Lu Y. DAPK1 interaction with NMDA receptor NR2B subunits mediates brain damage in stroke. Cell. 2010;140:222–234. doi: 10.1016/j.cell.2009.12.055. [DOI] [PMC free article] [PubMed] [Google Scholar]
- Visvanathan J, Lee S, Lee B, Lee JW, Lee SK. The microRNA miR-124 antagonizes the anti-neural REST/SCP1 pathway during embryonic CNS development. Genes Dev. 2007;21:744–749. doi: 10.1101/gad.1519107. [DOI] [PMC free article] [PubMed] [Google Scholar]
- Walsh CA, Morrow EM, Rubenstein JLR. Autism and Brain Development. Cell. 2008;135:396–400. doi: 10.1016/j.cell.2008.10.015. [DOI] [PMC free article] [PubMed] [Google Scholar]
- Wang J, Liu S, Fu Y, Wang JH, Lu Y. Cdk5 activation induces CA1 pyramidal cell death by direct phosphorylating NMDA receptors. Nat Neurosci. 2003;6:1039–1047. doi: 10.1038/nn1119. [DOI] [PubMed] [Google Scholar]
- West AE, Chen WG, Dalva MB, Dolmetsch RE, Kornhauser JM, Shaywitz AJ, Takasu MA, Tao X, Greenberg ME. Calcium regulation of neuronal gene expression. Proc Natl Acad Sci U S A. 2001;98:11024–11031. doi: 10.1073/pnas.191352298. [DOI] [PMC free article] [PubMed] [Google Scholar]
- Woolfrey KM, Srivastava DP, Photowala H, Yamashita M, Barbolina MV, Cahill ME, Xie Z, Jones KA, Quilliam LA, Prakriya M, Penzes P. Epac2 induces synapse remodeling and depression and its disease-associated forms alter spines. Nat Neurosci. 2009;12:1275–1284. doi: 10.1038/nn.2386. [DOI] [PMC free article] [PubMed] [Google Scholar]
- Zhang CL, Katoh M, Shibasaki T, Minami K, Sunaga Y, Takahashi H, Yokoi N, Iwasaki M, Miki T, Seino S. The cAMP sensor Epac2 is a direct target of antidiabetic sulfonylurea drugs. Science. 2009;325:607–610. doi: 10.1126/science.1172256. [DOI] [PubMed] [Google Scholar]
- Zhong N, Zucker RS. cAMP acts exchange protein activated by cAMP/cAMP-regulated guanine nucleotide exchange protein to regulate transmitter release at the crayfish neuromuscular junction. J Neurosci. 2008;25:208–214. doi: 10.1523/JNEUROSCI.3703-04.2005. [DOI] [PMC free article] [PubMed] [Google Scholar]
- Zhu JJ, Qin Y, Zhao M, Van Aelst L, Malinow R. Ras and Rap control AMPA receptor trafficking during synaptic plasticity. Cell. 2002;110:443–455. doi: 10.1016/s0092-8674(02)00897-8. [DOI] [PubMed] [Google Scholar]
Associated Data
This section collects any data citations, data availability statements, or supplementary materials included in this article.