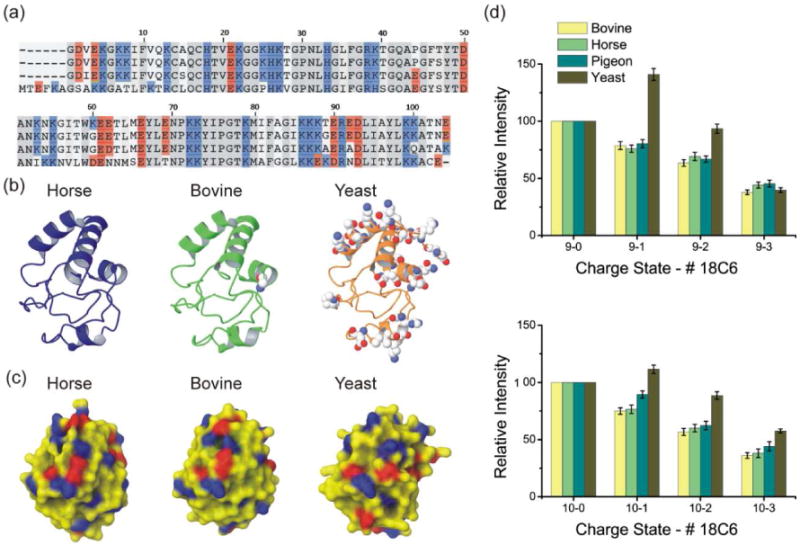
Figure 2.

(a) Sequence alignment for horse, bovine, pigeon, and yeast cytc, respectively, from top to bottom. (b) Backbone structures of bovine, horse, and yeast cytc. Displayed atoms represent basic and acidic sequence variations relative to horse cytc. (c) Surface electrostatic distributions derived from crystal structures. The colors represent charge polarity (positive charge: blue, negative charge: red). (d) SNAPP distributions for four variants of cytc for charge state +9 and +10. Bovine, horse and pigeon cytc share similar results while yeast cytc has a distinct distribution.
