

Abstract
Resting state networks (RSNs) are spontaneous, synchronous, low-frequency oscillations observed in the brains of subjects who are awake but at rest. A particular RSN called the default mode network (DMN) has been shown to exhibit changes associated with neurological disorders such as temporal lobe epilepsy or Alzheimer’s disease. Previous studies have also found that differing experimental conditions such as eyes-open versus eyes-closed can produce measurable changes in the DMN. These condition-associated changes have the potential of confounding the measurements of changes in RSNs related to or caused by disease state(s). In this study, we use fMRI measurements of resting-state connectivity paired with EEG measurements of alpha rhythm and employ independent component analysis, undirected graphs of partial spectral coherence, and spatiotemporal regression to investigate the effect of music-listening on RSNs and the DMN in particular. We observed similar patterns of DMN connectivity in subjects who were listening to music compared with those who were not, with a trend towards a more introspective pattern of resting-state connectivity during music-listening. We conclude that music-listening is a valid condition under which the DMN can be studied.
Keywords: fMRI, EEG, Default Mode Network, Functional Connectivity, Independent Component Analysis
1. Introduction
Resting state networks (RSNs) are described as spontaneous, synchronous, low-frequency “oscillations” (Biswal et al. 1995), “fluctuations” (Lowe et al. 1998), or “patterns of activity” (van de Ven et al. 2004) observed in the brains of subjects who are “resting” (Biswal et al. 1995), “idling” (Gur et al. 1995), “awake but resting” (Raichle et al. 2001), “relaxed” (Laufs et al. 2003), or “task-negative” (Fox et al. 2005). Such oscillations have been observed using a variety of recording modalities including fMRI (Biswal et al. 1995), PET (Raichle et al. 2001), EEG (Laufs, 2008), MEG (Stam et al. 2006), and even direct electrical recordings from the surface of the brain (Miller et al. 2009). The significance of RSNs is a subject of active investigation. Due to their spectral similarity to physiological noise, e.g. cardiac-driven oscillations in cerebral blood flow, RSNs could plausibly be nothing more than artifact (Lowe et al. 1998). However, increasing evidence points to RSNs as a neural phenomenon distinct from physiological processes (Chang and Glover, 2009; De Luca et al. 2006). RSNs are thought to describe functional relationships between brain regions that persist in the “active” state (Cordes et al. 2000; Greicius et al. 2009, 2003).
Alpha rhythm is another oscillatory phenomenon observed when subjects are resting. It is characterized by 8–13 Hz oscillations in EEG signal predominantly in occipital leads of subjects who maintain their eyes closed (Berger, 1929). Studies of brainstem periaqueductal gray (PAG), a part of the reticular activating system (RAS), suggest RAS is necessary for alpha rhythm genesis (Evans, 2003; Routtenberg, 1966). Further, it has been recently shown using fMRI that RAS is a part of the dynamic functional networks collectively called the RSNs (Morgan et al. 2008). This group of neurons is known to be involved in modulating consciousness by controlling the ascending flow of information (Fuentealba and Steriade, 2005; Mesulam, 1995). The modulating effect of PAG is exerted through ascending pathways via thalamus, an organ posited by numerous studies to be the nidus of alpha rhythm via reciprocal connections with cortex (Destexhe et al. 1998; Evans, 2003; Fuentealba and Steriade, 2005; Hughes et al. 2004; Jones, 2002; Schreckenberger et al. 2004). A previous simultaneous EEG/fMRI study examined the BOLD correlates of alpha rhythm during the resting-state (DiFrancesco et al. 2008). The findings of this study agree with similar studies (Goldman et al. 2002; Laufs et al. 2003; Moosmann et al. 2003) and support the view of thalamo-cortico-thalamic loops as alpha rhythm generators. One of the potential criticisms of the study by DiFrancesco et al. is that all subjects enrolled in that study were listening to music while the resting state EEG/fMRI data were collected. Up to date the effects of music listening on the RSN architecture have not been investigated and, thus, it is unclear how music listening affects RSNs (DiFrancesco et al. 2008).
The involvement of cortical structures suggests that alpha rhythm is not a phenomenon that occurs in isolation or independently of other cortical and subcortical activities. Rather, EEG patterns may be closely related to RSNs observed using other modalities (Laufs, 2008). For instance, alpha rhythm amplitude, measured as the average of power spectral density (PSD) in the alpha frequency band, is negatively correlated with attention (Laufs et al. 2006) and positively correlated with relaxation and introspection (Niedermeyer, 1999; Plotkin, 1976), or the “degree” to which a subject is in the resting-state. Furthermore, spontaneous oscillations in alpha rhythm amplitude align with the spontaneous changes in fMRI BOLD signal observed in RSNs (DiFrancesco et al. 2008). It appears, therefore, that it may be beneficial to incorporate analysis of alpha rhythm into studies of RSNs.
A particular RSN termed the “Default Mode Network” (DMN) has been the subject of special interest. The DMN was initially described by Raichle et al. (2001) as a network comprised of posterior cingulate cortex (PCC), precuneus, cuneus, temporo-parietal junction, prefrontal cortex, and anterior cingulate cortex (ACC). More recently, some have argued that hippocampus (Greicius et al. 2004b; Huijbers et al. 2011; Vincent et al. 2006) and frontopolar cortex (Harrison et al. 2008a; Sämann et al. 2011; Scheeringa et al. 2008) should also be included in this network. The DMN’s roles have been postulated to include introspection (Gusnard et al. 2001), memory (Greicius et al. 2004b), and spontaneous cognition (Raichle and Snyder, 2007). These characteristics make the DMN an important system to study as part of the evaluation of brain development and neurological pathologies. Indeed, changes in the DMN have already been observed in temporal lobe epilepsy (Liao et al. 2011), Alzheimer’s disease (Greicius et al. 2004b), autism (Kennedy et al. 2006), and schizophrenia (Bluhm et al. 2007).
The DMN can be readily extracted from fMRI data using independent component analysis (ICA), it is reproducible across subjects and studies, and it is robust (Buckner et al. 2008; Calhoun et al. 2008; Damoiseaux et al. 2006; Morgan et al. 2008; van de Ven et al. 2004), yet it remains sensitive to variations between subjects and groups (Biswal et al. 2010). Such variations can be quantified using spatio-temporal, or dual regression in combination with ICA (Filippini et al. 2009). RSNs including the DMN were also investigated using undirected graphs (Bullmore and Sporns, 2009; Salvador et al. 2005). The DMN can even be observed in subjects who are not “resting”. That is, by performing ICA and then regressing out task related activation, one can obtain spatial maps of RSNs from fMRI data collected during a variety of tasks (Fair et al. 2007). Nevertheless, it is well known that some tasks produce marked deactivation in regions associated with RSNs and, in particular, the DMN (Greicius and Menon, 2004a). These deactivations may represent task-specific changes in the DMN.
For example, it was recently shown that resting-state connectivity within the DMN is higher when subjects are scanned with their eyes open as opposed to closed (Yan et al. 2009) and that transcutaneous electrical nerve stimulation in a subject otherwise at rest results in altered striatal connectivity (Gopinath et al. 2011). Such changes associated with experimental condition do not appear to represent fundamental alterations in the structure of the DMN. Nevertheless, they have the potential of confounding the measurement of changes associated with the experimental condition or disease state.
As mentioned previously, one such potentially confounding experimental condition is music-listening. Music is a phenomenon universal to human cultures that is recognized even by infants (Andrade and Bhattacharya, 2003). Music has many parts, some of which, such as speech and rhythm, are left-lateralized, while others, such as timbre and tone, are right lateralized (Andrade and Bhattacharya, 2003). Music-processing as a whole is thought to have a right-sided bias (Klostermann et al. 2009). Processing of music is distributed across many brain regions including brainstem, thalamus, hippocampus, insula, auditory cortex, limbic system, and multimodal cortical association areas (Andrade and Bhattacharya, 2003; Bamiou et al. 2003; Klostermann et al. 2009; Watanabe et al. 2008). Some of these regions are known to participate in RSNs with hippocampus, cingulate cortex, and multimodal cortex a part of the DMN. It is, therefore, not unreasonable to expect that music has modulating effects on RSNs and that it may affect the DMN.
Allowing subjects to listen to music during resting-state acquisition is potentially advantageous. Music may facilitate relaxation and increase subject comfort and compliance. A previous PET and EEG study found increased activation in posterior precuneus coupled with increased amplitude of beta rhythm with music-listening (Nakamura et al. 1999). An fMRI study using music as part of a mood-induction scheme prior to resting-state acquisition found significant changes in the DMN depending on mood (Harrison et al. 2008b). However the effect of music-listening on RSNs during resting-state fMRI acquisition is unknown. Therefore, the aim of this simultaneous EEG/fMRI study of healthy adults was to examine the influence of listening to music (music group) when compared to listening to background scanner noise (control group; no-music condition) on the RSNs and the DMN in particular. The hypothesis guiding this work was that while we did not expect to observe fundamental changes in the DMN related to listening to music when compared to the no-music condition, we anticipated that music would have moderating effects on RSNs including the thalami and the superior temporal gyri (Heschl’s gyri). To this end, we compared the EEG alpha rhythm amplitude between music and control groups using a heteroscedastic, fixed-effects, linear model. We also used fMRI to compare the resting- state functional connectivity between the groups using ICA and undirected graphs of resting-state connectivity based on partial spectral coherence (PSC).
2. Results
2.1. Imaging
2.1.1. Visual Comparison of Separately Obtained Components
Imaging data were analyzed using three complementary approaches. For the first approach, group independent component analysis (ICA) was applied separately to the music and control groups. This yielded 52 independent components (ICs) for the music group and a distinct 55 ICs for the control group. Two symmetric, multi-regional resting state networks (RSNs) were identified from the 55 control ICs. A visual search of the 52 music ICs identified the two most visually similar RSNs from the music group. Spatial maps of the ICs for these two RSNs are shown in Figure 1.
Figure 1.
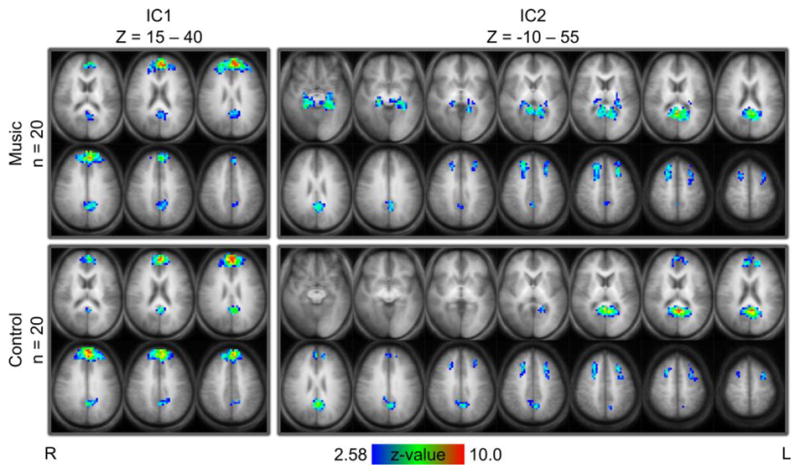
Similar spatial maps for independent components (ICs) in the resting state in the music (top, n=20 subjects) and control (bottom, n=20) groups. Background is the averaged (n=40) anatomical brain. Slices are in radiological orientation (left = right). Left component (IC1): Brodmann area (BA) 9, 10, 23, and 31. Right component (IC2): BA 8, 9, 23, 30, 31, and 32 (both) + 35 and 36 (music) and 10 (control). Clusters of > 50 voxels with z-values > 2.58 are shown. Talairach Z coordinates of first and last slices of each IC are indicated. Slices are 5 mm apart.
On visual inspection, one pair of ICs comprised of Brodmann Areas (BA) 9, 10, 23, and 31 was highly similar between groups. In this study, we call it IC1. The other pair of ICs, IC2, was also similar between groups. IC2 comprised BA 8, 9, 23, 30, 31, and 32 in both groups but included BA 10, medial frontal gyrus (MFG), only in the control group and BA 35 and 36, hippocampus, only in the music group. However, the involvement of hippocampus/precuneus was observed in isolation in ICs from both groups comprising BA 17, 18, 30, and 36 (not shown).
2.1.2. Graphical Analysis of Jointly Obtained Components
For the second approach, group ICA was applied jointly to both groups. This yielded a single set of 53 ICs describing both the music and control groups. Of these ICs, 33 were excluded as noise, 6 were excluded because they described more than one region, and 3 because they described the same region as another IC. This left 11 symmetric, single-region ICs for use as network nodes in graphical analysis. One of these ICs contained three clusters of contiguous voxels, but we included it in our analysis because it was symmetric about the midline and all voxels resided within motor cortex. These 11 ICs constitute the basis for the 11 network nodes shown in Figure 2. They were periaqueductal grey (PAG), thalamus (TH), basal ganglia (BG), insula as BA 13, cuneus as BA 17, 18, and 30, auditory cortex as BA 40, 41, and 42, posterior cingulate cortex (PCC) as BA 23 and 31, anterior cingulate cortex (ACC) as BA 24, 32, 33, and 46, frontopolar cortex as BA 9 and 10, dorsolateral prefrontal cortex (DLPFC) as BA 9 and 46, and motor cortex as BA 4 and 6.
Figure 2.
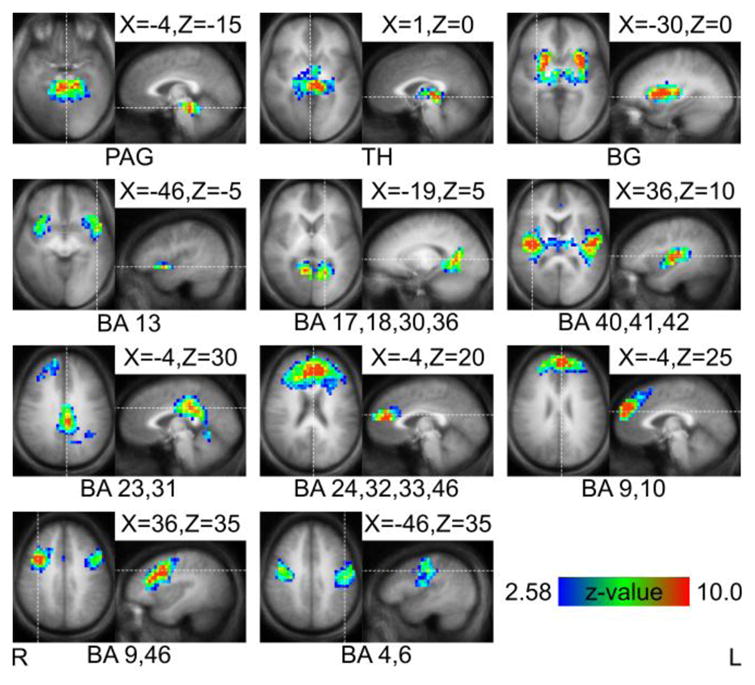
Spatial maps of independent components (ICs) used as nodes and their locations or Brodmann areas (BA). Background is the averaged (n=40) anatomical brain. Slices are in radiological orientation (left = right). Left to right, top to bottom, ICs are: periaqueductal grey (PAG), thalamus (TH), basal ganglia (BG), insula, cuneus, auditory, posterior cingulate (PCC), anterior cingulate (ACC), frontopolar, and motor cortices. Clusters of > 50 voxels with z-values > 2.58 are shown. Talairach coordinates of slices are indicated.
After identifying these 11 network nodes, we assessed the average spectral coherence (SC) between them. SC is a measure of total link strength and the frequency-domain equivalent of correlation coefficient (Brillinger, 1996). The differences in total link strength between the music and control groups were minimal. After correcting for multiple comparisons using false discovery rate (FDR, n = 55), only one SC value was significantly different between groups. This SC value corresponded to the total link strength between PAG and thalamus, which was significantly higher in the music group (0.669) than the control group (0.485) with uncorrected p-value < 0.0001. We had expected the total link strength between thalamus and auditory cortex to be higher in the music group than the control group. While this was the case with SC values of 0.693 and 0.597, respectively, the associated uncorrected p-value = 0.006 did not survive correction for multiple comparisons. At this p-value threshold, the total link strength between thalamus and insula would also have been significantly higher in the music group (0.629) than the control group (0.502) with uncorrected p-value = 0.004.
This analysis was followed by calculating average partial spectral coherence (PSC) which is a measure of direct link strength and the frequency-domain equivalent of partial correlation coefficient (Brillinger, 1996). We constructed two undirected graphs with identical nodes, one graph for each group, by drawing an edge between nodes whose PSC met or exceeded a threshold PSC of 0.3261 determined using methods previously described (Salvador 2005). These graphs are shown in Figure 3. We considered five nodes, cuneus, PCC, ACC, DLPFC, and frontopolar cortex, to be members of the default mode network (DMN). We examined the DMN by considering edges between nodes that belong to the DMN (within-DMN edges) and between nodes that belong to the DMN and those that do not (without-DMN edges). There was one more within-DMN edge in the music group between DLPFC and frontopolar cortex. In total, there were two more without-DMN edges in the control group involving ACC. The total number of edges in the music group was one higher than the total number of edges in the control group.
Figure 3.
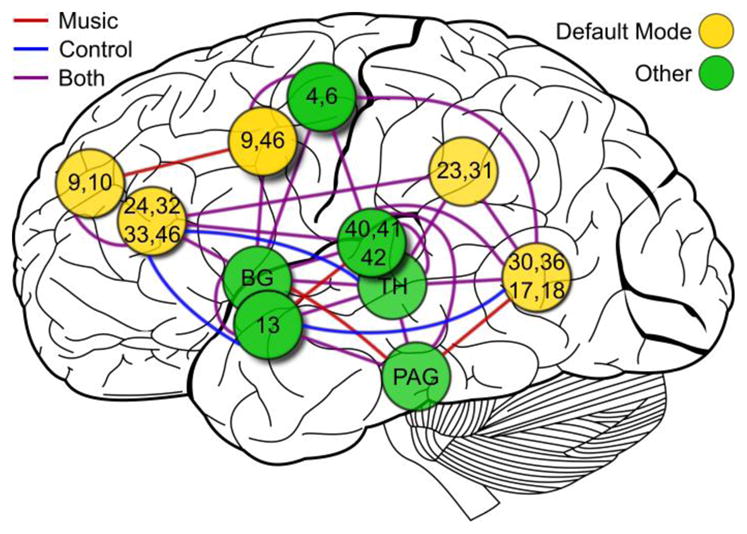
Undirected graph of partial spectral coherences (PSC) between nodes from Figure 2. Midline and bilateral nodes are shown over the left hemispheric surface. Edges are drawn between nodes with PSC > 0.3261 inflection point. Locations or Brodmann areas (BA) of nodes are indicated. PAG = periaqueductal grey, TH = thalamus, BG = basal ganglia. Nodes identified as part of the canonical default mode network (DMN) are colored gold. All other nodes are colored green. Edges colored red are present only in the music group, edges colored blue are present only in the control group, and edges colored purple are present in both groups. [Background image from Wikimedia Commons: Figure 728 from 1918 Gray’s Anatomy vectorized by user Mysid.]
2.1.3. Spatiotemporal Regression of Jointly Obtained Components
In our third approach, we repeated registration and group ICA as in Section 2.1.2. using FMRIB Software Library (FSL; www.fmrib.ox.ac.uk/fsl/), a software suite that provides a spatio-temporal regression (STR) routine. We obtained 52 ICs jointly describing the music and control groups. Of these ICs, the one most characteristic of the DMN is shown in Figure 4A (top). Regions represented in this IC were hippocampus (BA 27, 34, 36, 28, and 35), inferior frontal lobe (BA 47), lingual gyrus (BA 18 and 19), PCC (BA 23, 29, 30, and 31), precuneus (BA 7), DLPFC (BA 8), and biparietal involvement of BA 19, 22, 29, and 39. Significant (α = 0.05) group-level differences in this IC found using STR are shown in Figure 4B (bottom). Overall, there was slightly increased co-activation in right parietal cortex in the music group (BA 19) and left parietal cortex in the control group (BA 19 and 39). We also observed a right-sided cluster of increased co-activation overlapping retrosplenial regions (BA 29) in the control group, however much of this cluster occupied white matter.
Figure 4.
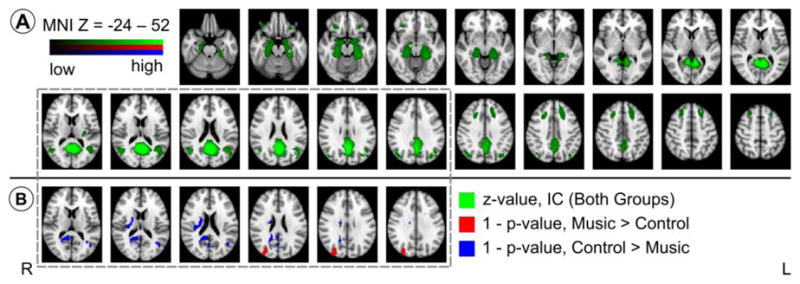
Figure 4A (top two rows): Spatial map of independent component (IC) corresponding to the default mode network (DMN) colored green. Voxels with intensity greater than 20% of the maximum are shown. Background is MNI152 T1 1mm brain. Slices are in radiological orientation (left=right). MNI152 Z coordinates of first and last slices in the IC are indicated. Slices are 4 mm apart.
Figure 4B (bottom one row): Group-level differences for the DMN IC in the corresponding slices of Figure 4A (top) obtained via spatiotemporal regression (STR). Voxels with p-values less than 0.05 (1 - p-value > 0.95) after correction for multiple comparisons are shown. Voxels with greater coactivation in the music group are colored red. Voxels with greater coactivation in the control group are colored blue. There is greater activation in right-sided BA 19 in the music group and in left-sided BA 18 and 19 in the control group (see text for more detail).
2.2. Electroencephalography (EEG)
Data from one subject in each of the music and control groups was discarded due to difficulties in fMRI artifact removal. EEG data were successfully processed for the other 38 subjects. Four bipolar occipital channels, P3-O1, P4-O2, P7-O1, and P8-O2, were used for estimation of average power spectral density (PSD) in 29 subjects. Due to difficulty recording from the O1 or O2 leads (poor electrode impedance), adjacent channels were substituted in nine subjects. Of the 29,028 TR = 3000 epochs recorded, 25,759 (88.7%) survived processing and review for artifact contamination. This yielded 103,036 estimates of average PSD in the alpha band: 50,224 from the music group and 52,812 from the control group (difference < 2.5% at α = 0.05 significance level; this difference is statistically significant but is unlikely to bear any clinical importance). Average power spectral density in the alpha band was found to be significantly higher in the music group than in the control group with p-value < 0.001. Average power spectral density in the beta band was found to be significantly lower in the music group than in the control group with p-value < 0.001.
3. Discussion
Previous studies have found that differing experimental conditions can produce measurable changes in resting state networks (Gopinath et al. 2011; Yan et al. 2009). These condition-associated changes in RSNs have the potential of confounding the measurement of changes related to other factors e.g., disease states. In this study, we investigated the previously not examined effect of music-listening on RSNs and, in particular, on the default mode network (DMN), an RSN readily extracted from resting-state fMRI data using independent component analysis (van de Ven et al. 2004). We observed the DMN to be largely unchanged by music-listening. However, our findings also suggest that resting-state connectivity, including that within the DMN, is more introspective during music-listening.
3.1.1. Visual Comparison of Separately Obtained Components
Perhaps the simplest way to examine the effect of a specific condition on an RSN is to visually compare the spatial map of an independent component (IC) describing the RSN obtained from ICA applied to one experimental group with a corresponding IC obtained from ICA applied to the other experimental group. We identified two ICs of interest, IC1 and IC2, in our control group and matched them to two corresponding ICs in the music group (Figure 1). These ICs describe two RSNs that incorporate regions associated with the DMN. Both ICs were visually similar across groups, but small differences in IC2 merit further discussion.
Although IC2 shows greater hippocampal involvement in the music group, an IC for hippocampus is evident in both groups (not shown). If a difference between groups exists, it is not that hippocampus is absent from the RSN in the control group, but rather that hippocampus is more strongly associated with this RSN in the music group. This interpretation would be consistent with recent findings that hippocampus is associated with the DMN during memory recall but not during memory encoding (Huijbers et al. 2011). Greater association of hippocampus with regions involved in the DMN in the music group could be an indicator of increased memory recall during music-listening, for example, the recall of song lyrics or musical score.
IC2 also shows greater involvement of medial frontal gyrus (MFG) in the RSN of the control group. The precise role of this region within Broadmann area (BA) 10 is not well understood, however activation in this region has been associated with attention to environmental (but not internally generated) stimuli (Burgess et al. 2007; Gilbert et al. 2005). Greater involvement of MFG in the control group could imply greater attentiveness to external stimuli (i.e. scanner noises, physical discomfort, etc.), with lesser involvement of MFG in the music group implying greater introspection, or lack of attention to environmental stimuli, during music-listening. Nevertheless in IC1, where MFG is also involved in an RSN, there is no discernible difference between groups on visual inspection. The finding of different MFG involvement in IC2 is therefore equivocal, with MFG possibly playing different roles in the RSNs described by IC1 and IC2.
While visual comparisons of ICs yield readily accessible results, such an approach has limitations. The content of ICs can vary depending upon the number of ICs reconstructed, and the optimal number of ICs to reconstruct depends, in turn, on the data (Calhoun et al. 2001). Thus, while ICA is a robust technique in that it consistently reveals the DMN, this technique cannot be depended upon to show exactly the same RSNs or exactly the same picture of the DMN in every study or every group of subjects. Furthermore, while intuitive, the visual comparison of ICs is not statistically rigorous.
3.1.2. Graphical Analysis of Jointly Obtained Components
To address these limitations, we supplemented our first approach with two complementary approaches. In both cases we applied group ICA to temporally concatenated data from all subjects in both the music and control groups (Calhoun et al. 2001), thus forcing both groups to share a common set of ICs. We then used graphical analysis and spatio-temporal regression (STR) to make group-level inferences.
In our second approach, graphical analysis builds upon the IC, or node, time course obtained from group ICA (see the 11 nodes in Figure 2) by quantifying the relationships between nodes (see Figure 3) and providing tests for statistical significance. We used spectral coherence (SC) to quantify multi-bivariate, pairwise connectivity between nodes and partial spectral coherence (PSC) to quantify multivariate, conditional connectivity between nodes.
Using PSC, we observed increased connectivity between nodes associated with the DMN (within-DMN connectivity) and decreased connectivity between these DMN nodes and those nodes not associated with the DMN (without-DMN connectivity) in the music group. In other words, DMN activity was more strongly correlated with regions within the DMN and less strongly correlated with regions that represent the external environment. The DMN is thought to serve dual roles of introspection, i.e. monitoring of internal stimuli, and monitoring of the external environment (Buckner et al. 2008). The observed pattern of connectivity suggests that the role of introspection predominates during music-listening. However, due to the small number of nodes used in our analysis, this finding is not statistically significant.
Differing patterns of connectivity were also observed outside of the DMN. Using SC, we observed trends of higher total link strength between thalamus and auditory cortex and between thalamus and insula in the music group accompanied by an edge between insula and auditory cortex present only during music-listening. These findings should not come as surprise since both auditory cortex and insula are involved in the processing of sounds. Insula plays an important role in language processing, whether in verb generation (Karunanayaka et al. 2010), story processing (Karunanayaka et al. 2007), semantic processing (Kim et al. 2011), or auditory processing (Bamiou et al. 2003). We would expect insula to be recruited in the processing of lyrics and perhaps even nonverbal elements of music. Another explanation for this between-group difference could be insula’s connections with limbic and autonomic systems. As insula exerts considerable control over the autonomic nervous system (Critchley et al. 2000; Tokgözoglu et al. 1999), it could plausibly be the mechanistic actor through which music promotes relaxation.
3.1.3. Spatio-temporal Regression of Jointly Obtained Components
In light of the moderating effects of music we observed, we wished to confirm that the DMN remains intact during music-listening as it does for other experimental conditions. For our third approach, we used a technique alternatively called dual regression or spatiotemporal regression (STR) to perform a group-level comparison on a common set of ICs shared by both groups. We identified the DMN IC and obtained the difference maps shown in Figure 4. Overall, the DMN is observed to be largely unchanged by music-listening. The laterality observed in posterior parietal cortex may reflect a right-sided preference for music processing as previously observed (Klostermann et al. 2009).
3.2. Electroencephalography (EEG)
The significantly higher total link strength between periaqueductal grey (PAG) and thalamus, combined with the trend of higher total link strength between thalamus and auditory cortex in the music group, could be explained by enhanced relay of auditory information from inferior colliculus (which lies adjacent to PAG) to auditory cortex via the thalamus during music-listening. However, examination of the network graph in Figure 3 also shows an edge between PAG and basal ganglia, regions not strongly associated with auditory processing, that is present only in the music group. Thus while relay of auditory information may well account for some of the increased connectivity of PAG, it appears PAG is serving other functions as well.
The finding of increased alpha rhythm amplitude in the music group could also help explain the finding of increased PAG connectivity during music-listening. Alpha rhythm is generated by interactions between thalamus and occipital cortex under the influence of the reticular activating system (RAS), which includes PAG (Fuentealba and Steriade 2005). Thus, increased total link strength between PAG and thalamus during music-listening likely reflects the concomitant increase in alpha rhythm in addition to enhanced auditory processing.
Behaviorally, increased alpha rhythm amplitude is associated with increased relaxation and introspection (Niedermeyer, 1999; Plotkin, 1976). Thus, the finding of increased alpha rhythm amplitude in the music group suggests that music-listening enhances these features and agrees with the above explanation of the relationship between insular activation and its connections with the limbic system. This interpretation agrees with our fMRI finding of a more introspective pattern of resting-state connectivity in the music group.
In contrast to a previous EEG/PET study (Nakamura et al. 1999), we observed reduced beta rhythm amplitude in the music group. Beta rhythm is chiefly associated with activation in sensorimotor cortex (Baker, 2007), so its interpretation in the context of music-listening is unclear. A possible explanation for the discrepancy between our finding and that of the previous study is the use of familiar, self-selected music in our study versus traditional Gamelan music, to which a non-audible high-frequency component > 22 kHz was added, in the previous study. The loud noises generated by the 4T MRI scanner in our study could also have been a contributing factor.
3.3. Conclusions
In summary, our study examines the phenomenon of music in the context of its potential to perturb the observation of RSNs. Consequently, we have limited our techniques to those that are commonly used in the examination of RSNs. Due to the narrow scope and the limitations of our study, we do not consider our findings conclusive with respect to the broader phenomena of music and its effects on the brain in general. Furthermore, we recognize that music is a complex phenomenon with many parts, i.e., speech, rhythm, timbre, tone, etc. The results we describe here could be due to any of these components and are not necessarily caused by the phenomenon of music as a whole. We observed a general trend of increased introspection during music-listening accompanied by few specific changes in RSNs and a preserved DMN. We, therefore, conclude that music-listening is a valid experimental condition under which to observe RSNs and, in particular, the DMN. However, we advise caution when interpreting results from auditory cortex, hippocampus, insula, thalamus, or PAG as the connectivity of these regions may be altered by music-listening.
4. Experimental Procedure
4.1. Subjects and Paradigm
Forty healthy adult subjects took part in this study after providing informed consent for a protocol approved by the institutional review board of the University of Cincinnati. The subjects were divided into two groups of 20. Subjects in both groups were instructed to close their eyes and relax during functional image acquisition. The music group (12 men, 8 women, age 29.7 ± 8.8 years) listened to self-selected, comforting music for the duration of the scan; music volume was adjusted to a level comfortable for the subject prior to scanning. This group was included in our previous study of the correlates of the spontaneous alpha rhythm during relaxation (DiFrancesco et al. 2008). The control group (10 men, 10 women, age 30.7 ± 11.0 years) did not listen to music during functional image acquisition. Each subject was scheduled for two consecutive 20 minute functional scans. Five subjects (2 in the music group, 3 in the control group) failed to complete a second scan.
4.2. Imaging
4.2.1. Acquisition
Functional magnetic resonance imaging (fMRI) was performed on a 4 Tesla, 61.5 cm bore Varian Unity INOVA system (Varian, Inc., Palo Alto, CA) equipped with a standard head coil. T2*-weighted, blood oxygen level-dependent (BOLD) sensitive, echo-planar images (EPI) were acquired with an 256 × 256 mm field of view, 64 × 64 voxel matrix, 90° flip angle, and 5 mm slice thickness in axial orientation without gap. 400 volumes consisting of 30 slices each and TR/TA = 3000/2000 ms were collected during each scan.
T1-weighted structural images were acquired for use as an anatomical reference. A modified driven equilibrium Fourier transform (MDEFT) method (Duewell et al. 1996; Uğurbil et al. 1993) was used with an 1100 millisecond inversion delay, 256 mm × 196 mm × 196 mm field of view, 256 × 196 × 196 voxel matrix, 22° flip angle, and TR/TE = 13.1/6.0 milliseconds.
4.2.2. Visual Comparison of Separately Obtained Components
Data were reconstructed and corrected for ghosting, motion corrected using a pyramid iterative co-registration algorithm (Thévenaz et al. 1998), and transformed to stereotaxic space (Talairach and Tournoux, 1988) using Cincinnati Children’s Hospital Imaging Processing Software (CCHIPS) written in Interactive Data Language (IDL, ITT Visual Information Solutions, Boulder, CO). Group independent component analysis (ICA) was performed utilizing the subject-wise concatenation approach (Calhoun et al. 2001). For details of the ICA procedures as implemented in CCHIPS please see our recent publications (Karunanayaka et al. 2007; Schmithorst et al. 2006).
ICA was applied separately to the music and control groups yielding two sets of independent components (ICs), one corresponding to the music group and a second and distinct set corresponding to the control group. Since ICA may produce ICs representing noise (e.g. movement artifact) in addition to biological signals (Hyvärinen and Oja, 2000), an additional step was implemented in order to identify ICs of interest. Often, IC time courses are correlated to the time course of a task to identify task-related ICs (Karunanayaka et al. 2011; Kim et al. 2011; Schmithorst et al. 2006). Since this resting-state study did not incorporate a specific cognitive task, ICs were included or excluded based on visual inspection of the spatial distribution of the ICs using two previously published criteria: 1) ICs residing primarily in white matter, ventricle(s), or outside the brain were excluded on the basis that these regions do not generate blood oxygen level dependent (BOLD) signal (Calhoun et al. 2008; Damoiseaux et al. 2006), and 2) ICs symmetrically distributed over large portions of the brain were excluded on the basis that they do not describe plausible RSNs (Kiviniemi et al. 2003).
After applying the initial exclusion criteria described above, we visually searched the control group for bilaterally symmetric ICs describing two or more non-contiguous regions. Although canonical templates may be used to aid in identification of specific networks (Franco et al. 2009), we elected for a broader selection criteria to avoid rejection of interesting ICs not described by a template. We found two ICs matching our selection criteria in the control group. We then identified two similar ICs in the music group and visually compared them with those in the control group.
4.2.3. Graphical Analysis of Jointly Obtained Components
We compared resting-state connectivity between groups using undirected graphical analysis (Salvador et al. 2005). This technique represents suprathreshold correlations between regions, or “nodes”, as connections, or “edges” in a graph. In an undirected graph, the direction of the causal relationships (i.e. information flow) between nodes is not established (Brillinger, 1996). To obtain nodes we again performed group ICA, but instead of transforming each group separately as above we performed ICA just once on data from subjects in both the music and control groups combined. This yielded a single, shared set of ICs common to both groups. After applying our initial exclusion criteria, we searched for ICs describing either a single cluster of contiguous voxels or else a pair of clusters of contiguous voxels separated by and symmetric about the midline – a single region. Although ICs describing more than one such region are also valid RSNs, graphical analysis is typically limited to nodes comprising single regions (Bullmore and Sporns, 2009) as the interpretation of connectivity between nodes comprised of multiple, possibly overlapping regions is unclear. In cases where two or more ICs described the same region, the IC with the fewest voxels outside (not contiguous with) the region was used. These “extra” overlapping ICs were excluded because they would exhibit high temporal correlation with each other and would therefore introduce problems of collinearity into the graphical analysis (Fiecas et al. 2010). We identified ICs for 11 regions, which we proceeded to use as nodes.
We obtained the spectral coherence (SC), and partial spectral coherence (PSC) (Brillinger, 1996) between each of 55 pairings of the 11 nodes over the 0 - 0.1Hz frequency band (Achard et al. 2006; Biswal et al. 1995; Cordes et al. 2001) using the back-projected IC time courses for these nodes in each subject. SC and PSC are related but distinct measures (Brillinger, 1996). SC describes the relationship between two nodes independent of other nodes, or total link strength, and is thus suitable for pairwise comparisons between nodes. PSC describes the relationship between two nodes conditional upon other nodes, or direct link strength, and is thus suitable for determining edges in a network graph. SC and PSC are analogous to the time-domain measures of correlation and partial correlation, respectively.
We computed SC and PSC according to previously described methods (Fiecas et al. 2010; Salvador et al. 2005). Briefly, the SC between two nodes i and j at frequency λ is given by fi,j(λ) below where Yi(t) is the value of node i at time t:
The PSC between two nodes i and j, fpi,j(λ), was computed from the matrix of SC values,
f(λ), as follows:
We averaged the within-subject SC and PSC values across each group to obtain a total of 110 averaged SC values and 110 averaged PSC values. The PSC values were ranked from lowest (weakest link) to highest (strongest link) and plotted versus PSC rank. The inflection point of this plot was identified and used as the PSC cutoff threshold to select the edges in the undirected connectivity graph. We created two undirected network graphs with identical nodes, one for each group, by drawing an edge between pairs of nodes for which the PSC within the given group was greater than or equal to the PSC threshold (Salvador et al. 2005). These network graphs are shown in Figure 3.
4.2.4. Spatio-temporal Regression of Jointly Obtained Components
Motion correction (Jenkinson et al. 2002) and registration (Andersson et al. 2007a and 2007b; Jenkinson et al. 2002; Jenkinson and Smith, 2001) were repeated using FSL (Smith et al. 2004; Woolrich et al. 2009), a software suite that provides an spatio-temporal regression (STR) routine. We discarded data from nine sessions for which satisfactory motion correction could not be achieved in FSL. Group ICA incorporating all subjects in the study, as described in Section 4.2.3, was repeated using MELODIC (Beckmann and Smith, 2004) to obtain a single, shared set of ICs common to the music and control groups. After applying our initial exclusion criteria, we selected the one IC most visually similar to the canonical default-mode network (Buckner et al. 2008; Raichle et al. 2001). The identity of the DMN IC was objectively confirmed against a stereotactic anatomical template prepared by (Franco et al. 2009) based on the technique described by (van de Ven et al. 2004). We scored each IC according to the difference of the sums of the supratheshold absolute z-values inside and outside of the DMN template and verified that our DMN IC had the highest score. We then applied STR (Filippini et al. 2009), alternatively called dual regression, to obtain a contrast map describing the differences in co-activation in this IC between groups.
4.3. Electroencephalography (EEG)
4.3.1. Acquisition
EEG acquisition was performed as previously described (DiFrancesco et al. 2008; Szaflarski et al. 2010). Subjects were fitted with an MRI-compatible EEG cap with electrodes arranged according to the international 10/20 system, braided carbon cabling, and current-limiting in-line resistors (Compumedics USA, Ltd., El Paso, TX). Electrically conductive gel (Quik-Gel, Compumedics Neuromedia Supplies, Charlotte, NC) was used to establish low impedance (confirmed as < 20 kΩ) between each electrode and the scalp. 64-channels of data, including two mastoid channels, one ECG channel, and one VEOG channel, were recorded at 10 kHz concurrent with fMRI using an MRI compatible system (MagLink by Neuroscan, Division of Compumedics Ltd., El Paso, TX). Time marks generated by the scanner were automatically inserted into the data stream at the onset of each volume acquisition.
4.3.2. Processing
Acquisition and processing were performed with Scan 4.3.5 software (Compumedics USA, Ltd., El Paso, TX). Data were low-pass filtered at 30 Hz and gradient artifacts were removed using an average artifact subtraction technique (Allen et al. 2000) based on the time marks inserted by the scanner. A moving average template of five volumes was used to account for changes in the artifact gradient over time. The fidelity of this technique was improved by optimizing the temporal alignment between the average gradient waveform and the raw data using cross-correlation with a shift limit of 25 samples.
Ballistocardiographic (BCG) artifacts were attenuated using a linear spatial filtering technique previously described (Lagerlund et al. 1997). For each subject, a component of the QRS complex was identified in the ECG channel and used to epoch a majority of heartbeat events in the first functional scan. These epochs were detrended, demeaned, and reviewed by the authors for additional artifact contamination. An average artifact waveform excluding contaminated epochs was obtained. The spatial singular value decomposition (SVD) algorithm in Scan 4.3.5 was used to obtain the principal components of the average waveform. Those components accounting for 99% of signal variance were used to construct a spatial filter in Scan. The filter was applied to EEG data, after gradient artifact removal and decimation to a 1000 Hz sampling rate, to attenuate the BCG artifact.
4.3.3. Analysis
The processed EEG data were divided into 400, TR = 3000 ms epochs starting at the onset of each volume acquisition. These epochs were reviewed by the authors for remaining artifact contamination. Contaminated epochs were excluded from the study. Each surviving epoch was detrended, demeaned, and scaled via division by its standard deviation. To obtain an estimate of power spectral density (PSD), a smoothed periodogram of each epoch was computed for each of four bipolar occipital channels according to previously described methods (Brillinger, 2001; Brockwell and Davis, 2009). Smoothing was achieved using a Gaussian kernel with a bandwidth of two standard deviations resulting in a smoothing window of width equal to that of the 8–13 Hz alpha frequency band. Finally, the average PSD over the alpha band, y, was
computed from the smoothed periodogram p according to the following formula where ω1 is the first of N frequency components in the alpha band (DiFrancesco 2008): This process was repeated for the 13–30 Hz beta frequency band.
Each lth observation on average PSD for the kth channel and the jth subject in the ith group (music v.s. control), yijkl, was fit to a linear model with mean μ, group effect γ, subject effect η, channel effect ν, and subject-channel interaction τ. A heteroscedastic, fixed-effects model was chosen to best account for natural inter-subject variability and for the interaction between subject and channel arising from slight, unavoidable variation in electrode placement. This model was used to test the null hypothesis of no difference in group effect, H0: γ1 = γ2, against its alternative, H0: γ1 ≠ γ2, at a significance
threshold of α = 0.05:
Highlights.
Experimental condition can affect measurement of resting state networks.
We examine the effect of music with EEG/fMRI using ICA and connectivity graphs.
Music-listening increases alpha rhythm amplitude.
Music-listening produces a more introspective pattern of connectivity.
The overall structure of the default mode network is unchanged by music.
Acknowledgments
This study was supported in part by NIH K23 NS052468. Results were presented at the 17th Annual Meeting of the Organization on Human Brain Mapping in Quebec City, CA, 6/2011. The authors thank Steve Sands of Electrode Arrays for his assistance with implementing linear spatial filtering in Scan software.
Footnotes
Publisher's Disclaimer: This is a PDF file of an unedited manuscript that has been accepted for publication. As a service to our customers we are providing this early version of the manuscript. The manuscript will undergo copyediting, typesetting, and review of the resulting proof before it is published in its final citable form. Please note that during the production process errors may be discovered which could affect the content, and all legal disclaimers that apply to the journal pertain.
References
- Achard S, Salvador R, Whitcher B, Suckling J, Bullmore E. A Resilient, Low-Frequency, Small-World Human Brain Functional Network with Highly Connected Association Cortical Hubs. J Neurosci. 2006;26(1):63–72. doi: 10.1523/JNEUROSCI.3874-05.2006. [DOI] [PMC free article] [PubMed] [Google Scholar]
- Allen PJ, Josephs O, Turner R. A method for removing imaging artifact from continuous EEG recorded during functional MRI. Neuroimage. 2000;12(2):230–239. doi: 10.1006/nimg.2000.0599. [DOI] [PubMed] [Google Scholar]
- Andersson JLR, Jenkinson M, Smith S. Non-linear optimisation. FMRIB technical report TR07JA1. 2007 from www.fmrib.ox.ac.uk/analysis/techrep.
- Andersson JLR, Jenkinson M, Smith S. Non-linear registration, aka Spatial normalisation FMRIB technical report TR07JA2. 2007 from www.fmrib.ox.ac.uk/analysis/techrep.
- Andrade PE, Bhattacharya J. Brain tuned to music. J R Soc Med. 2003;96(6):284–287. doi: 10.1258/jrsm.96.6.284. [DOI] [PMC free article] [PubMed] [Google Scholar]
- Baker SN. Oscillatory interactions between sensorimotor cortex and the periphery. Curr Opin Neurobiol. 2007;17(6):649–655. doi: 10.1016/j.conb.2008.01.007. [DOI] [PMC free article] [PubMed] [Google Scholar]
- Bamiou DE, Musiek FE, Luxon LM. The insula (Island of Reil) and its role in auditory processing. Literature review. Brain Res Brain Res Rev. 2003;42(2):143–154. doi: 10.1016/s0165-0173(03)00172-3. [DOI] [PubMed] [Google Scholar]
- Beckmann CF, Smith SM. Probabilistic independent component analysis for functional magnetic resonance imaging. IEEE Trans Med Imaging. 2004;23(2):137–152. doi: 10.1109/TMI.2003.822821. [DOI] [PubMed] [Google Scholar]
- Berger H. Über das Elektrenkephalogramm des Menschen. Eur Arch Psychiatry Clin Neurosci. 1929;87:527–570. [Google Scholar]
- Biswal BB, Mennes M, Zuo XN, Gohel S, Kelly C, Smith SM, Beckmann CF, Adelstein JS, Buckner RL, Colcombe S, Dogonowski AM, Ernst M, Fair D, Hampson M, Hoptman MJ, Hyde JS, Kiviniemi VJ, Kötter R, Li SJ, Lin CP, Lowe MJ, Mackay C, Madden DJ, Madsen KH, Margulies DS, Mayberg HS, McMahon K, Monk CS, Mostofsky SH, Nagel BJ, Pekar JJ, Peltier SJ, Petersen SE, Riedl V, Rombouts SA, Rypma B, Schlaggar BL, Schmidt S, Seidler RD, Siegle GJ, Sorg C, Teng GJ, Veijola J, Villringer A, Walter M, Wang L, Weng XC, Whitfield-Gabrieli S, Williamson P, Windischberger C, Zang YF, Zhang HY, Castellanos FX, Milham MP. Toward discovery science of human brain function. PNAS. 2010;107(10):4734–4739. doi: 10.1073/pnas.0911855107. [DOI] [PMC free article] [PubMed] [Google Scholar]
- Biswal BB, Yetkin FZ, Haughton VM, Hyde JS. Functional connectivity in the motor cortex of resting human brain using echo-planar MRI. Magn Reson Med. 1995;34(4):537–541. doi: 10.1002/mrm.1910340409. [DOI] [PubMed] [Google Scholar]
- Bluhm RL, Miller J, Lanius RA, Osuch EA, Boksman K, Neufeld RW, Théberge J, Schaefer B, Williamson P. Spontaneous low-frequency fluctuations in the BOLD signal in schizophrenic patients: anomalies in the default network. Schizophr Bull. 2007;33(4):1004–1012. doi: 10.1093/schbul/sbm052. [DOI] [PMC free article] [PubMed] [Google Scholar]
- Brockwell PJ, Davis RA. Time series: theory and methods. Springer-Verlag, Inc; New York: 2009. [Google Scholar]
- Brillinger DR. Time series: data analysis and theory. Philadelphia: Society for Industrial and Applied Mathematics; 2001. [Google Scholar]
- Brillinger DR. Remarks concerning graphical models for time series and point processes. Revista de Econometria. 1996;16:1–23. [Google Scholar]
- Buckner RL, Andrews-Hanna JR, Schacter DL. The brain’s default network: anatomy, function, and relevance to disease. Ann N Y Acad Sci. 2008;1124:1–38. doi: 10.1196/annals.1440.011. [DOI] [PubMed] [Google Scholar]
- Bullmore E, Sporns O. Complex brain networks: graph theoretical analysis of structural and functional systems. Nat Rev Neurosci. 2009;10(3):186–198. doi: 10.1038/nrn2575. [DOI] [PubMed] [Google Scholar]
- Burgess PW, Dumontheil I, Gilbert SJ. The gateway hypothesis of rostral prefrontal cortex (area 10) function. Trends Cogn Sci. 2007;11(7):290–298. doi: 10.1016/j.tics.2007.05.004. [DOI] [PubMed] [Google Scholar]
- Calhoun VD, Adali T, Pearlson GD, Pekar JJ. A method for making group inferences from functional MRI data using independent component analysis. Hum Brain Mapp. 2001;14(3):140–151. doi: 10.1002/hbm.1048. [DOI] [PMC free article] [PubMed] [Google Scholar]
- Calhoun VD, Kiehl KA, Pearlson GD. Modulation of temporally coherent brain networks estimated using ICA at rest and during cognitive tasks. Hum Brain Mapp. 2008;29(7):828–838. doi: 10.1002/hbm.20581. [DOI] [PMC free article] [PubMed] [Google Scholar]
- Chang C, Glover GH. Effects of model-based physiological noise correction on default mode network anti-correlations and correlations. Neuroimage. 2009;47(4):1448–1459. doi: 10.1016/j.neuroimage.2009.05.012. [DOI] [PMC free article] [PubMed] [Google Scholar]
- Cordes D, Haughton VM, Arfanakis K, Carew JD, Turski PA, Moritz CH, Quigley MA, Meyerand ME. Frequencies Contributing to Functional Connectivity in the Cerebral Cortex in “Resting-state” Data. AJNR. 2001;22(7):1326–1333. [PMC free article] [PubMed] [Google Scholar]
- Cordes D, Haughton VM, Arfanakis K, Wendt GJ, Turski PA, Moritz CH, Quigley MA, Meyerand ME. Mapping functionally related regions of brain with functional connectivity MR imaging. AJNR Am J Neuroradiol. 2000;21(9):1636–1644. [PMC free article] [PubMed] [Google Scholar]
- Critchley HD, Corfield DR, Chandler MP, Mathias CJ, Dolan RJ. Cerebral correlates of autonomic cardiovascular arousal: a functional neuroimaging investigation in humans. J Physiol. 2000;523 (1):259–270. doi: 10.1111/j.1469-7793.2000.t01-1-00259.x. [DOI] [PMC free article] [PubMed] [Google Scholar]
- Damoiseaux JS, Rombouts SA, Barkhof F, Scheltens P, Stam CJ, Smith SM, Beckmann CF. Consistent resting-state networks across healthy subjects. PNAS. 2006;103(37):13848–13853. doi: 10.1073/pnas.0601417103. [DOI] [PMC free article] [PubMed] [Google Scholar]
- De Luca M, Beckmann CF, De Stefano N, Matthews PM, Smith SM. fMRI resting state networks define distinct modes of long-distance interactions in the human brain. Neuroimage. 2006;29(4):1359–1367. doi: 10.1016/j.neuroimage.2005.08.035. [DOI] [PubMed] [Google Scholar]
- Destexhe A, Contreras D, Steriade M. Mechanisms underlying the synchronizing action of corticothalamic feedback through inhibition of thalamic relay cells. J Neurophysiol. 1998;79(2):999–1016. doi: 10.1152/jn.1998.79.2.999. [DOI] [PubMed] [Google Scholar]
- Difrancesco MW, Holland SJ, Szaflarski JP. Simultaneous EEG/Functional Magnetic Resonance Imaging at 4 Tesla: Correlates of Brain Activity to Spontaneous Alpha Rhythm During Relaxation. J Clin Neurophysiol. 2008;25(5):255–264. doi: 10.1097/WNP.0b013e3181879d56. [DOI] [PMC free article] [PubMed] [Google Scholar]
- Duewell D, Wolff SD, Wen H, Balaban RS, Jezzard P. MR imaging contrast in human brain tissue: assessment and optimization at 4 T. Radiology. 1996;199(3):780–786. doi: 10.1148/radiology.199.3.8638005. [DOI] [PubMed] [Google Scholar]
- Evans BM. Sleep, consciousness and the spontaneous and evoked electrical activity of the brain. Is there a cortical integrating mechanism? Neurophysiol Clin. 2003;33(1):1–10. doi: 10.1016/s0987-7053(03)00002-9. [DOI] [PubMed] [Google Scholar]
- Fair DA, Schlaggar BL, Cohen AL, Miezin FM, Dosenbach NU, Wenger KK, Fox MD, Snyder AZ, Raichle ME, Petersen SE. A method for using blocked and event-related fMRI data to study “resting state” functional connectivity. Neuroimage. 2007;35 (1):396–405. doi: 10.1016/j.neuroimage.2006.11.051. [DOI] [PMC free article] [PubMed] [Google Scholar]
- Fiecas M, Ombao H, Linkletter C, Thompson W, Sanes J. Functional connectivity: shrinkage estimation and randomization test. Neuroimage. 2010;49(4):3005–3014. doi: 10.1016/j.neuroimage.2009.12.022. [DOI] [PMC free article] [PubMed] [Google Scholar]
- Filippini N, MacIntosh BJ, Hough MG, Goodwin GM, Frisoni GB, Smith SM, Matthews PM, Beckmann CF, Mackay CE. Distinct patterns of brain activity in young carriers of the APOE-ε4 allele. Proc Natl Acad Sci U S A. 2009;106 (17):7209–7214. doi: 10.1073/pnas.0811879106. [DOI] [PMC free article] [PubMed] [Google Scholar]
- Fox MD, Snyder AZ, Vincent JL, Corbetta M, Van Essen DC, Raichle ME. The human brain is intrinsically organized into dynamic, anticorrelated functional networks. Proc Natl Acad Sci U S A. 2005;102(27):9673–9678. doi: 10.1073/pnas.0504136102. [DOI] [PMC free article] [PubMed] [Google Scholar]
- Franco AR, Pritchard A, Calhoun VD, Mayer AR. Interrater and intermethod reliability of default mode network selection. Hum Brain Mapp. 2009;30(7):2293–2303. doi: 10.1002/hbm.20668. [DOI] [PMC free article] [PubMed] [Google Scholar]
- Fuentealba P, Steriade M. The reticular nucleus revisited: intrinsic and network properties of a thalamic pacemaker. Prog Neurobiol. 2005;75(2):125–141. doi: 10.1016/j.pneurobio.2005.01.002. [DOI] [PubMed] [Google Scholar]
- Gilbert SJ, Frith CD, Burgess PW. Involvement of rostral prefrontal cortex in selection between stimulus-oriented and stimulus-independent thought. Eur J Neurosci. 2005;21(5):1423–1431. doi: 10.1111/j.1460-9568.2005.03981.x. [DOI] [PubMed] [Google Scholar]
- Goldman RI, Stern JM, Engel J, Jr, Cohen MS. Simultaneous EEG and fMRI of the alpha rhythm. Neuroreport. 2002;13(18):2487–2492. doi: 10.1097/01.wnr.0000047685.08940.d0. [DOI] [PMC free article] [PubMed] [Google Scholar]
- Gopinath K, Ringe W, Goyal A, Carter K, Dinse HR, Haley R, Briggs R. Striatal functional connectivity networks are modulated by fMRI resting state conditions. Neuroimage. 2011;54(1):380–388. doi: 10.1016/j.neuroimage.2010.07.021. [DOI] [PubMed] [Google Scholar]
- Greicius MD, Supekar K, Menon V, Dougherty RF. Resting-state functional connectivity reflects structural connectivity in the default mode network. Cereb Cortex. 2009;19 (1):72–78. doi: 10.1093/cercor/bhn059. [DOI] [PMC free article] [PubMed] [Google Scholar]
- Greicius MD, Menon V. Default-Mode Activity during a Passive Sensory Task: Uncoupled from Deactivation but Impacting Activation. J Cogn Neurosci. 2004;16(9):1484–1492. doi: 10.1162/0898929042568532. [DOI] [PubMed] [Google Scholar]
- Greicius MD, Srivastava G, Reiss AL, Menon V. Default-mode network activity distinguishes Alzheimer’s disease from healthy aging, Evidence from functional MRI. PNAS. 2004;101(13):4637–4642. doi: 10.1073/pnas.0308627101. [DOI] [PMC free article] [PubMed] [Google Scholar]
- Greicius MD, Krasnow B, Reiss AL, Menon V. Functional connectivity in the resting brain: a network analysis of the default mode hypothesis. Proc Natl Acad Sci U S A. 2003;100(1):253–258. doi: 10.1073/pnas.0135058100. [DOI] [PMC free article] [PubMed] [Google Scholar]
- Gur RC, Mozley LH, Mozley PD, Resnick SM, Karp JS, Alavi A, Arnold SE, Gur RE. Sex differences in regional cerebral glucose metabolism during a resting state. Science. 1995;267 (5197):528–531. doi: 10.1126/science.7824953. [DOI] [PubMed] [Google Scholar]
- Gusnard DA, Akbudak E, Shulman GL, Raichle ME. Medial prefrontal cortex and self-referential mental activity: Relation to a default mode of brain function. PNAS. 2001;98(7):4259–4264. doi: 10.1073/pnas.071043098. [DOI] [PMC free article] [PubMed] [Google Scholar]
- Harrison BJ, Pujol J, López-Solà M, Hernández-Ribas R, Deus J, Ortiz H, Soriano-Mas C, Yücel M, Pantelis C, Cardoner N. Consistency and functional specialization in the default mode brain network. PNAS. 2008;105(28):9781–9786. doi: 10.1073/pnas.0711791105. [DOI] [PMC free article] [PubMed] [Google Scholar]
- Harrison BJ, Pujol J, Ortiz H, Fornito A, Pantelis C, Yücel M. Modulation of Brain Resting-State Networks by Sad Mood Induction. PLoS One. 2008;3(3):e1794. doi: 10.1371/journal.pone.0001794. [DOI] [PMC free article] [PubMed] [Google Scholar]
- Hughes SW, Lörincz M, Cope DW, Blethyn KL, Kékesi KA, Parri HR, Juhász G, Crunelli V. Synchronized oscillations at alpha and theta frequencies in the lateral geniculate nucleus. Neuron. 2004;42(2):253–268. doi: 10.1016/s0896-6273(04)00191-6. [DOI] [PubMed] [Google Scholar]
- Huijbers W, Pennartz CM, Cabeza R, Daselaar SM. The Hippocampus Is Coupled with the Default Network during Memory Retrieval but Not during Memory Encoding. PLoS One. 2011;6(4):e17463. doi: 10.1371/journal.pone.0017463. [DOI] [PMC free article] [PubMed] [Google Scholar]
- Hyvärinen A, Oja E. Independent component analysis: algorithms and applications. Neural Netw. 2000;13(4–5):411–430. doi: 10.1016/s0893-6080(00)00026-5. [DOI] [PubMed] [Google Scholar]
- Jenkinson M, Bannister PR, Brady JM, Smith SM. Improved optimisation for the robust and accurate linear registration and motion correction of brain images. Neuroimage. 2002;17(2):825–841. doi: 10.1016/s1053-8119(02)91132-8. [DOI] [PubMed] [Google Scholar]
- Jenkinson M, Smith SM. A global optimisation method for robust affine registration of brain images. Med Image Anal. 2001;5(2):143–156. doi: 10.1016/s1361-8415(01)00036-6. [DOI] [PubMed] [Google Scholar]
- Jones EG. Thalamic circuitry and thalamocortical synchrony. Philos Trans R Soc Lond B Biol Sci. 2002;357(1428):1659–1673. doi: 10.1098/rstb.2002.1168. [DOI] [PMC free article] [PubMed] [Google Scholar]
- Karunanayaka PR, Kim KK, Holland SK, Szaflarski JP. The effects of left or right hemispheric epilepsy on language networks investigated with semantic decision fMRI task and independent component analysis. Epilepsy Behav. 2011;20(4):623–632. doi: 10.1016/j.yebeh.2010.12.029. [DOI] [PMC free article] [PubMed] [Google Scholar]
- Karunanayaka PR, Schmithorst VJ, Vannest J, Szaflarski JP, Plante E, Holland SK. A group independent component analysis of covert verb generation in children: a functional magnetic resonance imaging study. Neuroimage. 2010;51(1):472–487. doi: 10.1016/j.neuroimage.2009.12.108. [DOI] [PMC free article] [PubMed] [Google Scholar]
- Karunanayaka PR, Holland SJ, Schmithorst VJ, Solodkin A, Chen EE, Szaflarski JP, Plante E. Age-related connectivity changes in fMRI data from children listening to stories. Neuroimage. 2007;34(1):349–360. doi: 10.1016/j.neuroimage.2006.08.028. [DOI] [PubMed] [Google Scholar]
- Kennedy DP, Redcay E, Courchesne E. Failing to deactivate: Resting functional abnormalities in autism. PNAS. 2006;103(21):8275–8280. doi: 10.1073/pnas.0600674103. [DOI] [PMC free article] [PubMed] [Google Scholar]
- Kim KK, Karunanayaka PR, Privitera MD, Holland SK, Szaflarski JP. Semantic association investigated with functional MRI and independent component analysis. Epilepsy Behav. 2011;20 (4):613–622. doi: 10.1016/j.yebeh.2010.11.010. [DOI] [PMC free article] [PubMed] [Google Scholar]
- Kiviniemi V, Kantola JH, Jauhiainen J, Hyvärinen A, Tervonen O. Independent component analysis of nondeterministic fMRI signal sources. Neuroimage. 2003;19(2):253–260. doi: 10.1016/s1053-8119(03)00097-1. [DOI] [PubMed] [Google Scholar]
- Klostermann EC, Loui P, Shimamura AP. Activation of right parietal cortex during memory retrieval of nonlinguistic auditory stimuli. Cogn Affect Behav Neurosci. 2009;9(3):242–248. doi: 10.3758/CABN.9.3.242. [DOI] [PubMed] [Google Scholar]
- Lagerlund TD, Sharbrough FW, Busacker NE. Spatial filtering of multichannel electroencephalographic recordings through principal component analysis by singular value decomposition. J Clin Neurophysiol. 1997;14(1):73–82. doi: 10.1097/00004691-199701000-00007. [DOI] [PubMed] [Google Scholar]
- Laufs H, Kleinschmidt A, Beyerle A, Eger E, Salek-Haddadi A, Preibisch C, Krakow K. EEG-correlated fMRI of human alpha activity. Neuroimage. 2003;19(4):1463–1476. doi: 10.1016/s1053-8119(03)00286-6. [DOI] [PubMed] [Google Scholar]
- Laufs H. Endogenous brain oscillations and related networks detected by surface EEG-combined fMRI. Hum Brain Mapp. 2008;29(7):762–769. doi: 10.1002/hbm.20600. [DOI] [PMC free article] [PubMed] [Google Scholar]
- Laufs H, Holt JL, Elfont R, Krams M, Paul JS, Krakow K, Kleinschmidt A. Where the BOLD signal goes when alpha EEG leaves. Neuroimage. 2006;31(4):1401–1418. doi: 10.1016/j.neuroimage.2006.02.002. [DOI] [PubMed] [Google Scholar]
- Liao W, Zhang Z, Pan Z, Mantini D, Ding J, Duan X, Luo C, Wang Z, Tan Q, Lu G, Chen H. Default mode network abnormalities in mesial temporal lobe epilepsy: A study combining fMRI and DTI. Hum Brain Mapp. 2011;32(6):883–895. doi: 10.1002/hbm.21076. [DOI] [PMC free article] [PubMed] [Google Scholar]
- Lowe MJ, Mock BJ, Sorenson JA. Functional connectivity in single and multislice echoplanar imaging using resting-state fluctuations. Neuroimage. 1998;7(2):119–132. doi: 10.1006/nimg.1997.0315. [DOI] [PubMed] [Google Scholar]
- Mesulam MM. Cholinergic pathways and the ascending reticular activating system of the human brain. Ann N Y Acad Sci. 1995;757:169–179. doi: 10.1111/j.1749-6632.1995.tb17472.x. [DOI] [PubMed] [Google Scholar]
- Miller KJ, Weaver KE, Ojemann JG. Direct electrophysiological measurement of human default network areas. Proc Natl Acad Sci U S A. 2009;106(29):12174–12177. doi: 10.1073/pnas.0902071106. [DOI] [PMC free article] [PubMed] [Google Scholar]
- Moosmann M, Ritter P, Krastel I, Brink A, Thees S, Blankenburg F, Taskin B, Obrig H, Villringer A. Correlates of alpha rhythm in functional magnetic resonance imaging and near infrared spectroscopy. Neuroimage. 2003;20(1):145–158. doi: 10.1016/s1053-8119(03)00344-6. [DOI] [PubMed] [Google Scholar]
- Morgan VL, Gore JC, Szaflarski JP. Temporal clustering analysis: What does it tell us about the resting state of the brain? Med Sci Monit. 2008;14(7):345–352. [PMC free article] [PubMed] [Google Scholar]
- Nakamura S, Sadato N, Oohashi T, Nishina E, Fuwamoto Y, Yonekura Y. Analysis of music-brain interaction with simultaneous measurement of regional cerebral blood flow and electroencephalogram beta rhythm in human subjects. Neurosci Lett. 1999;275(3):222–226. doi: 10.1016/s0304-3940(99)00766-1. [DOI] [PubMed] [Google Scholar]
- Niedermeyer E. The Normal EEG of the Waking Adult. Electroencephalography: Basic Principles, Clinical Applications and Related Fields. 1999;20(4):149–173. [Google Scholar]
- Plotkin WB. On the self-regulation of the occipital alpha rhythm: control strategies, states of consciousness, and the role of physiological feedback. J Exp Psychol Gen. 1976;105(1):66–99. doi: 10.1037//0096-3445.105.1.66. [DOI] [PubMed] [Google Scholar]
- Raichle ME, Snyder AZ. A default mode of brain function: A brief history of an evolving idea. Neuroimage. 2007;37 (4):1083–1090. doi: 10.1016/j.neuroimage.2007.02.041. [DOI] [PubMed] [Google Scholar]
- Raichle ME, MacLeod AM, Snyder AZ, Powers WJ, Gusnard DA, Shulman GL. A default mode of brain function. Proc Natl Acad Sci U S A. 2001;98(2):676–682. doi: 10.1073/pnas.98.2.676. [DOI] [PMC free article] [PubMed] [Google Scholar]
- Routtenberg A. Neural mechanisms of sleep: changing view of reticular formation function. Psychol Rev. 1966;73(6):481–499. doi: 10.1037/h0023889. [DOI] [PubMed] [Google Scholar]
- Salvador R, Suckling J, Schwarzbauer C, Bullmore E. Undirected graphs of frequency-dependent functional connectivity in whole brain networks. Philos Trans R Soc Lond B Biol Sci. 2005;360(1457):937–946. doi: 10.1098/rstb.2005.1645. [DOI] [PMC free article] [PubMed] [Google Scholar]
- Sämann PG, Wehrle R, Hoehn D, Spoormaker VI, Peters H, Tully C, Holsboer F, Czisch M. Development of the Brain’s Default Mode Network from Wakefulness to Slow Wave Sleep. Cereb Cortex. 2011 doi: 10.1093/cercor/bhq295. epub. [DOI] [PubMed] [Google Scholar]
- Scheeringa R, Bastiaansen MC, Petersson KM, Oostenveld R, Norris DG, Hagoort P. Frontal theta EEG activity correlates negatively with the default mode network in resting state. Int J Psychophysiol. 2008;67(3):242–251. doi: 10.1016/j.ijpsycho.2007.05.017. [DOI] [PubMed] [Google Scholar]
- Schmithorst VJ, Holland SK, Plante E. Cognitive modules utilized for narrative comprehension in children: a functional magnetic resonance imaging study. Neuroimage. 2006;29(1):254–266. doi: 10.1016/j.neuroimage.2005.07.020. [DOI] [PMC free article] [PubMed] [Google Scholar]
- Schreckenberger M, Lange-Asschenfeldt C, Lochmann M, Mann K, Siessmeier T, Buchholz HG, Bartenstein P, Gründer G. The thalamus as the generator and modulator of EEG alpha rhythm: a combined PET/EEG study with lorazepam challenge in humans. Neuroimage. 2004;22(2):637–644. doi: 10.1016/j.neuroimage.2004.01.047. [DOI] [PubMed] [Google Scholar]
- Smith SM, Jenkinson M, Woolrich MW, Beckmann CF, Behrens TEJ, Johansen-Berg H, Bannister PR, De Luca M, Drobnjak I, Flitney DE, Niazy R, Saunders J, Vickers J, Zhang J, De Stefano N, Brady JM, Matthews PM. Advances in functional and structural MR image analysis and implementation as FSL. Neuroimage. 2004;23(S1):208–219. doi: 10.1016/j.neuroimage.2004.07.051. [DOI] [PubMed] [Google Scholar]
- Stam CJ, Jones BF, Manshanden I, van Cappellen van Walsum AM, Montez T, Verbunt JP, de Munck JC, van Dijk BW, Berendse HW, Scheltens P. Magnetoencephalographic evaluation of resting-state functional connectivity in Alzheimer’s disease. Neuroimage. 2006;32(3):1335–1344. doi: 10.1016/j.neuroimage.2006.05.033. [DOI] [PubMed] [Google Scholar]
- Szaflarski JP, DiFrancesco MW, Hirschauer T, Banks C, Privitera MD, Gotman J, Holland SK. Cortical and subcortical contributions to absence seizure onset examined with EEG/fMRI. Epilepsy Behav. 2010;18(4):404–413. doi: 10.1016/j.yebeh.2010.05.009. [DOI] [PMC free article] [PubMed] [Google Scholar]
- Talairach J, Tournoux P. Co-planar stereotaxic atlas of the human brain. Thieme; New York: 1988. [Google Scholar]
- Thévenaz P, Ruttimann UE, Unser M. A Pyramid Approach to Subpixel Registration Based on Intensity. IEEE Trans Image Process. 1998;7 (1):27–41. doi: 10.1109/83.650848. [DOI] [PubMed] [Google Scholar]
- Tokgözoglu SL, Batur MK, Top uoglu MA, Saribas O, Kes S, Oto A. Effects of stroke localization on cardiac autonomic balance and sudden death. Stroke. 1999;30 (7):1307–1311. doi: 10.1161/01.str.30.7.1307. [DOI] [PubMed] [Google Scholar]
- Uğurbil K, Garwood M, Ellermann M, Hendrich K, Hinke R, Hu X, Kim SG, Menon R, Merkle H, Ogawa S. Imaging at high magnetic fields: initial experiences at 4 T. Magn Reson Q. 1993;9(4):259–277. [PubMed] [Google Scholar]
- van de Ven VG, Formisano E, Prvulovic D, Roeder CH, Linden DE. Functional connectivity as revealed by spatial independent component analysis of fMRI measurements during rest. Hum Brain Mapp. 2004;22(3):165–178. doi: 10.1002/hbm.20022. [DOI] [PMC free article] [PubMed] [Google Scholar]
- Vincent JL, Snyder AZ, Fox MD, Shannon BJ, Andrews JR, Raichle ME, Buckner RL. Coherent Spontaneous Activity Identifies a Hippocampal-Parietal Memory Network. J Neurophysiol. 2006;96(6):3517–3531. doi: 10.1152/jn.00048.2006. [DOI] [PubMed] [Google Scholar]
- Watanabe T, Yagishita S, Kikyo H. Memory of music: roles of right hippocampus and left inferior frontal gyrus. Neuroimage. 2008;39(1):483–491. doi: 10.1016/j.neuroimage.2007.08.024. [DOI] [PubMed] [Google Scholar]
- Woolrich MW, Jbabdi S, Patenaude B, Chappell M, Makni S, Behrens T, Beckmann C, Jenkinson M, Smith SM. Bayesian analysis of neuroimaging data in FSL. Neuroimage. 2009;45(S1):S173–186. doi: 10.1016/j.neuroimage.2008.10.055. [DOI] [PubMed] [Google Scholar]
- Yan C, Liu D, He Y, Zou Q, Zhu C, Zuo X, Long X, Zang Y. Spontaneous Brain Activity in the Default Mode Network Is Sensitive to Different Resting-State Conditions with Limited Cognitive Load. PLoS One. 2009;4(5):e5743. doi: 10.1371/journal.pone.0005743. [DOI] [PMC free article] [PubMed] [Google Scholar]