Abstract
Nutritional excess and hyperlipidemia increase the heart’s susceptibility to ischemic injury. Mammalian target of rapamycin (mTOR) controls the cellular response to nutritional status and may play a role in ischemic injury. To explore the effect of hypercholesterolemia on cardiac mTOR signaling, we assessed mTOR signaling in hypercholesterolemic swine (HC) that are also susceptible to increased cardiac ischemia-reperfusion injury. Yucatan pigs were fed a high-fat/high-cholesterol diet for 4 weeks to induce hypercholesterolemia, and mTOR signaling was measured by immunoblotting and immunofluorescence in the non-ischemic left ventricular area. Total myocardial mTOR and raptor levels were markedly increased in the HC group compared to the normocholesterolemic group, and directly correlated with serum cholesterol levels. mTOR exhibited intense perinuclear staining in myocytes only in the HC group. Hypercholesterolemia was associated with hyperactive signaling upstream and downstream of both mTOR complexes, including myocardial Akt, S6K1, 4EBP1, S6 and PKC-alpha, increased levels of cardiac hypertrophy markers, and a trend toward lower levels of myocardial autophagy. Hypercholesterolemia can now be added to the growing list of conditions associated with aberrant mTOR signaling. Hypercholesterolemia produces a unique profile of alterations in cardiac mTOR signaling, which is a potential target in cardiac diseases associated with hypercholesterolemia and nutritional excess.
Keywords: hyperlipidemia, nutrition, rapamycin, hypertrophy, ischemia, oxidative stress, autophagy, senescence, mitochondria, localization
Introduction
Hyperlipidemia is one of the most common risk factors for coronary heart disease, and is associated with increased morbidity and mortality from cardiac events and procedures.1,2 Major studies have shown that diet, particularly those high in saturated fat, also plays a fundamental role in cardiovascular risk.3 We recently showed a 45% greater myocardial infarct after ischemia-reperfusion (I/R) in hypercholesterolemic pigs fed a high-fat/high-cholesterol diet for four weeks,4 which is much shorter than the time needed to produce atherosclerosis.5 Fortunately, mortality from cardiovascular disease has declined drastically in the last 50 years due to decreases in serum cholesterol and the modification of other risk factors. Experts believe, however, that this trend has slowed due to unhealthy eating patterns in the majority of the US population, specifically with respect to the overconsumption of energy-rich foods.6
Mammalian target of rapamycin (mTOR) plays a central role in integrating the cell’s response to nutritional status, including intracellular ATP, glucose and amino acid levels.7 Hyperactivation of mTOR has been shown to increase most organs’ sensitivity to oxidative stress.8 The etiology of many diseases associated with aging has been attributed to increased oxidative stress and more recently, to hyperactivation of mTOR through multiple mechanisms including nutrient excess.9 mTOR exists in mTOR complex 1 (mTORC1) with raptor and mTOR complex 2 (mTORC2) with rictor. mTORC1 is activated by Akt and inhibited by AMPK, and promotes protein synthesis and leads to cardiac hypertrophy through its activation of S6K1 and S6, and inhibition of 4EBP1 and autophagy. mTORC2 activates Akt and PKCα, and may also contribute to cardiac hypertrophy.10 While some studies have shown that prior activation of Akt or S6K1 are important for cell survival after I/R,11,12 others have suggested that rapamycin induces a metabolic state that protects cardiomyocytes from I/R injury.10,13,14
The effect of hypercholesterolemia on mTOR signaling has not been studied. We examined mTORC1 and 2 signaling in pigs fed a high cholesterol diet for 4 weeks, in order to study the effect of hypercholesterolemia on myocardial signaling independent of secondary effects related to atherosclerosis and underlying ischemia. Since hypercholesterolemia is likely produced through the complex interplay of dietary and genetic factors, a large animal model was used that may be more applicable to patients than traditional rodent models.15 Here we describe that hyperactive myocardial mTOR signaling is present in early hypercholesterolemia, and implicate mTOR complex 1 and 2 signaling in altering myocardial metabolism and susceptibility to ischemic injury.
Results
Biochemical parameters and body weight
The high-fat/high-cholesterol diet induced significant elevations in serum total cholesterol, LDL and HDL in the HC group (p < 0.01 for all; Table 1). Triglycerides tended to be slightly higher in the HC group (p = 0.051), and body weight was similar between groups. Some pigs in the HC group displayed elevations in serum glucose and insulin levels, but the differences were not significant, and HOMA-IR, a measure of insulin resistance,16 tended to be higher in the HC group (data not shown).
Table 1.
Lipid profile and body weight
| NC | HC | p | |
|---|---|---|---|
| Chol (mmol/L) | 1.61 ± 0.27 | 13.8 ± 1.8 | <0.01 |
| LDL (mmol/L) | 0.53 ± 0.05 | 5.46 ± 0.74 | <0.01 |
| HDL (mmol/L) | 0.53 ± 0.06 | 1.81 ± 0.11 | <0.01 |
| TG (mmol/L) | 0.30 ± 0.14 | 0.33 ± 0.03 | 0.051 |
| Body Weight (kg) | 22.4 ± 1.5 | 21.4 ± 0.9 | 0.54 |
Yucatan pigs were fed a normocholesterolemic (NC, n=6) or a high-fat/high-cholesterol diet (HC, n=7) for 4 weeks. Serum total cholesterol (Chol), low-density lipoprotein (LDL), high-density lipoprotein (HDL), triglycerides (TG) and body weight were measured. Values are expressed as mean ± SEM, with corresponding p values.
mTORC1 and 2 components
mTOR levels were increased by about 3-fold in the HC group (p < 0.01), and raptor levels were increased by more than 5-fold in the HC group (p < 0.01). In contrast, levels of rictor and mLST8 were not significantly different between groups (p = 0.4 and p = 0.8, respectively; Fig. 1). mTOR and raptor levels exhibited strong direct correlations with serum total cholesterol and HDL levels (Table 2; for correlation plots see Suppl. Fig. 1). mTOR and raptor levels exhibited modest and strong direct correlations with serum LDL, respectively. There was no correlation between mTOR and raptor levels and triglycerides or body weight. mTOR levels also showed a modest correlation with insulin levels and HOMA-IR measurements, while raptor levels showed no correlation with any measures of insulin resistance (data not shown).
Figure 1.
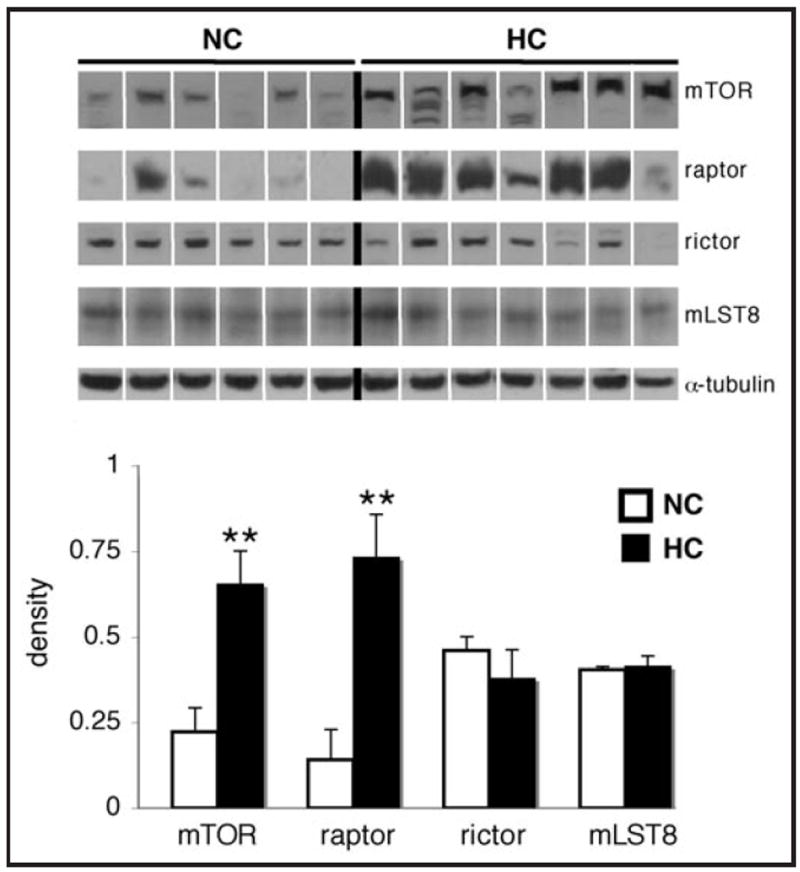
Hypercholesterolemia is associated with significantly higher levels of cardiac mTOR and raptor. Representative western blots for mTOR, raptor, rictor, mLST8 and α-tubulin in the left ventricle of hypercholester-olemic (HC) and normocholesterolemic (NC) pigs, and quantification of the data. Bands were rearranged from the original gel for clarity of presentation. Densities were calculated relative to total Ponceau S staining. Data are expressed as mean ± SEM. **p < 0.01 versus control.
Table 2.
Corrleation of lipid profile and body weight with cardiac mTOR and raptor levels
| mTOR | raptor | |||
|---|---|---|---|---|
| r | p | r | p | |
| Chol | 0.57 | <0.05 | 0.81 | <0.001 |
| LDL | 0.53 | 0.06 | 0.77 | <0.01 |
| HDL | 0.72 | <0.01 | 0.81 | <0.001 |
| TG | 0.24 | 0.41 | 0.33 | 0.27 |
| Body Weight | 0.08 | 0.79 | 0.05 | 0.86 |
Yucatan pigs were fed a normal or high-fat/high-cholesterol diet for 4 weeks. Left ventricular mTOR and raptor levels were measured by immunoblotting. Serum total cholesterol (Chol), low-density lipo-protein (LDL), high-density lipoprotein (HDL), triglycerides (TG) and body weight were also measured. Correlation (r) with corresponding p values are shown. For correlation plots, see Supplemental Figure 1.
Signaling upstream of mTORC1
The phosphorylation of Akt at Thr308, as measured by the ratio of phospho-to-total levels of the protein, tended to be higher in HC group (p = 0.052; Fig. 2). PRAS40 phosphorylation at Thr246 and mTOR phosphorylation at Ser2448 were higher in the HC group (p < 0.05 and p < 0.01, respectively). Total levels of Akt did not change (p = 0.6), while total levels of PRAS40 tended to be slightly lower in the HC group (p = 0.14). AMPKα phosphorylation at Thr172 was significantly lower in the HC group (p < 0.01; Fig. 3), while levels of total AMPKα were slightly higher in the HC group (p = 0.19). Levels of Rheb were lower in the HC group (p < 0.05), while there was no difference in REDD1 levels between the groups (p = 0.3).
Figure 2.
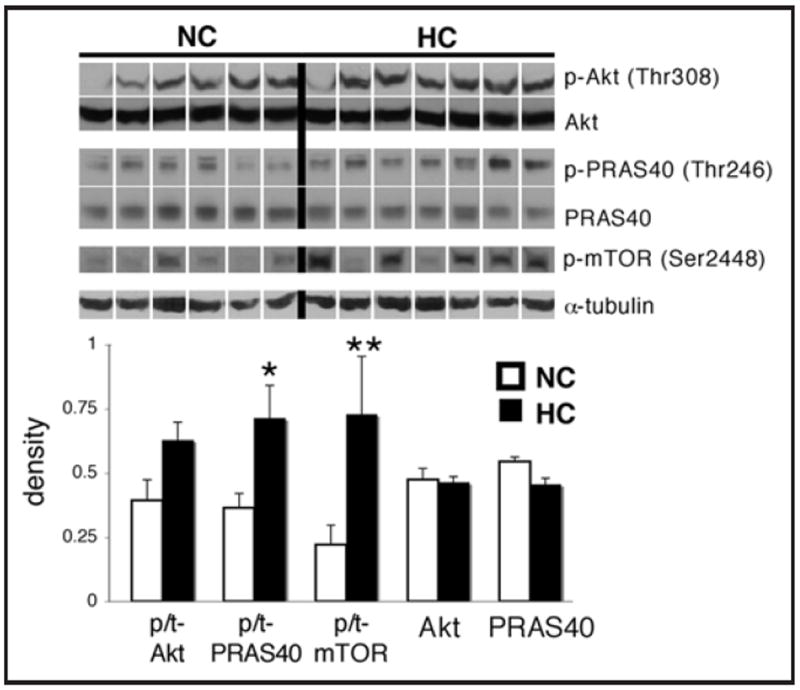
Hypercholesterolemia is associated with increased in cardiac Akt/mTOR signaling. Representative western blots for phospho-Akt (Thr308), phospho-PRAS40 (Thr246), phospho-mTOR (Ser2448), and total levels of Akt, PRAS40 and α-tubulin in the left ventricle of hypercholesterolemic (HC) and nomocholesterolemic (NC) pigs, and quantification of the data. The phospho-mTOR blot corresponds to the total mTOR blot shown in Figure 1. Bands were rearranged from the original gel for clarity of presentation. Densities were calculated relative to total Ponceau S staining. Phosphorylation is presented as the phospho-to-total (p/t) ratio of the protein. Data are expressed as mean ± SEM. *p < 0.05, **p < 0.01 versus control.
Figure 3.
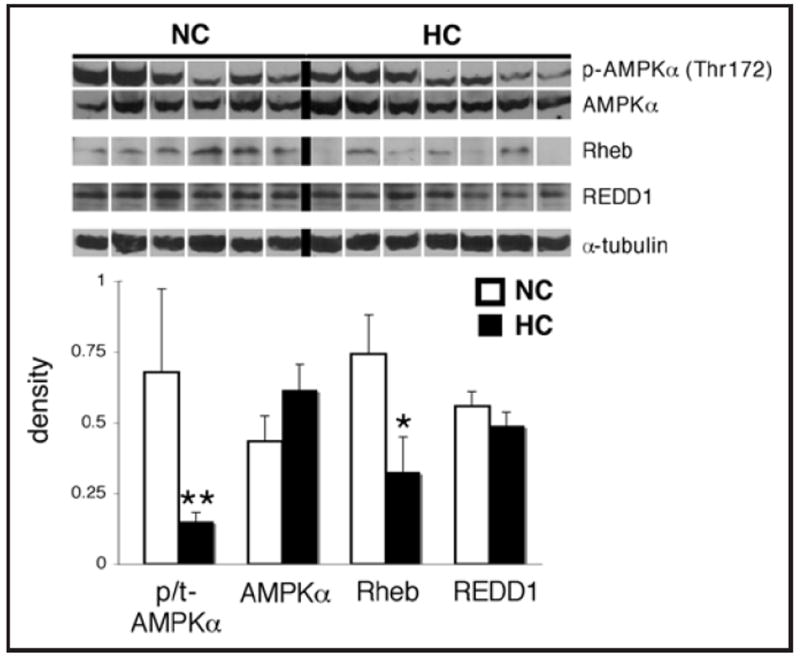
Effect of hypercholesterolemia on upstream modulators of mTORC1 in the myocardium. Representative western blots for phospho-AMPKα (Thr172), AMPKα, Rheb, REDD1 and α-tubulin in the left ventricle of hypercholesterolemic (HC) and normocholesterolemic (NC) pigs, and quantification of the data. Bands were rearranged from the original gel for clarity of presentation. Densities were calculated relative to total Ponceau S staining. Phosphorylation is presented as the phospho-to-total (p/t) ratio of the protein. Data are expressed as mean ± SEM. *p < 0.05, **p <0.01 versus control.
mTORC1 activity
The phosphorylation of 4EBP1 at Thr37/46 and S6K1 at Thr389 was increased by more than 2-fold in the HC group (p < 0.01 and p < 0.05, respectively; Fig. 4), and S6 phosphorylation at Ser240/244 was significantly higher in the HC group (p < 0.05). However, total levels of 4EBP1, S6K1 and S6 were unchanged (p = 0.4, 0.6 and 1, respectively).
Figure 4.
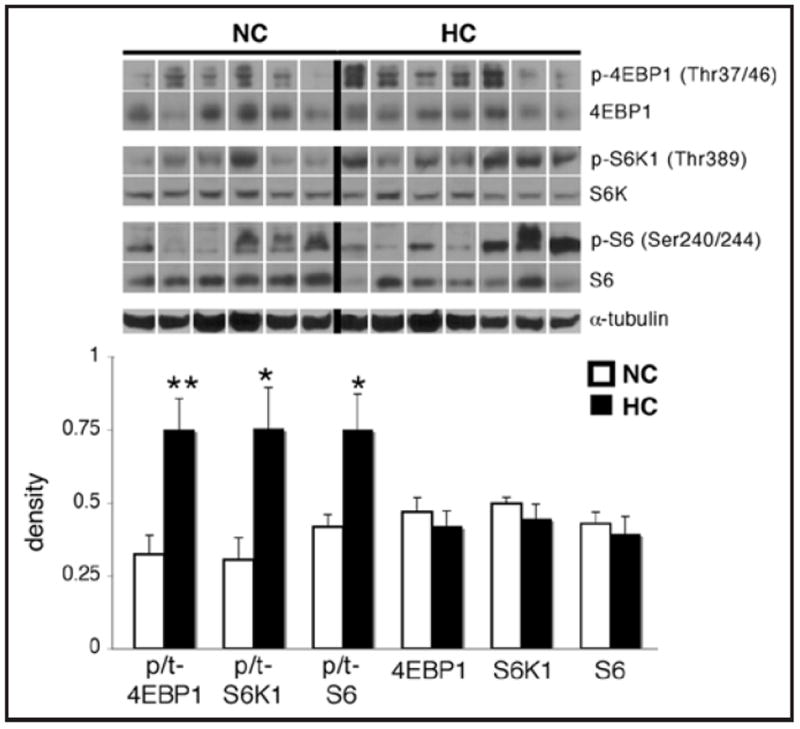
Hypercholesterolemia is associated with increased phosphorylation of cardiac mTORC1 targets. Representative western blots for phospho-4EBP1 (Thr37/46), phospho-S6K1 (Thr389), phospho-S6 (Ser240/244), total levels of these proteins, and α-tubulin in the left ventricle of hypercho-lesterolemic (HC) and normocholesterolemic (NC) pigs, and quantification of the data. Bands were rearranged from the original gel for clarity of presentation. Densities were calculated relative to total Ponceau S staining. Phosphorylation is presented as the phospho-to-total (p/t) ratio of the protein. Data are expressed as mean ± SEM. *p < 0.05, **p < 0.01 versus control.
mTORC2 activity
The phosphorylation of Akt at Ser473 was significantly higher in the HC group (p < 0.05; Fig. 5). As measured by a pan-PKC antibody with reactivity to Ser657 of PKCα, the phosphorylation of a PKC isoform at the same molecular weight as PKCα was increased by more than 2-fold in the HC group (p < 0.01), and levels of PKCα were also higher in the HC group (p < 0.01).
Figure 5.
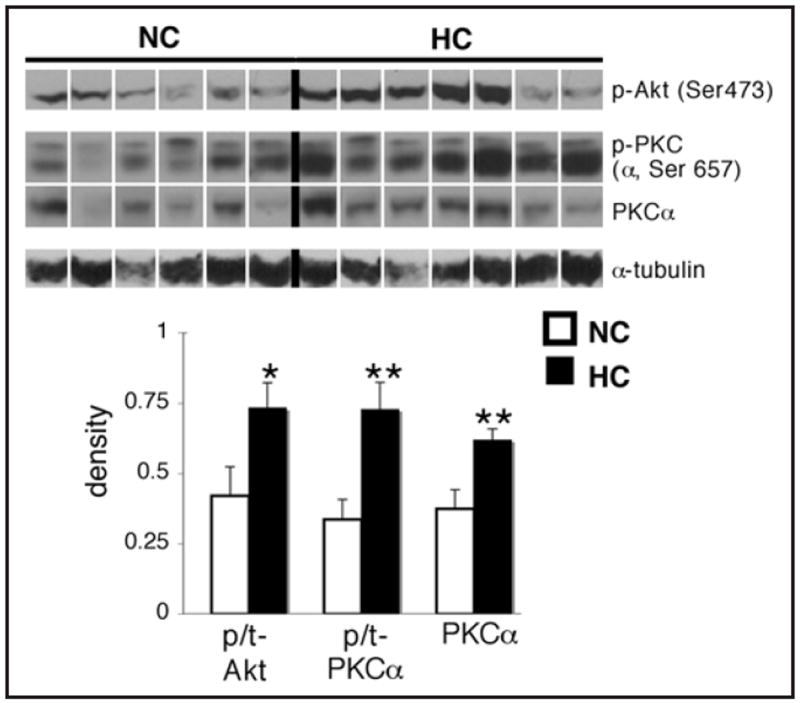
Hypercholesterolemia is associated with increased phosphorylation of mTORC2 targets, and an increase in PKCα levels in the myocardium. Representative western blots for phospho-Akt (Ser473), phospho-PKC (α, Ser657), total PKCα and α-tubulin in the left ventricle of hypercholesterolemic (HC) and normocholesterolemic (NC) pigs, and quantification of the data. For total levels of Akt corresponding to the phospho-Akt (Ser473) blot, see Figure 2. The phospho-PKC antibody was a phospho-pan PKC antibody with reactivity to PKCα when phosphorylated at Ser657. This is the thicker bottom band which overlapped with total PKCα. Bands were rearranged from the original gel for clarity of presentation. Densities were calculated relative to total Ponceau S staining. Phosphorylation is presented as the phospho-to-total (p/t) ratio of the protein. Data are expressed as mean ± SEM. *p < 0.05, **p < 0.01 versus control.
Immunolocalization of mTOR
Immunofluorescence studies showed that mTOR was highly expressed in myocytes (Fig. 6), and could not be detected in other cardiac cell types, such as the vascular endothelium or smooth muscle. Of the 3 animals examined from each group, all of the HC animals exhibited mTOR staining in a punctate perinuclear distribution, whereas staining for mTOR in the ND animals was diffusely cytoplasmic when detectable. A similar cellular expression and distribution was seen for phospho-S6K1 (data not shown). To confirm the specificity of the mTOR antibody, we incubated the mTOR antibody with a blocking peptide, and this eliminated mTOR staining (Suppl. Fig. 2A). mTOR did not co-localize in the HC group with SERCA2 ATPase, a marker for the sarcoplasmic reticulum/endoplasmic reticulum (Suppl. Fig. 2B).
Figure 6.
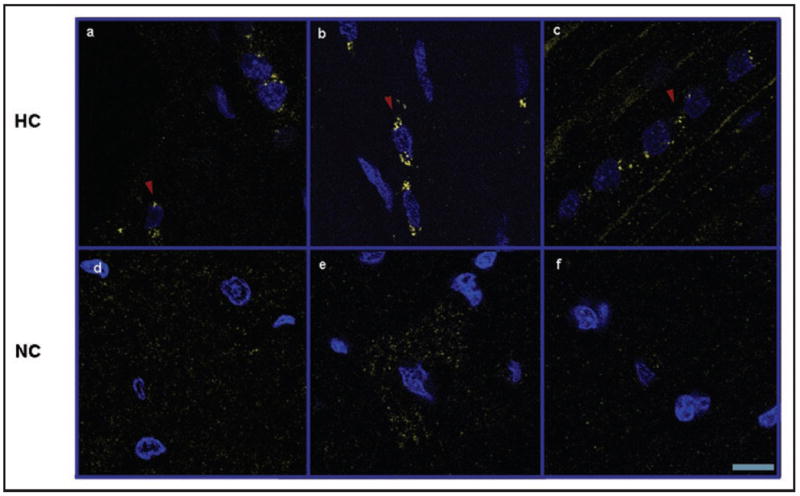
Hypercholesterolemia is associated with perinuclear localization of mTOR within myocytes. Confocal microscopy of mTOR (yellow) in the left ventricle of hypercholesterolemic (HC, a–c) and normocholesterolemic (NC, d–f) pigs. Perinuclear localization of mTOR is indicated with red arrowheads. Sections were co-stained with 4’,6’-diamidino-2-phenylindole (DAPI, blue). Representative images are shown for three pigs selected randomly from each group. Scale bar represents 10 μm.
Cardiac hypertrophy and autophagy
Total levels of β-actin, troponin I, troponin T and SERCA2 ATPase were significantly increased in the HC group (p < 0.05 for all; Fig. 7), while levels of α-tubulin did not change (p = 0.7). The ratio of LC3B II/I also tended to be lower in the HC group (p = 0.08).
Figure 7.
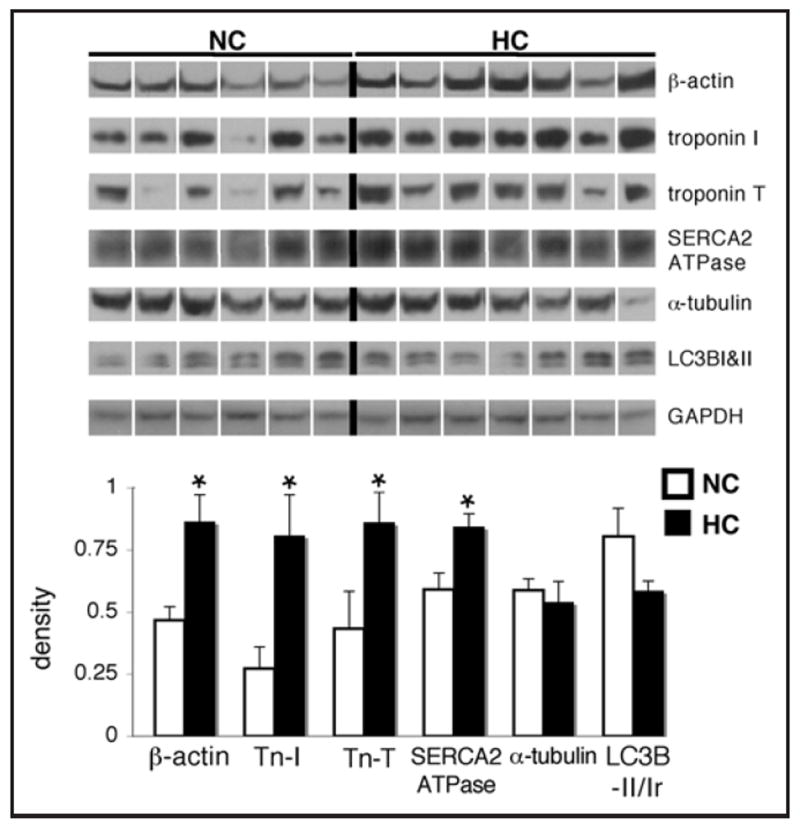
Hypercholesterolemia is associated with increased levels of hypertrophy-associated proteins, and a trend toward decreased autophagy in the myocardium. Representative western blots for β-actin, troponin I, troponin T, SERCA2 ATPase, α-tubulin, LC3B-I&II and GAPDH as a loading control in the left ventricle of hypercholesterolemic (HC) and normocholesterolemic (NC) pigs, and quantification of the data. Bands were rearranged from the original gel for clarity of presentation. Densities were calculated relative to total Ponceau S staining. The ratio of LC3B-II to I (LC3B-II/Ir) was calculated by dividing the density of the bottom band by that of the top on the LC3B blots. Data are expressed as mean ± SEM. *p < 0.05 versus control.
Correlation between biochemical parameters and mTORC1 and 2 signaling
The ratio of phospho-to-total mTOR, 4EBP1, Akt (Ser473) and total Rheb, PKCα, and SERCA2 ATPase directly correlated with serum total cholesterol and LDL levels (See Suppl. Table 1). The ratio of phospho-to-total AMPK inversely correlated with serum total cholesterol, LDL and HDL. None of the measured proteins or phosphorylated proteins exhibited a correlation with triglycerides or body weight, except total PKCα and troponin T, which directly correlated with triglycerides (Suppl. Table 1).
Discussion
Hypercholesterolemia is a major risk factor for coronary artery disease, myocardial infarction and adverse outcomes after ischemic events.1 It is also associated with cardiac hypertrophy.17 We demonstrate that early hypercholesterolemia in pigs increased total levels of mTOR and raptor and activated mTORC1 signaling. We show that mTORC2 signaling was activated since Akt and PKCα signaling was increased. The hypercholesterolemic pigs also showed higher levels of cardiac hypertrophy markers and a trend toward inhibition of autophagy in the myocardium. These findings carry important implications for the role of mTOR in altering cardiac metabolism in hypercholesterolemia, and may influence the heart’s response to ischemia.
Hypercholesterolemia activated mTORC1 through several mechanisms. Total levels of mTOR and raptor were increased and directly correlated with serum cholesterol, indicating that may be novel sensors to cholesterol levels. This occurred through an as-yet-undefined mechanism since levels of FOXO1 and 4EBP1, the only molecules known to regulate mTOR and raptor expression,18 were not changed (for FOXO1, see Suppl. Fig. 3A). In addition, Akt and AMPK were upstream mediators leading to activation of mTORC1. Akt was more phosphorylated on Thr308 and Ser473 in the HC group, and the mTORC1 inhibitor PRAS40 was more phosphorylated on Thr246, indicating that Akt contributed to mTOR activation via PRAS40 inhibition.19 The higher Ser2448 phosphorylation of mTOR also indicated that mTORC1 was more activated by Akt in the HC group, although S6K1 may also phosphorylate this site.20 AMPK, a key negative regulator of mTORC1,7 was less active (less phosphorylated on Thr172) in the HC group. Akt is sequentially activated, first by the phosphorylation of Thr308 by PDK1 through PI3K signaling, and then fully activated by mTORC2’s phosphorylation of Ser473.21 AMPK was likely inhibited by the high intracellular energy status in the HC group, since fatty acids are a principal source of energy to cardiomyocytes,22 and AMPK is inhibited by a high intracellular ATP/AMP ratio.23
Other upstream modulators of mTORC1 activity were also altered in hypercholesterolemia, including Rheb, another nutrient-stimulated activator of mTORC1,7 which was decreased in the HC group. We also measured REDD1, which has been shown to be induced by oxidative stress,24 but it showed no change in the HC group, even though hypercholesterolemia is associated with chronic oxidative stess.25 However, the major downstream targets of mTORC1, 4EBP1 and S6K1, were hyperphosphorylated in the HC group, indicating that mTORC1 was activated in the HC group, likely due to both overexpression of mTOR and raptor as well as stimulation of upstream signaling, including Akt and AMPK. These sites (Thr36/47 on 4EBP1 and Thr389 on S6K1) are classic measures of mTORC1 activity.26 We also observed intense punctate perinuclear staining for mTOR in the HC group compared to diffuse cytoplasmic staining when detectable in the ND group. This is consistent with a similar shift in mTOR staining observed in human cells in vitro when mTORC1 was stimulated with amino acids, further suggesting that mTORC1 was activated in our model.27 Combined with the phospho-S6K1 immunostaining, this indicates that myocytes were the primary cell type contributing to the hyperactive mTOR signaling in pigs fed a high-fat/high-cholesterol diet. mTOR did not colocalize with the sarcoplasmic reticulum/endoplasmic reticulum in the HC group,24 as it is believed to localize in some cell types,28 and whether any organelles, such as mitochondria, are mainly affected by the increased mTOR signaling/expression in hypercholesterolemia, remains to be elucidated.
We showed that hypercholesterolemia also activated myocardial mTORC2. Total levels of rictor, a key component of mTORC2,29 and mLST8, a component common to both complexes, were not altered in hypercholesterolemia. However, the phosphorylation of Akt on Ser473 and PKCα on Ser657 were increased in the HC group. These residues are the main sites phosphorylated by mTORC2.21 mTORC2 also increases the stability of PKCα,30 and total levels of PKCα were higher in the HC group. The activity of mTORC2 may have been increased by the higher levels of mTOR in hypercholesterolemia, or still unknown upstream mediators. The major substrates of mTORC2 are Akt, which further activates mTORC1, and PKCα, which affects microvascular function and cardiac contractility.
Hypercholesterolemia and diets high in saturated fat are independent risk factors for the development of left ventricular hypertrophy, which heavily influences morbidity and mortality from cardiovascular disease.17 The HC pigs displayed increased markers of cardiac hypertrophy, which is significant in light of the changes observed in mTOR signaling. mTORC1 regulates the development of cardiac hypertrophy, primarily via promotion of protein synthesis in myocytes.31-33 We observed enhanced phosphorylation of the ribosomal protein S6 in the HC group, and when coupled with the increased phosphorylation of 4EBP1, a translational inhibitor in its nonphosphorylated form, this indicates a trend toward increased protein synthesis in the hypercholesterolemic myocardium. mTORC2 also plays a role in cardiac hypertrophy,10 since it controls the actin cytoskeleton and activates Akt and PKCα, which has been shown to maintain contractile force by associating with troponin I in myocytes.34 The effect of mTOR on the expression of both fetal and constitutive hypertrophy genes is not well understood. However mTORC1 and 2 may contribute to the hypertrophic changes observed in the hypercholesterolemic myocardium.
Hypercholesterolemia is a prevalent condition in patients with ischemic heart disease, and influences outcomes after cardiac events and procedures.1,2 Previous studies have focused on microvascular and endothelial dysfunction as an explanation for hypercholesterolemia’s adverse cardiac effects.35,36 However, metabolic conditions within myocytes influence the heart’s response to ischemic injury and are altered by major cardiovascular risk factors.37,38 The hypercholesterolemic pigs in our study exhibited a 45% greater infarct after ischemia-reperfusion than control pigs,4 after only four weeks of feeding with a hypercholesterolemic diet that also activated mTOR. Constitutive activation of mTOR has been shown both in vitro and in vivo to induce necrosis, apoptosis and autophagic cell death upon nutrient deprivation and hypoxia,39-43 and transgenic mice with chronic activation of Akt displayed a larger infarct after cardiac I/R.44 Our study is the first to suggest that hyperactivation of the mTOR pathway through dietary modifications in a large animal model may sensitize the myocardium to I/R injury.
Hyperactive mTOR signaling may increase myocardial susceptibility to ischemic injury in several ways (Fig. 8). Decreasing myocardial energy demand is a major strategy for reducing I/R injury during acute myocardial infarction. mTORC1 instead increases energy demand by activating translation and promoting the development of a hypertrophic, hypercontractile phenotype. In fact, inhibition of protein synthesis, in part through HIF-1α-mediated downregulation of mTOR signaling,45 has been shown to protect cells from hypoxia by reducing mTOR-mediated stimulation of translation. We observed a potential activation of translation in both the ischemic and non-ischemic myocardial territories of the HC group, including lower levels of HIF-1α, in conjunction with higher S6K1 levels, which activates the ribosomal protein S6, in the ischemic myocardial territory (Suppl. Fig. 3B). Similarly, these HC pigs demonstrated hyperdynamic cardiac function throughout the entire I/R event, including increased developed left ventricular pressure, peak systolic function, and mean arterial pressure (MAP).4 On a molecular level, the activation of mTORC1 in the HC group also inhibited autophagy, an important cellular process for degrading old organelles and proteins,46 as indicated by the lower ratio of LC3B-II/I, a marker of autophagy.47 Combined with increased protein synthesis, the activation of mTORC1 may have led not only to a hypertrophic, hyperdynamic phenotype, but also to the accumulation of misfolded proteins and damaged mitochondria in the HC myocardium, increasing its susceptibility to ischemia.48,49
Figure 8.
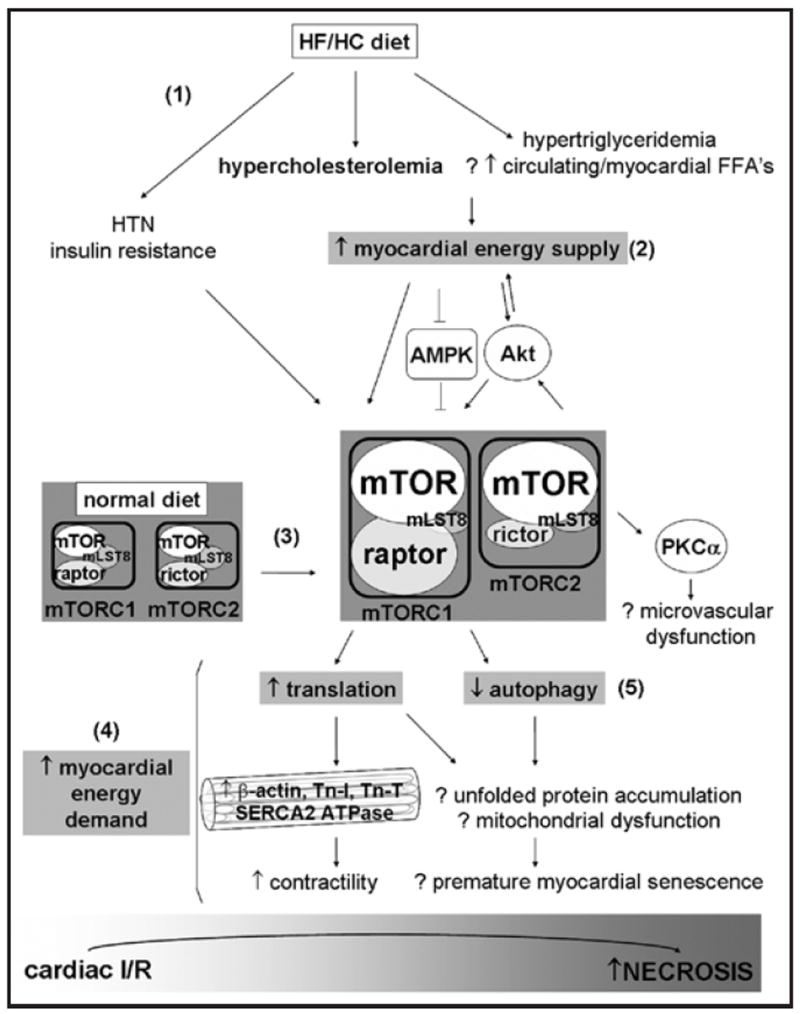
Proposed role of mTORC1 and 2 signaling in perpetuating a hyperactive energy supply-and-demand cycle upon high-fat/high-cholesterol (HF/HC) diet feeding. The HF/HC diet induced several metabolic changes (1), including hypercholesterolemia, slight hypertriglyceridemia, slight hypertension (HTN), and, in some pigs, insulin resistance. The HF/HC diet may have increased free fatty acid (FFA) availability and total energy supply (2) to the myocardium. By affecting various upstream mediators, including Akt and AMPK, and increasing total mTOR and raptor levels (3), the HF/HC diet activated both mTORC1 and mTORC2 in myocytes. Myocardial energy demand was enhanced by mTORC1 (4), which promotes translation, the synthesis of contractile proteins, and enhances contractility. mTORC1 also inhibited autophagy (5), potentially leading to the accumulation of misfolded proteins, mitochondrial dysfunction, and premature myocardial senescence. mTORC2 potentiated this cycle by activating Akt, which transports more nutrients into the myocardium and further activates mTORC1. These metabolic and signaling alterations induced by the HF/HC diet may increase the susceptibility of myocytes to ischemia-reperfusion (I/R) injury.
mTORC2 may also play a role in ischemic injury through its activation of PKCα and Akt. PKCα contributes to microvascular dysfunction and I/R injury, especially in the setting of hypercholesterolemia.50,51 Akt may also contribute to the metabolic effects of hypercholesterolemia on the myocardium, since it promotes the intracellular transport of glucose and lipids52,53 and further activates mTORC1. We hypothesize that this coactivation of cardiac mTORC1 and 2 perpetuates a hyperactive energy supply-and-demand cycle in the hypercholesterolemic myocardium, increasing its susceptibility to the withdrawal of nutrients and oxygen upon ischemia.
In conclusion, our study highlights a role for cardiac mTORC1 and 2 signaling in nutritional excess, hypercholesterolemia and ischemic injury. It cannot (1) refute the possibility that hemo-dynamic stress, due to a high MAP or the acute I/R event also activated mTOR signaling in the non-ischemic left ventricle; nor (2) provide direct evidence that hypercholesterolemia specifically activates mTORC1 and 2 in myocytes. Instead, we used a clinically-relevant porcine model of diet-induced hypercholesterolemia, which is known to produce multiple changes similar to the metabolic syndrome in humans.15 These pigs had slight hypertension, slight hypertriglyceridemia, and likely metabolic changes in other organs that may have also contributed to the alterations we observed in cardiac mTORC1 and 2 signaling. This is a strength and not a weakness of our study since it implicates hyperactive mTORC1 and 2 signaling in the cardiac pathologies associated with a high-fat/high-cholesterol diet, and correlates novel changes in mTOR and raptor expression with cholesterol levels. Rapamycin, which dissociates mTOR from raptor and can inhibit both mTORC1 and 2, is already being used clinically in transplantation and drug-eluting stents. Given our findings, it is worth examining the potential utility of rapamycin as well as specific mTORC1 and 2 inhibitors in models of I/R, hypertrophy and heart failure, particularly in the setting of hypercholesterolemia and other metabolic diseases.
Methods
Animals
At 20 weeks of age, seven intact male Yucatan mini-swine were fed a normal diet (NC) consisting of standard Minipig Breeder Diet (Purina, St. Louis, MO), while seven were fed a hypercholesterolemic diet (HC) for 4 weeks that substituted 25% of the ND with 17.2% coconut oil, 2.3% corn oil, 4% cholesterol and 1.5% sodium cholate. Animals were housed individually and provided with laboratory chow and water ad libitum. All experiments were approved by the Beth Israel Deaconess Medical Center Animal Care and Use Committee and the Harvard Medical Area Standing Committee on Animals. This investigation conforms with the Guide for the Care and Use of Laboratory Animals published by the US National Institutes of Health (NIH Publication No. 85-23, revised 1996).
Pigs were fasted for 12 hours prior to harvesting the tissue used in this study. They had undergone 1 hr. myocardial ischemia/2 hr. reperfusion of the left anterior descending coronary artery for another study,4 and monastryl blue dye (Engelhard Corp., Louisville, KY) was injected into the coronary arteries to demarcate the non-ischemic ventricular tissue before harvesting. Only non-ischemic tissue was used in this study. Tissue was rapidly frozen in liquid nitrogen and stored at -80°C for use in western blotting. Tissue was fixed in 10% formaldehyde for 3 hours followed by 20% sucrose overnight at 4°C, mounted in tissue blocks with OCT (Sakura Finetek, Torrance, CA), and frozen at -80°C for use in immunofluorescence studies.
Western blotting
Ventricular tissue from the non-ischemic territory was homogenized in 25 mL RIPA buffer consisting of 50 mM Tris-HCl pH 7.4, 150 mM NaCl, 1% NP-40, 0.5% sodium deoxycholate, 0.1% SDS (Boston Bioproducts, Worcester, MA), phosphatase inhibitor cocktails I and II at 1:100 (Sigma, St. Louis, MO), one-half tablet of Complete EDTA-free protease inhibitor cocktail (Roche, Indianapolis, IN) and 64 mM NaF (Fisher Scientific, Pittsburgh, PA). Protein concentration was quantified using the Micro BCA Protein Assay Kit (Pierce, Rockford, Illinois) and equal amounts of protein (35 to 40 ug) were subjected to SDS-PAGE on 4–20% polyacrylamide gels (Pierce, Rockford, Illinois). Proteins were transferred to PVDF membranes (Millipore, Bellerica, MA) at 40 V overnight. Membranes were stained with Ponceau S to ensure equal protein transfer and separation. Membranes were blocked in 5% blotting-grade milk (Biorad, Hercules, CA), washed in TBS with 0.05% Tween-20 (Boston Bioproducts), followed by incubations in primary and secondary antibodies and Supersignal West Pico Chemiluminescent Substrate (Pierce) according to the manufacturers’ recommendation.
Optical density values were obtained from X-ray films using a flat-bed scanner and ImageJ 1.4 software (National Institutes of Health, USA). All calculated densities were normalized to total Ponceau S staining intensity. Protein phosphorylation was assessed by dividing levels of the phosphorylated form of the protein by levels of its total expression. Expression levels are presented in arbitrary units as mean ± SEM. Samples were originally loaded in a different order, and bands from X-ray films were rearranged in the Figures for clarity of presentation.
Immunofluorescence
Three animals were analyzed randomly from each group. Ten μm frozen sections from the non-ischemic ventricular territory were washed in PBS for 5 min and treated with 1% SDS (Boston Bioproducts) for 5 min. Sections were washed 3 times before blocking in 1% BSA for 1 hr. An mTOR antibody (the same used in immunoblots) was added overnight at 4°C, followed by 3 washes in PBS and incubation with anti-rabbit AlexaFluor 555 (Molecular Probes, Eugene, OR) for 30 min. Sections were washed again three times in PBS and mounted in Vectashield plus DAPI (Vector Labs, Burlingame, CA). Slides were viewed under a Zeiss LSM510 confocal microscope (Carl Zeiss MicroImaging Inc., Thornwood, NY). Negative controls consisted of adsorption of the mTOR antibody with a blocking peptide or skipping the primary antibody. The images shown were taken at settings for which incubation with secondary antibody alone showed no signal.
Antibodies
All antibodies and blocking peptide were obtained from Cell Signaling Technology (Beverly, MA) with the following exceptions: anti-α-tubulin and anti-HIF-1α from Sigma (St. Louis, MO), anti-REDD1 from Proteintech Group, Inc. (Chicago, IL), anti-PKCα and anti-β-actin HRP from Santa Cruz Biotechnology (Santa Cruz, CA), anti-troponin I and anti-troponin T from US Biologicals (Swampscott, MA), and peroxidase-conjugated anti-rabbit light-chain specific secondary antibody from Jackson Immunoresearch (West Grove, PA) for phospho-S6K1 blots. The phospho-pan PKC antibody was #9371 from Cell Signaling.
Statistical analysis
Densitometry values were analyzed with the unpaired student’s t-test or Mann-Whitney U test when appropriate (SigmaStat, Systat Software, San Jose, CA), and Pearson or Spearman’s correlation coefficients with respective p values were calculated using GraphPad Prism 4 (GraphPad Software, La Jolla, CA). One control animal was excluded from the study using Dixon’s Q-test due to extremely high phosphorylation and total levels of many proteins measured in this study.
Supplementary Material
Acknowledgments
We thank the staff of the Animal Research Facility at the Beth Israel Deaconess Medical Center for their work. We also thank Dr. John Blenis for his critical reading of the manuscript.
This work was supported by the National Heart, Lung and Blood Institute [HL46716 and HL69024 to F.W.S.]; the Jack Kent Cook Foundation [to H.P.G.]; and the National Institutes of Health [HL076130 to R.M.O.].
Abbreviations
- mTOR
mammalian target of rapamycin
- HC
hypercholesterolemic
- NC
normocholesterolemic
- S6K1
S6 kinase 1
- 4EBP1
eukaryotic translation initiation factor 4E binding protein 1
- S6
ribosomal protein S6
- PKCα
protein kinase C alpha
- I/R
ischemia-reperfusion
- mTORC1
mTOR complex 1
- mTORC2
mTOR complex 2
- mLST8
G protein β-subunit-like protein
- PRAS40
proline-rich Akt substrate of 40 kDa
- AMPK
AMP-activated protein kinase
- Rheb
ras homolog enriched in brain
- REDD1
regulated in development and DNA damage 1
- HIF-1
responsive protein
- SERCA2 ATPase
sarcoplasmic/endoplasmic reticulum calcium ATPase 2
- LC3B
microtubule-associated protein 1 light chain 3B
- HIF-1α
hypoxia-inducible factor 1α
- MAP
mean arterial pressure
Footnotes
Note
Supplementary materials can be found at: www.landesbioscience.com/supplement/GlazerCC8-11-Sup.pdf
References
- 1.Liu YB, Wu CC, Lee CM, Chen WJ, Wang TD, Chen PS, Lee YT. Dyslipidemia is associated with ventricular tachyarrhythmia in patients with acute ST-segment elevation myocardial infarction. J Formos Med Assoc. 2006;105:17–24. doi: 10.1016/S0929-6646(09)60104-2. [DOI] [PubMed] [Google Scholar]
- 2.Mehta RH, Bhatt DL, Steg PG, Goto S, Hirsch AT, Liau CS, et al. Modifiable risk factors control and its relationship with 1 year outcomes after coronary artery bypass surgery: insights from the REACH registry. Eur Heart J. 2008;29:3052–60. doi: 10.1093/eurheartj/ehn478. [DOI] [PMC free article] [PubMed] [Google Scholar]
- 3.Mitrou PN, Kipnis V, Thiebaut AC, Reedy J, Subar AF, Wirfalt E, et al. Mediterranean dietary pattern and prediction of all-cause mortality in a US population: results from the NIH-AARP Diet and Health Study. Arch Intern Med. 2007;167:2461–8. doi: 10.1001/archinte.167.22.2461. [DOI] [PubMed] [Google Scholar]
- 4.Osipov RM, Bianchi C, Feng J, Liu Y, Clements RT, Sodha N, et al. Effect of hypercholesterolemia on myocardial necrosis and apoptosis in the setting of ischemia-reperfusion. Circulation. 2009 doi: 10.1161/CIRCULATIONAHA.108.842724. In Press. [DOI] [PMC free article] [PubMed] [Google Scholar]
- 5.Turk JR, Henderson KK, Vanvickle GD, Watkins J, Laughlin MH. Arterial endothelial function in a porcine model of early stage atherosclerotic vascular disease. International journal of experimental pathology. 2005;86:335–45. doi: 10.1111/j.0959-9673.2005.00446.x. [DOI] [PMC free article] [PubMed] [Google Scholar]
- 6.Gidding SS, Lichtenstein AH, Faith MS, Karpyn A, Mennella JA, Popkin B, et al. Implementing American Heart Association pediatric and adult nutrition guidelines: a scientific statement from the american heart association nutrition committee of the council on nutrition, physical activity and metabolism, council on cardiovascular disease in the young, council on arteriosclerosis, thrombosis and vascular biology, council on cardiovascular nursing, council on epidemiology and prevention, and council for high blood pressure research. Circulation. 2009;119:1161–75. doi: 10.1161/CIRCULATIONAHA.109.191856. [DOI] [PubMed] [Google Scholar]
- 7.Jacinto E. What controls TOR? IUBMB Life. 2008;60:483–96. doi: 10.1002/iub.56. [DOI] [PubMed] [Google Scholar]
- 8.Patel PH, Tamanoi F. Increased Rheb-TOR signaling enhances sensitivity of the whole organism to oxidative stress. J Cell Sci. 2006;119:4285–92. doi: 10.1242/jcs.03199. [DOI] [PubMed] [Google Scholar]
- 9.Blagosklonny MV. Aging: ROS or TOR. Cell Cycle. 2008;7:3344–54. doi: 10.4161/cc.7.21.6965. [DOI] [PubMed] [Google Scholar]
- 10.Balasubramanian S, Johnston RK, Moschella PC, Mani SK, Tuxworth WJ, Jr, Kuppuswamy D. mTOR in growth and protection of hypertrophying myocardium. Cardiovasc Hematol Agents Med Chem. 2009;7:52–63. doi: 10.2174/187152509787047603. [DOI] [PMC free article] [PubMed] [Google Scholar]
- 11.Jonassen AK, Sack MN, Mjos OD, Yellon DM. Myocardial protection by insulin at reperfusion requires early administration and is mediated via Akt and p70s6 kinase cell-survival signaling. Circ Res. 2001;89:1191–8. doi: 10.1161/hh2401.101385. [DOI] [PubMed] [Google Scholar]
- 12.Oudit GY, Penninger JM. Cardiac Regulation by Phosphoinositide 3-kinases and PTEN. Cardiovasc Res. 2009:250–60. doi: 10.1093/cvr/cvp014. [DOI] [PubMed] [Google Scholar]
- 13.Murphy E, Steenbergen C. Mechanisms underlying acute protection from cardiac ischemia-reperfusion injury. Physiol Rev. 2008;88:581–609. doi: 10.1152/physrev.00024.2007. [DOI] [PMC free article] [PubMed] [Google Scholar]
- 14.Khan S, Salloum F, Das A, Xi L, Vetrovec GW, Kukreja RC. Rapamycin confers preconditioning-like protection against ischemia-reperfusion injury in isolated mouse heart and cardiomyocytes. J Mol Cell Cardiol. 2006;41:256–64. doi: 10.1016/j.yjmcc.2006.04.014. [DOI] [PubMed] [Google Scholar]
- 15.Spurlock ME, Gabler NK. The development of porcine models of obesity and the metabolic syndrome. J Nutr. 2008;138:397–402. doi: 10.1093/jn/138.2.397. [DOI] [PubMed] [Google Scholar]
- 16.Muniyappa R, Lee S, Chen H, Quon MJ. Current approaches for assessing insulin sensitivity and resistance in vivo: advantages, limitations and appropriate usage. American journal of physiology. 2008;294:15–26. doi: 10.1152/ajpendo.00645.2007. [DOI] [PubMed] [Google Scholar]
- 17.Sundstrom J, Lind L, Vessby B, Andren B, Aro A, Lithell H. Dyslipidemia and an unfavorable fatty acid profile predict left ventricular hypertrophy 20 years later. Circulation. 2001;103:836–41. doi: 10.1161/01.cir.103.6.836. [DOI] [PubMed] [Google Scholar]
- 18.Southgate RJ, Neill B, Prelovsek O, El-Osta A, Kamei Y, Miura S, et al. FOXO1 regulates the expression of 4E-BP1 and inhibits mTOR signaling in mammalian skeletal muscle. J Biol Chem. 2007;282:21176–86. doi: 10.1074/jbc.M702039200. [DOI] [PubMed] [Google Scholar]
- 19.Vander Haar E, Lee SI, Bandhakavi S, Griffin TJ, Kim DH. Insulin signalling to mTOR mediated by the Akt/PKB substrate PRAS40. Nat Cell Biol. 2007;9:316–23. doi: 10.1038/ncb1547. [DOI] [PubMed] [Google Scholar]
- 20.Lawrence JC, Lin TA, McMahon LP, Choi KM. Modulation of the protein kinase activity of mTOR. Curr Top Microbiol Immunol. 2004;279:199–213. doi: 10.1007/978-3-642-18930-2_12. [DOI] [PubMed] [Google Scholar]
- 21.Ikenoue T, Inoki K, Yang Q, Zhou X, Guan KL. Essential function of TORC2 in PKC and Akt turn motif phosphorylation, maturation and signalling. EMBO J. 2008;27:1919–31. doi: 10.1038/emboj.2008.119. [DOI] [PMC free article] [PubMed] [Google Scholar]
- 22.Neely JR, Rovetto MJ, Oram JF. Myocardial utilization of carbohydrate and lipids. Prog Cardiovasc Dis. 1972;15:289–329. doi: 10.1016/0033-0620(72)90029-1. [DOI] [PubMed] [Google Scholar]
- 23.Sanz P. AMP-activated protein kinase: structure and regulation. Curr Protein Pept Sci. 2008;9:478–92. doi: 10.2174/138920308785915254. [DOI] [PubMed] [Google Scholar]
- 24.Ellisen LW, Ramsayer KD, Johannessen CM, Yang A, Beppu H, Minda K, et al. REDD1, a developmentally regulated transcriptional target of p63 and p53, links p63 to regulation of reactive oxygen species. Mol Cell. 2002;10:995–1005. doi: 10.1016/s1097-2765(02)00706-2. [DOI] [PubMed] [Google Scholar]
- 25.Boodhwani M, Nakai Y, Mieno S, Voisine P, Bianchi C, Araujo EG, et al. Hypercholesterolemia impairs the myocardial angiogenic response in a swine model of chronic ischemia: role of endostatin and oxidative stress. Ann Thorac Surg. 2006;81:634–41. doi: 10.1016/j.athoracsur.2005.07.090. [DOI] [PubMed] [Google Scholar]
- 26.Burnett PE, Barrow RK, Cohen NA, Snyder SH, Sabatini DM. RAFT1 phosphorylation of the translational regulators p70 S6 kinase and 4E-BP1. Proc Natl Acad Sci USA. 1998;95:1432–7. doi: 10.1073/pnas.95.4.1432. [DOI] [PMC free article] [PubMed] [Google Scholar]
- 27.Sancak Y, Peterson TR, Shaul YD, Lindquist RA, Thoreen CC, Bar-Peled L, Sabatini DM. The Rag GTPases bind raptor and mediate amino acid signaling to mTORC1. Science. 2008;320:1496–501. doi: 10.1126/science.1157535. [DOI] [PMC free article] [PubMed] [Google Scholar]
- 28.Drenan RM, Liu X, Bertram PG, Zheng XF. FKBP12-rapamycin-associated protein or mammalian target of rapamycin (FRAP/mTOR) localization in the endoplasmic reticulum and the Golgi apparatus. J Biol Chem. 2004;279:772–8. doi: 10.1074/jbc.M305912200. [DOI] [PubMed] [Google Scholar]
- 29.Sarbassov DD, Ali SM, Kim DH, Guertin DA, Latek RR, Erdjument-Bromage H, et al. Rictor, a novel binding partner of mTOR, defines a rapamycin-insensitive and raptor-independent pathway that regulates the cytoskeleton. Curr Biol. 2004;14:1296–302. doi: 10.1016/j.cub.2004.06.054. [DOI] [PubMed] [Google Scholar]
- 30.Facchinetti V, Ouyang W, Wei H, Soto N, Lazorchak A, Gould C, et al. The mammalian target of rapamycin complex 2 controls folding and stability of Akt and protein kinase C. EMBO J. 2008;27:1932–43. doi: 10.1038/emboj.2008.120. [DOI] [PMC free article] [PubMed] [Google Scholar]
- 31.Ha T, Li Y, Hua F, Ma J, Gao X, Kelley J, et al. Reduced cardiac hypertrophy in toll-like receptor 4-deficient mice following pressure overload. Cardiovasc Res. 2005;68:224–34. doi: 10.1016/j.cardiores.2005.05.025. [DOI] [PubMed] [Google Scholar]
- 32.Proud CG. Ras, PI3-kinase and mTOR signaling in cardiac hypertrophy. Cardiovasc Res. 2004;63:403–13. doi: 10.1016/j.cardiores.2004.02.003. [DOI] [PubMed] [Google Scholar]
- 33.Hedhli N, Pelat M, Depre C. Protein turnover in cardiac cell growth and survival. Cardiovasc Res. 2005;68:186–96. doi: 10.1016/j.cardiores.2005.06.025. [DOI] [PubMed] [Google Scholar]
- 34.Molnar A, Borbely A, Czuriga D, Siket IM, Szilagyi S, Hertelendi Z, et al. Protein kinase c contributes to the maintenance of contractile force in human ventricular cardiomyocytes. J Biol Chem. 2008:1031–9. doi: 10.1074/jbc.M807600200. [DOI] [PubMed] [Google Scholar]
- 35.Koh KK, Oh PC, Quon MJ. Does reversal of oxidative stress and inflammation provide vascular protection? Cardiovasc Res. 2009:649–59. doi: 10.1093/cvr/cvn354. [DOI] [PubMed] [Google Scholar]
- 36.Galinanes M, Fowler AG. Role of clinical pathologies in myocardial injury following ischaemia and reperfusion. Cardiovasc Res. 2004;61:512–21. doi: 10.1016/j.cardiores.2003.11.028. [DOI] [PubMed] [Google Scholar]
- 37.Ussher JR, Lopaschuk GD. The malonyl CoA axis as a potential target for treating ischaemic heart disease. Cardiovasc Res. 2008;79:259–68. doi: 10.1093/cvr/cvn130. [DOI] [PubMed] [Google Scholar]
- 38.Morrison ES, Scott RF, Lee WM, Frick J, Kroms M, Cheney CP. Oxidative phosphorylation and aspects of calcium metabolism in myocardia of hypercholesterolaemic swine with moderate coronary atherosclerosis. Cardiovasc Res. 1977;11:547–53. doi: 10.1093/cvr/11.6.547. [DOI] [PubMed] [Google Scholar]
- 39.Lee CH, Inoki K, Karbowniczek M, Petroulakis E, Sonenberg N, Henske EP, et al. Constitutive mTOR activation in TSC mutants sensitizes cells to energy starvation and genomic damage via p53. EMBO J. 2007;26:4812–23. doi: 10.1038/sj.emboj.7601900. [DOI] [PMC free article] [PubMed] [Google Scholar]
- 40.Aki T, Mizukami Y, Oka Y, Yamaguchi K, Uemura K, Fujimiya T, Y, et al. Phosphoinositide 3-kinase accelerates necrotic cell death during hypoxia. Biochem J. 2001;358:481–7. doi: 10.1042/0264-6021:3580481. [DOI] [PMC free article] [PubMed] [Google Scholar]
- 41.Aki T, Yamaguchi K, Fujimiya T, Mizukami Y. Phosphoinositide 3-kinase accelerates autophagic cell death during glucose deprivation in the rat cardiomyocyte-derived cell line H9c2. Oncogene. 2003;22:8529–35. doi: 10.1038/sj.onc.1207197. [DOI] [PubMed] [Google Scholar]
- 42.Bruno P, Calastretti A, Priulla M, Asnaghi L, Scarlatti F, Nicolin A, et al. Cell survival under nutrient stress is dependent on metabolic conditions regulated by Akt and not by autophagic vacuoles. Cell Signal. 2007;19:2118–26. doi: 10.1016/j.cellsig.2007.06.008. [DOI] [PubMed] [Google Scholar]
- 43.Endo H, Murata K, Mukai M, Ishikawa O, Inoue M. Activation of insulin-like growth factor signaling induces apoptotic cell death under prolonged hypoxia by enhancing endoplasmic reticulum stress response. Cancer Res. 2007;67:8095–103. doi: 10.1158/0008-5472.CAN-06-3389. [DOI] [PubMed] [Google Scholar]
- 44.Nagoshi T, Matsui T, Aoyama T, Leri A, Anversa P, Li L, et al. PI3K rescues the detrimental effects of chronic Akt activation in the heart during ischemia/reperfusion injury. J Clin Invest. 2005;115:2128–38. doi: 10.1172/JCI23073. [DOI] [PMC free article] [PubMed] [Google Scholar]
- 45.van den Beucken T, Koritzinsky M, Wouters BG. Translational control of gene expression during hypoxia. Cancer Biol Ther. 2006;5:749–55. doi: 10.4161/cbt.5.7.2972. [DOI] [PubMed] [Google Scholar]
- 46.Gustafsson AB, Gottlieb RA. Recycle or die: the role of autophagy in cardioprotection. J Mol Cell Cardiol. 2008;44:654–61. doi: 10.1016/j.yjmcc.2008.01.010. [DOI] [PMC free article] [PubMed] [Google Scholar]
- 47.Karim MR, Kanazawa T, Daigaku Y, Fujimura S, Miotto G, Kadowaki M. Cytosolic LC3 ratio as a sensitive index of macroautophagy in isolated rat hepatocytes and H4-II-E cells. Autophagy. 2007;3:553–60. doi: 10.4161/auto.4615. [DOI] [PubMed] [Google Scholar]
- 48.Yen WL, Klionsky DJ. How to live long and prosper: autophagy, mitochondria and aging. Physiology (Bethesda) 2008;23:248–62. doi: 10.1152/physiol.00013.2008. [DOI] [PubMed] [Google Scholar]
- 49.Toth A, Nickson P, Mandl A, Bannister ML, Toth K, Erhardt P. Endoplasmic reticulum stress as a novel therapeutic target in heart diseases. Cardiovasc Hematol Disord Drug Targets. 2007;7:205–18. doi: 10.2174/187152907781745260. [DOI] [PubMed] [Google Scholar]
- 50.Sodha NR, Feng J, Clements RT, Bianchi C, Boodhwani M, Ramlawi B, et al. Protein kinase C alpha modulates microvascular reactivity in the human coronary and skeletal microcirculation. Surgery. 2007;142:243–52. doi: 10.1016/j.surg.2007.03.010. [DOI] [PubMed] [Google Scholar]
- 51.Giardina JB, Tanner DJ, Khalil RA. Oxidized-LDL enhances coronary vasoconstriction by increasing the activity of protein kinase C isoforms alpha and epsilon. Hypertension. 2001;37:561–8. doi: 10.1161/01.hyp.37.2.561. [DOI] [PubMed] [Google Scholar]
- 52.Zhou QL, Jiang ZY, Holik J, Chawla A, Hagan GN, Leszyk J, Czech MP. Akt substrate TBC1D1 regulates GLUT1 expression through the mTOR pathway in 3T3-L1 adipocytes. Biochem J. 2008;411:647–55. doi: 10.1042/BJ20071084. [DOI] [PMC free article] [PubMed] [Google Scholar]
- 53.Chabowski A, Coort SL, Calles-Escandon J, Tandon NN, Glatz JF, Luiken JJ, et al. Insulin stimulates fatty acid transport by regulating expression of FAT/CD36 but not FABPpm. American journal of physiology. 2004;287:781–9. doi: 10.1152/ajpendo.00573.2003. [DOI] [PubMed] [Google Scholar]
Associated Data
This section collects any data citations, data availability statements, or supplementary materials included in this article.


