

Abstract
A new approach to generating information on ligand receptor interactions within the binding pocket of G protein-coupled receptors has been developed, called Biophysical Mapping (BPM). Starting from a stabilized receptor (StaR), minimally engineered for thermostability, additional single mutations are then added at positions that could be involved in small molecule interactions. The StaR and a panel of binding site mutants are captured onto Biacore chips to enable characterization of the binding of small molecule ligands using surface plasmon resonance (SPR) measurement. A matrix of binding data for a set of ligands versus each active site mutation is then generated, providing specific affinity and kinetic information (KD, kon, and koff) of receptor–ligand interactions. This data set, in combination with molecular modeling and docking, is used to map the small molecule binding site for each class of compounds. Taken together, the many constraints provided by these data identify key protein–ligand interactions and allow the shape of the site to be refined to produce a high quality three-dimensional picture of ligand binding, thereby facilitating structure based drug design. Results of biophysical mapping of the adenosine A2A receptor are presented.
Introduction
G protein-coupled receptors (GPCRs) are one of the most important classes of protein targets due to their critical role in cell signaling in response to hormones, neurotransmitters, and other metabolites. GPCRs are the site of action for a broad range of small molecule and biological drugs across many therapeutic areas. Until recently, the only X-ray structure solved from this family was that of rhodopsin.1 Knowledge of how drugs interacted with GPCRs has been limited to models based on homology with rhodopsin, enhanced by site-directed mutagenesis experiments (SDM) with radiochemically labeled ligands.2,3 In the last 2–3 years, a number of different technological breakthroughs have resulted in the structures of five new GPCRs, all of which are important drug targets; the β1 and β2 adrenergic receptors, the adenosine A2A receptor, the CXCR4 chemokine receptor, and the dopamine D3 receptor.4−10 Nevertheless obtaining novel GPCR structures in complex with multiple ligands is still very challenging, with some approaches being limited to highly potent antagonist ligands and requiring specialized crystallization techniques in a lipid environment. In addition, crystallography does not provide direct information regarding the energetic and kinetic contributions of particular interactions. Improved methods are therefore required to enable structure-based design approaches to be applied to GPCRs that are complementary to X-ray crystallography and can be rapidly obtained, thereby experimentally enhancing in silico design within the short design–synthesize–test cycles essential for drug discovery.
SDM is a technique commonly used in molecular pharmacology whereby residues of a protein with a known sequence are mutated to differing residues so that the effect on binding of the radioligand being used in the assay can be determined. This technique is extremely powerful in identifying which residues are involved in ligand recognition and binding or catalysis.11 Typically, mutations that cause significant changes in binding affinity are consistent with the participation of their side chains in direct ligand interactions, although confounding factors such as “second shell” effects, changes in solvent structure, and conformational rearrangements or perturbations may complicate interpretation. Critically, the requirement for binding measurements using labeled compounds typically limits studies to one or a few exemplary ligands, and literature data is consequently often incomplete or conflicting, comprising a sparse matrix of data. What is required, and is described herein, is a rapid-turnaround direct-binding method applicable to many ligands and multiple mutations so that a broad matrix of data can be collected, leading to a self-consistent and convergent modeling solution for any given GPCR system.
GPCRs have 7 α-helical membrane spanning domains which interact with lipids within the membrane bilayer. In order to carry out biophysical or structural studies, it is necessary to transfer the protein from the membrane into solution by solubilization with detergent. This process can often result in unfolding and denaturation of the protein due to its inherent instability. Recently, a new technique has been developed which involves the selection of mutations which both increase the thermostability of the receptor as well as driving the receptor toward a particular conformational state. This technique of conformational thermostabilization has been demonstrated for the β1-adrenergic,12 adenosine A2A,13 neurotensin,14 and muscarinic acetylcholine receptors.15 The resultant stabilized receptors, known as StaRs,15 typically contain 4–8 stabilizing mutations. Although these mutations can be identified throughout the receptor, they are selected such that they do not interfere directly with binding to the chosen ligand class. In this study, we used an inverse agonist StaR (fully inactive ground state) of the adenosine A2A receptor which has a greatly increased thermostability compared to that of the wild type receptor and could therefore be purified to homogeneity while also retaining correct folding once immobilized on a chip or bead in detergent.15 The StaR (A2A-STAR1, also known as Rant2113,15) used here contains 4 mutations spread throughout the receptor but distinct from the antagonist binding site (A54L2.52, T88A3.36, K122A4.43, and V239A6.41; superscripts refer to Ballesteros-Weinstein numbering16). The pharmacology has been previously characterized15 and indicates that the receptor has been stabilized in an inverse agonist conformation.
The adenosine A2A receptor is coexpressed with the dopamine D2 receptor on the indirect striatopallidal pathway and acts to oppose the actions of dopamine agonists. Blockade of the A2A receptor in rodent and primate models of Parkinson’s disease (PD) with antagonists alleviates the motor symptoms of the condition and also has been shown to suppress L-DOPA-induced dyskinesias.17 Recently, the clinical agent Preladenant (SCH420814) met its primary end points in phase II clinical trials in moderate to severe PD patients and has progressed into phase III.18 This finding and other encouraging clinical trial results help to validate that antagonism of this receptor is a useful approach to the treatment of PD. In addition, there is a growing body of literature on the potential for adenosine A2A receptor antagonism to protect from neurodegeneration.19 As part of our ongoing efforts to develop adenosine A2A receptor antagonists for the treatment of PD, both crystallographic and SDM approaches have been a focus of effort in our laboratories. With StaRs of the A2A receptor in hand, this system was chosen to establish a new approach to SDM that we call biophysical mapping (BPM). Figure 1 illustrates the approach.
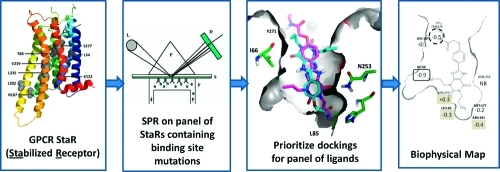
Figure 1.

General scheme for biophysical mapping technology. Mutations within the predicted binding site of the stabilized receptor (StaR) of interest are introduced and the proteins expressed as transient transfections. Each receptor, appropriately tagged, is captured directly from the cell lysate onto Biacore (SPR) chips. Each mutant receptor is then challenged with a panel of antagonists with different potencies and from different chemistries, and a matrix of binding and kinetic data is generated. Molecular modeling of the binding site, utilizing these data, refines both the protein structure and ligand binding interactions for each chemical series.
Starting from the A2A-StaR1, we envisaged capturing the receptor onto a SPR chip and establishing that antagonists could be demonstrated to bind with reproducible potency. Next, a panel of StaRs with additional modifications in the binding site would be generated and each captured on chips in a similar manner. This panel of receptors would then be cross-screened with an array of antagonists of varying potencies and from a broad range of chemical series, generating a matrix of SPR binding and kinetic data. In this way, it was hoped that a map of the binding site interactions would be generated that would be useful for structure-based design applications. Specifically, the binding data would be used to guide the selection of best poses from a set of in silico docked possibilities for each ligand; docking methods frequently find the correct pose for a ligand, but it can often be buried within a list of 5–10 poorly prioritized options. In the case of the A2A receptor, it would also later be possible to compare these results with crystallographic information. The following report details this series of studies on the A2A receptor and the interpretation of these data.
Results
Experimental Design/Selection of Mutants
At the time this work was initiated, there was no structural information available, and our understanding of ligand binding to the adenosine A2A receptor was based on in silico modeling using homology models derived from the stabilized β1-adrenergic receptor X-ray structure.7 The models were built with both Modeler20 and MOE,21 with manual adjustments of alignments where necessary. No attempt was made to completely build extra-cellular loop 2 (ECL2); only the residues between the top of transmembrane helix 5 (TM5) to the Cys166 involved in a disulfide bridge were modeled. Supporting both the model building and, critically, the docking of ligands was a large set of literature and in-house SDM data. Adenosine A2A has been the subject of a number of previous studies to characterize the binding of radioligands.22,23 Of particular note, Kim et al. have summarized SDM results for both adenosine A2A and A1 receptors and the effects of mutations on the binding of various ligands.23 By comparing these data with our model of the binding site, a list of residues likely to be directly involved in ligand binding was derived. The residues highlighted by Kim et al. as having a large effect on antagonist binding were V843.32, E151ECL2, E169ECL2, F1825.43, H2506.52, N2536.55, F2576.59, I2747.39, and H2787.43. Those residues thought to be involved in agonist binding and/or signaling were T883.36, S2777.42, and S2817.46. Residues reported as also having similar effects on antagonist or agonist binding for the adenosine A1 receptor were T913.36, H2516.52, N2546.55, T2777.42, and H2787.43. Of these residues, we considered V843.32, F1825.43, H2506.52, N2536.55, I2747.39, and H2787.43 to be inside the A2A antagonist binding pocket. Asn2536.55 was assigned as the key H-bonding motif likely to be critical to antagonist binding. Thr883.36 and Ser2777.42 were proposed to be located below the antagonist binding site and involved in agonist signaling.
[3H]ZM24138524 was the ligand used during the StaR thermostabilization process. During the generation of a StaR, large numbers of mutations to the receptor are introduced iteratively, and as well as determining which residues increase the thermal stability of the receptor, binding data was generated on mutations that affect the binding of the radioligand. The alanine scanning of the adenosine A2A receptor identified a selection of mutants that resulted in a loss of [3H]ZM241385 binding. These mutants provided a profile of the antagonist binding site. Levels of expression for these mutants were tested by Western blotting with only two mutants, M177A5.38 and N253A6.55, showing reduced levels of expression. The mutations L85A3.33, L167AECL2, I66A2.64, and N181A5.42 showed significantly reduced [3H]ZM241385 binding to below 20% of wild type levels, while retaining wild type levels of expression. Mutant Y271A7.36 bound [3H]ZM241385 at approximately 40% of wild type levels, while the mutants N253A6.55 and H278A7.43 showed almost a complete loss of [3H]ZM241385 binding at saturating ligand concentrations. The two mutants T88A3.36 and S277A7.42 proposed to be involved in agonist signaling (noted above) were found to be thermostabilizing as part of the inverse agonist complex and had unaltered [3H]ZM241385 binding.
The final set of mutations selected for the SPR studies were L85A3.33, L167AECL2, M177A5.38, N253A6.55, Y271A7.36, I66A2.64, N181A5.42, and S277A7.42. It was quickly identified that N253A6.55 was nonbinding for all compounds attempted; no ligands gave a signal with this mutated StaR, consistent with previous studies that suggest this residue has a critical role in ligand binding.22,23 However, despite evidence that the receptor did give low but sufficient expression for capture on the chip, it cannot absolutely be ruled out that nonbinding is instead due to the observed lower level of expression.
Interpretation of Data and Generation of Biophysical Maps
Table 1 summarizes the data collected for each SDM modified StaR versus a panel of 21 ligands. The log difference in binding affinity for each binding site mutant is given compared with the unaltered StaR. Figure 2 shows a representative set of SPR sensorgrams obtained with one of the compounds, ZM241385. Figure 3 presents the same data graphically to visualize the patterns characteristic of a particular compound series. ZM241385 and SCH420814 are furan containing aminoheterocyclic analogues, and the latter compound is in clinical trials for the treatment of PD.18 Istradefylline (KW6002), xanthine amine congener (XAC),25 caffeine, and theophylline are xanthine derivatives.26 KW600227 has also been studied in PD clinical trials. Compounds 1a–e, 2a–b, and 3a–h are from three distinct compound series for which medicinal chemistry optimization efforts have been undertaken in our laboratories. The chemical structures of analogues in series 1 and 3 are not disclosed here and will be the topic of future publications. However, these data are included to illustrate a number of aspects of the BPM technology.
Table 1. SPR Data for a Panel of mutated StaRs versus a Panel of Ligandsa.
| compound | pKi | pKD | L85A | L167A | M177A | Y271A | I66A | N181A | S277A |
|---|---|---|---|---|---|---|---|---|---|
| ZM241385 | 8.7 | 9.3 | –1.8 | 0 | –0.1 | –0.6 | –0.6 | –0.9 | –0.4 |
| SCH420814 | 8.8 | 9.5 | –2.3 | –1.0 | –0.9 | –0.9 | –1.0 | –1.2 | –0.9 |
| KW6002 | 6.7 | 5.9 | –1.1 | –0.2 | –0.3 | 0 | –0.2 | –0.3 | 0.7 |
| XAC | 7.6 | 7.7 | –0.3 | –0.1 | –0.2 | –0.5 | –0.9 | –0.4 | 0.3 |
| caffeine | 5.3 | 4.6 | –1.6 | 0.1 | nd | 0 | –1.6 | 0.6 | 0.7 |
| theophylline | <5 | 5.5 | –1.8 | 0 | nd | 0.1 | –0.1 | –0.4 | 0 |
| 1a | 8.5 | 7.3 | –1.3 | –0.1 | 0.1 | –0.7 | –0.7 | –0.3 | 0.3 |
| 1b | 7.6 | 5.9 | –2.9 | –0.1 | –0.3 | 0.1 | –0.5 | 0.1 | 0.3 |
| 1c | 7.5 | 5.9 | –0.8 | 0.1 | 0 | 0 | –0.7 | –0.3 | 0.2 |
| 1d | 6.5 | 6.1 | –0.8 | –0.5 | nd | –0.6 | –0.3 | –0.5 | 0.1 |
| 1e | 5.8 | 5.8 | –2.8 | –0.1 | –0.2 | –0.3 | –0.5 | –0.4 | 0 |
| 2a | 7.9 | 6.0 | –0.8 | –0.4 | nd | –0.5 | –0.7 | –0.5 | –0.6 |
| 2b | 9.0 | 7.9 | –0.9 | –0.4 | –0.3 | –0.1 | 0.1 | –0.2 | –1.0 |
| 3a | 7.8 | 6.7 | –1.1 | –0.1 | –0.6 | –0.8 | –1.1 | –1.3 | 1.0 |
| 3b | 8.9 | 8.9 | –0.8 | –0.1 | 0 | –0.3 | –0.5 | –0.5 | 0.3 |
| 3c | 8.2 | 8.5 | –0.7 | 0.1 | 0 | –0.3 | –0.4 | –0.7 | 0.8 |
| 3d | 8.1 | 8.2 | –0.8 | 0.1 | 0.1 | –0.3 | –0.3 | –0.6 | 0.9 |
| 3e | 7.9 | 8.2 | –0.8 | 0.1 | nd | –0.2 | –0.8 | 0.1 | 1.2 |
| 3f | 8.0 | 8.5 | –0.9 | 0.3 | 0.5 | –0.1 | –0.7 | –0.6 | 1.4 |
| 3g | 8.6 | 9.3 | –1.1 | –1.4 | –0.8 | –1.4 | –1.5 | –1.0 | 0.7 |
| 3h | 8.6 | 9.2 | –1.1 | –0.7 | –0.8 | –1.1 | –1.2 | –0.6 | 0.8 |
The SPR data for each mutated StaR is given as a log difference compared with the unaltered StaR background (pKD). The pKi value versus the wild type receptor is also given in the Table for each compound, as determined in a radioligand binding assay (using [3H]-ZM241385) for comparison. In most cases, the pKi and pKD values are very similar, and differences are likely due to the low solubility of certain ligands which, we have observed, can cause differences between the assays. nd = not determined (due to low signal). Errors in pKD difference values are typically ±0.1.
Figure 2.

Kinetics of ZM241385 binding to A2A StaR and seven binding site mutants as analyzed by SPR. The adenosine A2A StaR proteins were immobilized on NTA chips on a Biacore T200 instrument and a series of ligand concentrations (5–80 nM) injected in the single cycle format at 10 °C. The data were fitted to a 1:1 interaction model to generate KD values, and the data are presented in Table 1 and Figure 3.
Figure 3.

Effect of active site mutations on binding affinities of compounds representing five different chemical series. These data are a graphical representation of the data presented in Table 1 and show how different compound series have different fingerprints which map their interactions within the receptor binding site. On- and off-rates of ligands binding to the target receptors were also measured and indicated that SDM changes typically affect the off-rate rather than the on-rate (see Supporting Information).
First, it is clear that trends in the binding of all ligands independent of their chemotype or potency can be drawn from the data set. It is an important finding that these effects are not dependent on affinity and that quite weakly active molecules can be profiled and interrogated by this method. The most obvious feature is that L85A causes an average change in binding affinity by −1.3 log units relative to that of the unaltered StaR (StaR background). In comparison, L167A and M177A have on average only a small effect (−0.2 log units). Y271A, I66A, and N181A have, on average, an intermediate effect (−0.4, −0.7, and −0.5 log units, respectively). Interestingly, S277A, on average, causes an increase of 0.3 log units to ligand binding. Second, each chemotype has a distinct fingerprint, supporting the notion that different classes of ligands have, in fine detail, different binding modes in the site (Figure 3). For example, compounds in series 1 have a larger reduction in binding due to L85A and are affected by I66A, but other mutations have less of an effect on the binding of these molecules. In contrast, the binding of compounds in series 2 is affected to a similar extent by the majority of the SDM changes, suggesting a quite distinct binding mode compared to that of series 1. In series 3, where the most examples are presented, there is a fairly consistent trend across the data; L85A, Y271A, I66A, and N181A all reduce binding, and S277A causes an increase in binding, especially when compared to other series. These data were very informative in our optimization of series 3, which was proposed to bind very deeply in the bottom of the binding cavity, unusually forming interactions inside the adenosine ribose binding pocket adjacent to Ser277. Finally, in each series there is a definite structure–activity relationship (SAR) related to changes in chemical structure. This additional information was used to refine the binding of individual analogues and to suggest hypotheses for new compounds to be synthesized. However, we believe the power of the BPM method is in the SAR trends within the data for each series rather than any outliers. For example, compounds 3g and 3h seem to be more adversely affected by the SDM than closely related examples. It is likely that this is simply due to their very high affinity, whereupon optimal interactions can be readily disrupted, rather than any significant change in binding mode.
In addition to the determination of binding constants given in Table 1 and discussed above, data for on- and off-rates (kon and koff) for each compound against each mutant is generated by the SPR method. These data are presented in Supporting Information, Figure S2. Differences in binding affinity observed in the data are most often derived from changes in koff rather than kon. This is consistent with general observations for other systems. However, it can be noted that in some cases changes in kon were important, and in further cases, changes in kon and koff occur but cancel each other, meaning that overall affinity did not change. The data provided by the kon and koff values give additional insight into the energetics of binding of the various compound series and assist in generating models and hypotheses of the role of each binding site residue on molecular interactions.
Figure 4 illustrates the chemical structures of the first six molecules in Table 1. In each case, the residues mutated in the binding site are displayed around the ligand in their relative orientation according to a homology model we had developed before any crystal structure data was available. Ile66, Leu85, Met177, Asn181, and Leu167 are in front of the plane of the paper (bold), Ser277 and Tyr271 are behind the plane (italic), and Asn253 is in the plane. N253A6.55 is assumed to be nonbinding (NB in the figure) for all compounds based on literature SDM results and on binding experiments carried out on the first 4 compounds in Table 1, all of which gave no signal. The numbers shown below each residue label are the log difference in binding affinity relative to the background StaR, and the residue changes that had the largest effect on each ligand are highlighted with a black oval, the second largest effect by a dotted circle, and the third largest effect by a gray box. In cases where there is a similar effect (either positive or negative) for the first, second, or third tier of binding change, then more than one residue is highlighted.
Figure 4.

Representative BPM interpretation. Chemical structures of ZM241385, SCH420814, KW6002, caffeine, XAC, and theophylline annotated with the BPM data for each ligand in a cartoon representation based on a homology model of the A2A receptor. The residues shown were in each case mutated to Ala, and beneath the label is the log difference in binding for that compound. Residue labels are positioned to represent their position in the binding site and relative to the ligand. Residues labeled in bold are in front of the plane, in italics are behind the plane, and in normal font in the plane of the ligand. Asn253 is included in each case, and NB = nonbinding (see text). ND = not determined. The numbers below each residue label are the log difference in binding relative to the StaR background. The residue changes that had the largest effect on each ligand are highlighted with a black oval, second largest effect by a dotted circle, and third largest effect by a gray box. In cases where there is a similar effect (either positive or negative) for the 1st, 2nd, or 3rd tier of binding change, then more than one residue is highlighted.
Comparison of ZM241385 with SCH420814 indicates that each ligand interacts with the receptor in a similar way, as judged by the pattern of binding to the panel of mutant StaRs. In particular, the first and second tier effects are the same with the mutation of Leu85 and Asn181, respectively. Similarly, both compounds are affected by changes to Ile66 and Tyr271 to a similar extent; however, SCH420814 is equally affected by changes to the other residues in the panel. As noted earlier, very potent molecules seem to be more generally sensitive to any change in the binding site, and this is how these third tier effects could be interpreted for this compound. Alternatively, the larger tricyclic template and bulky phenylpiperazine substituent might be responsible for these changes. Overall, these data support that the furan moieties in these ligands bind in a pocket below Asn253 lined by Met177, Asn181, and Leu85, and we proposed key H-bond contacts with Asn253 to both the furan and the heterocyclic ring of these molecules. The other residues in the site have smaller or no effect on the binding of these furan containing analogues, suggesting no critical interactions with the ligands.
The four xanthine analogues display a more complex pattern of interactions within the binding site. Careful examination of the data seems to support a subtly different binding mode for the xanthine moiety of caffeine and of KW6002 as compared with that of theophylline and XAC. Caffeine has a methyl group on its imidazole ring that would prevent any H-bonding with Asn253 to that ring, while theophylline lacks this substituent, allowing for this possibility. A comparison of caffeine with theophylline shows effects on affinity in the first and second binding tier to Leu85 and Asn181, suggesting the ligands sit relatively deep in the bottom of the receptor, adjacent to Asn253. However, caffeine is affected by changes to Ser277 (+0.7 log) and Ile66 (−1.6 log), while theophylline shows no such effect. Theophylline therefore seems to be forming H-bonds to Asn253 with a positioning in the site close to Leu85 and Asn181, with no further key direct or indirect interactions with the other residues studied. Caffeine, in contrast, appears to sit further from Asn253, presumably forming a single H-bond to one carbonyl group and is apparently positioned closer to S277 (+0.7 log) and Ile66 (−1.6 log). Furthermore, comparison of caffeine with KW6002 (which is also N-methylated on the imidazole ring) shows a similar pattern of interactions with Leu85 and Ser277. This indicates a similar overall binding mode of the core fragment, but differences in the effects of Asn181 (−0.3 log) and Ile66 (−0.2 log), suggesting, in fine detail, a shift in the vector of the xanthine moiety or, perhaps more likely, an effect of the ethyl (versus methyl) substituents on the heterocyclic core. Finally, a comparison of theophylline with XAC suggests that XAC forms a number of new interactions with the receptor, but the data again overall suggests the molecule sits adjacent to Asn253 and accesses the residues lining the bottom of the pocket. The larger propyl substituents (as compared with methyl groups on theophylline) may account for the interaction with Ile66 (−0.9 log), which is diminished in the smaller derivative. The amide group in XAC appears to be positioned close to Tyr271 (−0.5 log) compared with the styryl group of KW6002 which appears to form no interactions with the residues on that face of the receptor (Tyr271, Leu167, and Ile66), again suggesting a subtly different vector in the presentation of these two molecules to the key H-bonding Asn253 residue.
Modeling of the Binding Modes of ZM241385 and XAC
Figure 5 illustrates the structures of ZM241385 and XAC bound to an adenosine A2A homology model optimized using the BPM data detailed above. Homology models were constructed from the β1 adrenoceptor crystal structure in the protein data bank (PDB; 2VT4),7 with manual readjustment and refinement based on known conserved GPCR motifs and SDM data (published and in-house, as discussed earlier). In Figure 5, the first, second, and third tier BPM effects described above and shown in Figure 4 are colored, along with Asn253, which is essential for the binding of ligands to the receptor. The two ligands share a significant portion of the A2A binding pocket in both position and interactions with residues lining the pocket. Both have π–π interactions with their central aromatic cores and Phe168 from ECL2, hydrophobic contacts with Leu249 and Met270 (not shown in the figure), and hydrogen bonding contact with Asn253. The interactions at the bottom of the pocket seen for ZM241385 are highlighted in Figure 5 as the most significant, designated as first and second tiers in the BPM experiments. Most important of these is the almost two log drop in activity for the L85A mutation. The Leu85 forms one side of the hydrophobic cavity into which the furan ring, known to be essential for ligand binding, sits. The furan also forms a key hydrogen bond with Asn253. Lastly in this region, the Asn181 forms part of the pocket where the furan ring binds and thus has an effect when mutated to Ala, as shown by the BPM in Table 1 and Figure 4.
Figure 5.

Docked structures of ZM241385 (left) and XAC (right) in an adenosine A2A receptor homology model. Asn253 is colored red as SDM of this residue prevents binding of the ligands (see text). The 1st, 2nd, and 3rd tier effects of mutations within the binding site are colored according to the key in the figure (also see text) and relate to those residues indicated in Figure 4 from the BPM experiments.
At the entrance to the binding site, the model has an open arrangement that allows stacking of the phenolic substituent of the ligand with Tyr271 in a cleft at the extracellular ends of helices 1, 2, and 7. This allows the second tier effect with Tyr271 to be accounted for in the binding pose with a sensible ligand conformation. This flexible part of the ligand was best accommodated by the solution presented here, and we rationalized that the pose was reasonable on the basis of the BPM data and previously published SDM and SAR data that suggested the importance of the substitution pattern of groups on the phenyl ring for potency and selectivity, suggestive of engagement of the side chain in a subpocket within the binding site.22,23,28,29
XAC and ZM241385 are overall proposed to sit similarly in the model, but there are some significant differences that affect the way they are positioned within the model of the A2A binding cavity. The most significant difference between the two inverse agonists is the interaction proposed for XAC with Ile66. One of the propyl chains traverses the width of the binding site where it makes a significant hydrophobic interaction within a lipophilic cavity in the binding site defined by Ile66, Ala63, Val84, and Ala81. ZM241385 does not access this lipophilic cavity, and mutation of Ile66 has a small effect on its binding. This significant hydrophobic interaction with Ile66 for XAC is therefore consistent with the marked decrease on binding seen with the mutation of Ile66 to Ala (reduced by almost 1 log unit). This major reduction in XAC’s affinity with the Ile66 to Ala mutation is designated as first tier in Figure 5. It was very interesting to us that the BPM highlighted this residue because all high scoring docking poses did not predict any interaction with this residue. In order to recapitulate the interactions the ligand is predicted to make from the biophysical map, it was necessary to rotate the carboxamide of the Asn253 in the model to better present the NH2 donor to the C6 carbonyl of the xanthine. This illustrates that docking of xanthine ligands such as XAC was very challenging without the additional information provided by the BPM experiments. This interaction with Ile66 may actually be as a result of the steric bulk present on the ligand from the second propyl substituent that serves to cause a rotation of the scaffold relative to ZM241385. This has the effect that XAC has only one H-bonding interaction with Asn253 and forms subtly different interactions with the residues that form the bottom of the binding site (Ser277, Leu85, Asn181, and Met177) compared with ZM241385. These interactions for XAC with the base of the binding site are third tier effects possibly because of the flexibility of this lipophilic propyl chain accessing this part of the binding site, allowing the ligand to adapt to SDM changes introduced in this region. In finalizing the proposed binding mode, we took into account that the S277A mutant actually increases binding of the ligand (shown as green in the figure), consistent with placement of the hydrophobic side chain in this region. Finally, when examining the BPM binding mode of XAC, at the top of the binding site the Tyr271 chi1 angle is in a trans conformation in the model where it is able to make a weak π–π stacking arrangement with the phenyl ring of XAC. This is consistent with the moderate (2nd tier) effect seen on the binding of XAC to the Y271A mutant with a drop of half a log in binding.
Interestingly, in a recent paper by Cheng et al. a binding mode for xanthines in adenosine A2A is proposed that has some similarity to our BPM guided pose.30 Cheng et al. also conclude that the xanthine ligands only form one H-bonding interaction with the Asn253 and that there is a significant interaction with Tyr271. However, as the xanthine ligands are docked into a published adenosine A2A crystal structure (PDB: 3EML) in which Tyr271 is in the gauche negative conformation the binding mode suggested here is not possible.30 This is because the top of the binding site is partially occluded in the position occupied by the substituted phenyl group. However, the binding pose of xanthines proposed by Cheng et al. in A2B is very similar to the results presented here because Y271 (A2A) is actually N273 (A2B), and thus, there is no residue obstructing this portion of the binding site.
The later publication of an adenosine A2A receptor structure in complex with ZM241385 allowed us to make a comparison of our biophysical map of this ligand with an X-ray crystal data set.8 The difference between the backbone rmsd of the homology model and the crystal structure is 2.78 Å over all residues included in the model. Most binding site residues within the TM region showed a high degree of similarity, as was also found by Ivanov et al. in another recent comparison of a model with this X-ray data.31 Within the binding site, there are small differences comparing the residues from the top of TM2, notably Ile66, being somewhat further away from Asn253 in our homology model compared to the crystal structure, perhaps helping to explain the importance of this residue (Table 1). Differences, not surprisingly, were also seen in residues emanating from the loops which are notoriously difficult to model, notably in the exact position of Phe168 on ECL2, which forms stacking interactions with the ligand in the site.11,32 However, the most important difference affecting the binding pose of the ligand ZM241385 between our model and the crystal structure (PDB: 3EML) was the chi1 angle of Tyr271. In the 3EML crystal structure, chi1 of Tyr271 is in a gauche negative rotameric state, compared to the trans conformation in our model, which causes the flexible phenolic portion of ZM241385 to sit in quite different positions comparing the two binding poses. This gauche negative rotameric state of Tyr271 chi1 serves to effectively block the channel between helices 2 and 7 where we proposed the flexible phenolic portion of ZM241385 might bind. While we also obtained docking poses that did place this portion of ZM241385 in a similar place to that seen for 3EML, these poses did not satisfy the BPM data that are presented here and thus were discarded. The BPM guided docking of ZM241385, however, did show a very similar placement of the central core with an approximately 10° clockwise rotation of our BPM guided pose relative to the 3EML model, resulting in a heavy atom rmsd of the central core of 1.78 Å. The most significant region of displacement was where the flexible phenolic portion joins onto the central core. Importantly, the B factor (or temperature factor, a crystallographic measure of disorder) of the flexible phenol group in the A2A crystal structure is high (>100 Å2) compared to the rest of the ligand (∼50), suggesting the position of this substituent should be interpreted with caution and may adopt more than one conformation.33 In our ongoing research, we were subsequently able to solve a crystal structure of an adenosine A2A-StaR with ZM241385 bound. Interestingly, this structure has Tyr271 positioned in a trans arrangement, different from its position in 3EML, that opens the binding cleft between helices 2 and 7 and is in a position similar to that in the homology model described in this article.34 In this structure, the flexible phenolic portion of ZM241385 does indeed bind within this cleft between helices 2 and 7, consistent with the results from the BPM study presented here and also with the SAR seen for this well explored series of compounds.28,35
In summary, the studies presented here show how a selection of binding site mutants can be made and SPR binding data subsequently generated for each mutant receptor against a panel of ligands with a broad range of potency and diverse chemistry. Interpretation of the binding modes of each chemical series and individual molecules within each series can be made using in silico docking against a homology model, itself refined and improved using the BPM data. Comparison of the binding modes suggested from the BPM matrix with subsequently solved receptor–ligand X-ray structures demonstrates the value of the approach, and the BPM data additionally serves to improve our understanding of the ligand interactions seen in the crystal structures.
Discussion
The BPM approach described here is an important link between computational (in silico) docking and X-ray structures of ligands bound to their receptor sites. In the absence of any X-ray crystal structure data, the information provided by the BPM of known ligands can be used to validate and improve homology models (including orientation of key binding site residues) and the way they are used to dock and score compounds. This potentially improves the ability of a given model to identify new ligands, such as via virtual screening of large databases of existing compounds, and also to predict the binding orientation of known ligands. Generating BPM data on a ligand of interest provides higher confidence in the binding pose/orientation predictions made by in silico docking and can lead to predictions of binding modes for compounds that are very close to the experimental binding mode observed when the X-ray crystal structure is ultimately obtained. This is not limited to fine tuning of known binding modes but can be used to correctly predict novel binding modes. For example, the compounds in series 3 (Table 1) were identified by virtual screening of our homology model of the adenosine A2A receptor, carefully refined and validated using SDM and BPM data. Furthermore, the BPM data and binding mode predictions were very useful to the project team, enabling the rapid optimization of the series and allowing identification of advanced lead molecules that have excellent drug-like properties and have led to the identification of a preclinical candidate for the treatment of PD. An important validation of the BPM method comes from later crystal structures of members of this series. The structures are highly consistent with the BPM data presented in this article and the binding mode derived from these data that was being used during the optimization of the compound series (unpublished results).
The choice of which residues are to be mutated during the BPM screening is a critical part of the process that is done by careful analysis of the 3D structure or homology model of the receptor together with potential ligand docking poses and any available SDM data. Mutations to cover all plausible binding modes are then considered, modulating the size or polarity of the residue in a way that is likely to give the most informative data. There are naturally limitations to the approach, most importantly that allosteric binding sites may not be predictable at the outset, such that no mutations are made to probe binding at that site. However, the lack of binding energy changes by mutations to the orthosteric binding site residues would at least inform that binding was occurring at an alternative site. An additional consideration is that if a mutation ablates binding for all compounds studied, then expression and protein immobilization on to the SPR chip need to be carefully examined. In the experiments presented here, all mutations in the panel were to alanine. In our ongoing BPM studies for other receptors, we now make multiple mutations for each key residue within the site such that we can identify mutations that affect but do not completely block ligand binding, aiding the interpretation of results.
An exciting approach to finding hits for targets of interest is fragment-based drug discovery (FBDD).36 In this approach, smaller compounds (fragments) are typically screened by a biophysical method that is able to identify small (molecular weight generally less than 250–300 Da), low affinity (high micromolar to low millimolar) compounds that are ligand efficient.37 Chemical elaboration of these fragments then enables the identification of compounds with good physicochemical properties and target selectivity. The important first step is to screen a relatively small library of fragment-size compounds and to identify compounds with a good (energetically favorable) fit to the binding site, and this can be done, for example, by SPR or NMR based screening using StaR proteins.38 This is in contrast to high throughput screening (HTS) whereby much larger hits are often obtained, with compounds that can be making suboptimal interactions with the protein. Many interesting new binding motifs can be rapidly identified by the fragment-based approach. The utility of the BPM technology is thus potentially not limited to lead-sized potent molecules but due to the ability of the SPR screening approach to detect very weak binders can be used to provide structure-based design in the critical fragment to hit/lead stage. The BPM data enables characterization of where fragments are binding, distinguishing between orthosteric or other (allosteric) site binders, being used to screen panels of analogues in a SAR by catalogue approach or by guiding the synthesis of derivatives. This capability is very important to enable structure-based design for fragment hits before an X-ray structure can be obtained, as computational docking approaches are poor at providing high confidence poses for small compounds, generally giving several plausible possibilities. The data for caffeine and theophylline described in this article are examples of fragments binding to a GPCR, and the BPM method allowed the binding modes of these molecules to be predicted in a mode largely consistent with medium resolution X-ray structures of these compounds and of the larger analogue, XAC, that have subsequently been solved in our laboratories.34 One consideration is that in some cases a small fragment might still bind with similar affinity to a mutant receptor due to a significant compensating change in its binding mode; however, this situation would be expected to be uncommon.
In conclusion, the matrix of direct binding information provided by the BPM approach provides early access to quality experimental data that allows better prediction of correct ligand binding poses and quantifies the effects on binding of changing residues around the binding site. Structure-based design for a receptor target is thus greatly enabled by having a more accurate binding pose, using experimental information. Additionally, an understanding of the relative importance of different interactions with binding site residues, given by the BPM approach, can be used to guide design in a SAR program. Coupled with the advances in homology modeling made possible by new GPCR structures becoming available, enhanced by improved force fields (taking more account of polarization, etc.), increased desktop computational power, and new in silico methods for improving docking predictions, the BPM method has great potential to support virtual and fragment hit identification campaigns and empower SBDD for lead optimization. Without the BPM data on our adenosine A2A antagonist lead compounds, it would not have been possible to use SBDD methods with confidence until much later in the project, when X-ray structures with our ligands became available.
Experimental Section
Materials
The A2AR receptor StaR used as the background is a thermostabilized mutant previously known as RANT21,13 which includes the following thermostabilized mutations: A54L2.52, T88A3.36, K122A4.43, and V239A6.41 and was used as the background for the additional site-directed mutagenesis. [3H]-ZM241385 was supplied by American Radiochemicals (USA). Ni-nitroltriacetic acid (Ni-NTA) agarose was obtained from Qiagen (UK). All detergents were from Anatrace, Affymetrix (USA). Transient transfection reagent Genejuice was supplied by Merck Biosciences (USA).
Mutagenesis
Mutants were generated by PCR using the KOD PCR system (Merck Biosciences, USA) and the expression plasmid as template. PCRs were transformed into DH5α ultracompetent cells prepared according to the Inoue method, and individual clones were fully sequenced to check that only the desired mutation was present. Different mutations were combined by PCR as described above and sequenced to check plasmid integrity and desired mutations.
Protein Expression
HEK-293T mammalian cells were used to express adenosine A2A and its mutants. Briefly, HEK293T cell cultures in 10 cm cell culture plates at 50% confluency (4.5 × 10⁶ cells) were transiently transfected with 6 μg of plasmid and left to grow in DMEM (Lonza) supplemented with 10% fetal bovine serum (Sigma) at 37 °C and 5% CO2. Cells were harvested 40 h later by dissociation into phosphate buffer saline (Sigma) and pelleted at 600g for 5 min (aliquots of 2 mL), and stored at −20 °C.
Radioligand Binding
Competition binding studies were incubated in buffer containing 50 mM Tris-HCl (pH 7.4) in a final volume of 0.25 mL with 10 × 0.5 log unit dilutions of test compounds and a final [3H]-ZM241385 concentration of 0.5 nM. After incubation for 90 min at room temperature, assays were terminated by rapid filtration through 96-well GF/B UniFilter plates presoaked with 0.1% PEI followed by washing with 5 × 0.25 mL of ddH2O. Plates were dried, 50 μL of Ultima Gold-F added per well, and bound ligand measured using a Packard Microbeta counter. Data were normalized as % specific binding followed by fitting according to a four parameter logistic fit to determine pIC50; this was converted to pKi using the KD value generated from saturation binding studies.
Determination of Protein Concentration
The protein concentration was determined using a detergent-compatible Bradford assay (BioRad).
Chemical Compounds
SCH420814 and KW6002 were synthesized by Jubilant Chemsys Ltd. (India), according to published procedures. Their purities were determined by LCMS and were found to be >95%.
1H NMR spectra of these compounds were recorded at 400 MHz on a Jeol instrument. Chemical shift values are expressed in parts per million, i.e., δ values. The following abbreviations are used for the multiplicities of the NMR signals: s = singlet, d = doublet, t = triplet, q = quartet, dd = doublet of doublets, and m = multiplet. Coupling constants are listed as J values, measured in Hz.
LCMS analysis of these compounds was performed by Jubilant Chemsys Ltd. under the following conditions: column, Aquity BEH C-18, 1.7 μm, 2.1 × 100 mm; column temperature = 30 °C; and flow rate = 0.3 mL/min. Gradient [time (min·s)/solvent B in A (%)]: 0.00/90, 1.00/90, 2.00/85, 4.30/45, 6.00/10, 8.00/10, 9.0/10, 10.00/10 (solvent A = acetonitrile; solvent B = 5 mM aqueous ammonium acetate).
KW600239
(8-[(E)-2-(3,4-Dimethoxyphenyl)vinyl]-1,3-diethyl-7-methyl-3,7-dihydro-1H-purine-2,6-dione) 1H NMR (400 MHz, DMSO-d6) δ: 7.58 (d, J = 15.80 Hz, 1H), 7.39 (d, J = 1.83 Hz, 1H), 7.27 (dd, J = 1.72, 8.36 Hz, 1H), 7.18 (d, J = 15.80 Hz, 1H), 6.95 (d, J = 8.47 Hz, 1H), 4.03 (q, J = 7.10 Hz, 2H), 3.99 (s, 3H), 3.88 (q, J = 7.10 Hz, 2H), 3.81 (s, 3H), 3.76 (s, 3H), 1.22 (t, J = 7.10 Hz, 3H), 1.09 (t, J = 6.98 Hz, 3H). LCMS 5.95 min, 97.92% purity (UV); m/z 385.23 (ES+).
SCH42081440
(2-(Furan-2-yl)-7-[2-[4-[4-(2-methoxyethoxy)phenyl]piperazin-1-yl]ethyl]-7H-pyrazolo[4,3-e][1,2,4]triazolo[1,5-c]pyrimidin-5-amine) 1H NMR (400 MHz, DMSO-d6) δ: 8.09 - 8.16 (m, 1H), 7.99 - 8.07 (broad s, 2H), 7.86 - 7.94 (m, 1H), 7.16 - 7.23 (m, 1H), 6.78 - 6.83 (m, 2H), 6.74 - 6.78 (m, 2H), 6.67 - 6.73 (m, 1H), 4.31 - 4.43 (m, 2H), 3.89 - 3.99 (m, 2H), 3.53 - 3.62 (m, 2H), 3.25 (s, 3H), 2.87 - 2.98 (m, 4H), 2.76 - 2.83 (m, 2H), 2.52 - 2.60 (m, 4H). LCMS 5.13 min, 95.04% purity (UV); m/z 504.45 (ES+).
ZM241385 (4-(2-(7-Amino-2-(furan-2-yl)-[1,2,4]triazolo[1,5-a][1,3,5]triazin-5-ylamino)ethyl)phenol; Tocris Cookson), XAC (N-(2-aminoethyl)-2-[4-(2,3,6,7-tetrahydro-2,6-dioxo-1,3-dipropyl-1H-purin-8-yl)phenoxy]-acetamide; Sigma Aldrich), caffeine (Sigma Aldrich) and theophylline (Sigma Aldrich) are commercially available.
LCMS analysis of these commercial samples was performed at Heptares under the following conditions: instrument, Waters Alliance 2795, Waters 2996 PDA detector, Micromass ZQ. Column: Phenomenex Gemini-NX C-18, 3 μm, 2.0 × 30 mm. Gradient [time (min)/solvent B in A (%)]: 0.00/2, 0.10/2, 8.40/95, 9.40/95, 9.50/2, 10.00/2 (solvent A = 1.58 g ammonium formate in 2.5 L of water + 2.7 mL of 28% aqueous ammonia solution; solvent B = 2.5 L of acetonitrile +132 mL of solvent A + 2.7 mL of 28% aqueous ammonia solution). Injection volume, 5 μL; UV detection, 230 to 400 nM; column temperature, 45 °C; and flow rate = 1.5 mL/min. The LCMS purity was found to be >95% in all cases.
LCMS results for commercial samples (retention time, UV purity, observed ion in ES+ mode): ZM241385 (2.42 min, >95%, m/z 336.3), XAC (1.83 min, >95%, m/z 429.3), caffeine (1.07 min, >95%, m/z 194.9), and theophylline (0.13 min, >95%, m/z 181.0).
SPR Analysis
SPR analysis was carried out at 10 °C on Biacore T100 and Biacore T200 instruments using sensor chip NTA (GE Healthcare). PBS was used as running buffer with 0.1% dodecylmaltoside, 0.05 mM EDTA, and 5% DMSO, pH 7.4. To solubilize the adenosine A2A receptor from the membranes of HEK-293T cells, the pelleted membranes were mixed with an equal volume of ice-cold 40 mM Tris-HCl and 3% decylmaltoside, pH 7.4, and homogenized in a Dounce homogenizer. The mixture was centrifuged (13200 rpm, 5 min) and the pellet discarded. The supernatant was supplied with 5 mM imidazole and injected over a nickel-loaded NTA chip (1 μL/min, 10 min) to capture the His-tagged receptor. The capture levels of the wild type and mutant receptors varied in the range of 4000–10000 resonance units (RU). To assay the receptor ligands for the affinity and kinetics of their interaction with the receptor, 2-fold dilution series (five concentrations) were prepared and injected in either multi- or single-cycle format. The actual concentrations as well as contact and dissociation times varied between the ligands depending on the kinetics and affinity of interaction. The data were generally fitted to the 1:1 interaction model. Some low-affinity ligands, which needed to be assayed at higher concentrations, exhibited a distinct secondary interaction component. This secondary interaction was characterized by low affinity and was often superstoichiometric. In cases with significant contribution of the secondary component, the data were fitted to the two-site interaction model, and only the primary, high affinity, component was taken into consideration. Binding constants were compared with affinities measured by radioligand binding (the above method and Table 1), and compounds that performed poorly due to solubility issues were discarded from the screen.
Computational Chemistry
Homology models were constructed from the avian β1 adrenergic GPCR crystal structure bound to cyanopindolol (PDB: 2VT4).7,41 Owing to the relatively low percentage identity between the two proteins (25% overall, less than 20% around the ligand binding site), two initial homology models of the adenosine A2A receptor were generated, using different methods. This provided a means to assess consistency in the alignments, the variability within the built structures, and which regions of the models had lower confidence associated with them. One model was constructed using Modeler,20 while the other was constructed using MOE,21 with manual readjustment of the clustalW alignment where necessary.42 The alignment in each case was checked to ensure consistency with known GPCR conserved motifs43 and particularly the conserved disulfide bond, common to family A GPCRs, which is located between the top of helix 3 and the extracellular loop 2. The model generated via MOE was selected for further optimization as the Phe168 residue, implicated in antagonist binding, was in closer proximity to the other residues highlighted from literature SDM.
Initial validation and improvement of the homology models was conducted with ZM241385, due to the wealth of SAR for this series and the amount of SDM data available for the ligand at the adenosine A2A receptor. The induced-fit docking protocol was used within Maestro with an autogenerated box size around the residues highlighted by in-house and external SDM as having a large effect on antagonist binding, namely, I662.64, V843.32, L853.33, E151ECL2, L167ECL2, E169ECL2, N1815.42, F1825.43, H2506.52, N2536.55, F2576.59, Y2717.36, I2747.39, and H2787.43. The resultant docking solutions in combination with the binding data from the thermostabilization experiments were then used to select the in-house round of mutants for our biophysical mapping experiments. These mutations were chosen so as to confirm or rule out differing possible binding orientations within the A2A receptor.
The final docking experiments were guided by ligand SAR and our iterative process of assessing SDM and then designing our own BPM mutants to confirm or rule out possible binding modes. The protein preparation and docking experiments were done within the Schrodinger Maestro package.44 The grid generation necessary for docking was done within Glide. The residues highlighted in SDM experiments (in-house and external) were used to define the cavity of the grid; however, no constraints were added in the grid generation to ensure that subsequent dockings were not biased in any way. Glide XP docking was carried out on all of the ligands in question with 10 poses per ligand being stored. The poses were then assessed against the biophysical mapping data (Table 1) and the best solution identified.
Acknowledgments
The authors thank Edward Hurrell for generating the radioligand binding data, Chris Richardson and Bissan Al-Lazikani for help with constructing the first generation of homology models, and David Myszka for helping to establish conditions for the use of A2A StaRs on the Biacore format as a precursor to the work in this manuscript.
Glossary
Abbreviations Used
- StaR
stabilized receptor
- BPM
biophysical mapping
- GPCR
G protein-coupled receptor
- SPR
surface plasmon resonance
- SDM
site-directed mutagenesis
- XAC
xanthine amine congener
- PD
Parkinson’s disease
- ECL
extra-cellular loop
- TM
transmembrane helix
- SAR
structure–activity relationship
- PDB
protein data bank
- FBDD
fragment-based drug discovery
The authors are employees of Heptares Therapeutics Ltd. who are engaged in GPCR structure based drug discovery.
Supporting Information Available
Representative SPR sensograms for three compound series, representative binding data and rate constants for ZM241385 and three compound series, information for compound series 1 and 3, and experimental details for series 2. This material is available free of charge via the Internet at http://pubs.acs.org.
Supplementary Material
References
- Palczewski K.; Kumasaka T.; Hori T.; Behnke C. A.; Motoshima H.; Fox B. A.; Le Trong I.; Teller D. C.; Okada T.; Stenkamp R. E.; Yamamoto M.; Miyano M. Crystal structure of rhodopsin: A G protein-coupled receptor. Science 2000, 289, 739–745. [DOI] [PubMed] [Google Scholar]
- Patny A.; Desai P. V.; Avery M. A. Homology modeling of G-protein-coupled receptors and implications in drug design. Curr. Med. Chem. 2006, 13, 1667–1691. [DOI] [PubMed] [Google Scholar]
- Li Y. Y.; Hou T. J.; Goddard W. A. III. Computational modeling of structure-function of G protein-coupled receptors with applications for drug design. Curr. Med. Chem. 2010, 17 (12), 1167–1180. [DOI] [PubMed] [Google Scholar]
- Rasmussen S. G.; Choi H.; Rosenbaum D. M.; Thian F.; Kobilka T.; Edwards P. C.; Burghammer M.; Ratnala V. R. P.; Sanishvili R.; Fischetti R. F.; Schertler G. F. X.; Weis W. I.; Kobilka B. K. Crystal structure of the human β2 adrenergic G-protein-coupled receptor. Nature 2007, 450, 383–387. [DOI] [PubMed] [Google Scholar]
- Cherezov V.; Rosenbaum D. M.; Hanson M. A.; Rasmussen S. G. F.; Thian F.; Kobilka T.; Choi H; Kuhn P.; Weis W. I.; Kobilka B. K.; Stevens R. C.; Takeda S.; Kadowaki S.; Haga T.; Takaesu H.; Mitaku S.; Fredriksson R.; Lagerstrom M. C.; Lundin L. G.; Schioth H. B.; Pierce K. L.; Premont R. T.; Lefkowitz R. J.; Lefkowitz R. J.; Shenoy S. K. High-resolution crystal structure of an engineered human β2 adrenergic G protein-coupled receptor. Science 2007, 318, 1258–1265. [DOI] [PMC free article] [PubMed] [Google Scholar]
- Xu F.; Wu H.; Katritch V.; Han G. W.; Jacobson K. A.; Gao Z.; Cherezov V.; Stevens R. C. Structure of an agonist-bound human A2A adenosine receptor. Science 2011, 332, 322–327. [DOI] [PMC free article] [PubMed] [Google Scholar]
- Warne T.; Serrano-Vega M. J.; Baker J. G.; Moukhametzianov R.; Edwards P. C.; Henderson R.; Leslie A. G. W.; Tate C. G.; Schertler G. F. X. Structure of a β1-adrenergic G-protein-coupled receptor. Nature 2008, 454, 486–491. [DOI] [PMC free article] [PubMed] [Google Scholar]
- Jaakola V. P.; Griffith M. T.; Hanson M. A.; Cherezov V.; Chien E. Y. T.; Lane J. R.; IJzerman A. P.; Stevens R. C. The 2.6 angstrom crystal structure of a human A2A adenosine receptor bound to an antagonist. Science 2008, 322, 1211–1217. [DOI] [PMC free article] [PubMed] [Google Scholar]
- Wu B.; Chien E. Y. T.; Mol C. D.; Fenalti G.; Liu W.; Katritch V.; Abagyan R.; Brooun A.; Wells P.; Bi F. C.; Hamel D. J.; Kuhn P.; Handel T. M.; Cherezov V.; Stevens R. C. Structures of the CXCR4 chemokine GPCR with small-molecule and cyclic peptide antagonists. Science 2010, 330, 1066–1071. [DOI] [PMC free article] [PubMed] [Google Scholar]
- Chien E. Y.; Liu W.; Zhao Q.; Katritch V.; Won Han G.; Hanson M. A.; Shi L.; Newman A. H.; Javitch J. A.; Cherezov V.; Stevens R. C. Structure of the human dopamine D3 receptor in complex with a D2/D3 selective antagonist. Science 2010, 330, 1091–1095. [DOI] [PMC free article] [PubMed] [Google Scholar]
- Garland S.; Blaney F.. GPCR Homology Model Development and Application. In Burger’s Medicinal Chemistry, Drug Discovery and Development, 7th ed.; John Wiley and Sons, Inc.: New York, 2010; pp 279–300. [Google Scholar]
- Serrano-Vega M. J.; Magnani F.; Shibata Y; Tate C. G. Conformational thermostabilization of the β1-adrenergic receptor in a detergent-resistant form. Proc. Natl. Acad. Sci. U.S.A. 2008, 105, 877–882. [DOI] [PMC free article] [PubMed] [Google Scholar]
- Magnani F.; Shibata Y.; Serrano-Vega M. J.; Tate C. G. Co-evolving stability and conformational homogeneity of the human adenosine A2A receptor. Proc. Natl. Acad. Sci. U.S.A. 2008, 105, 10744–10749. [DOI] [PMC free article] [PubMed] [Google Scholar]
- Shibata Y.; White J. F.; Serrano-Vega M. J.; Magnani F.; Aloia A. L.; Grisshammer R.; Tate C. G. Thermostabilization of the neurotensin receptor NTS1. J. Mol. Biol. 2009, 390, 262–277. [DOI] [PMC free article] [PubMed] [Google Scholar]
- Robertson N.; Jazayeri A.; Errey J.; Baig A.; Hurrell E.; Zhukov A.; Langmead C. J.; Weir M.; Marshall F. H. The properties of thermostabilised G protein-coupled receptors (StaRs) and their use in drug discovery. Neuropharmacology 2011, 60, 36–44. [DOI] [PubMed] [Google Scholar]
- Ballesteros J. A.; Weinstein H.; Stuart C. S. In Methods in Neurosciences; Academic Press: New York, 1995; Vol. 25, pp 366–428. [Google Scholar]
- Shah U.; Hodgson R. Recent progress in the discovery of adenosine A2A receptor antagonists for the treatment of Parkinson’s disease. Curr. Opin. Drug Discovery Dev. 2010, 13, 466–480. [PubMed] [Google Scholar]
- Salamone J. D. Preladenant, a novel adenosine A2A receptor antagonist for the potential treatment of parkinsonism and other disorders. IDrugs 2010, 13, 723–731. [PubMed] [Google Scholar]
- Chen J. F.; Sonsalla P. K.; Pedata F.; Melani A.; Domenici M. R.; Popoli P.; Geiger J.; Lopes L. V.; de Mendonca A. Adenosine A2A receptors and brain injury: broad spectrum of neuroprotection, multifaceted actions and “fine tuning” modulation. Prog. Neurobiol. 2007, 83, 310–331. [DOI] [PubMed] [Google Scholar]
- Šali A.; Blundell T. L. Comparative protein modeling by satisfaction of spatial restraints. J. Mol. Biol. 1993, 234, 779–815. [DOI] [PubMed] [Google Scholar]
- Molecular Operating Environment (MOE 2008.10); Chemical Computing Group, Inc.: Montreal, Quebec, Canada, 2008. www.chemcomp.com.
- Dal Ben D.; Lambertucci C.; Marucci G.; Volpini R.; Cristalli G. Adenosine receptor modeling: What does the A2A crystal structure tell us?. Curr. Top. Med. Chem. 2010, 93, 993–1018. [DOI] [PubMed] [Google Scholar]
- Kim S. K.; Gao Z.; Van Rompaey P.; Gross A. S.; Chen A.; Van Calenbergh S.; Jacobson K. A. Modeling the adenosine receptors: comparison of the binding domains of A2A agonists and antagonists. J. Med. Chem. 2003, 46, 4847–4859. [DOI] [PMC free article] [PubMed] [Google Scholar]
- Uustare A.; Vonk A.; Terasmaa A.; Fuxe K.; Rinken A. Kinetic and functional properties of [3H]ZM241385, a high affinity antagonist for adenosine A2A receptors. Life Sci. 2005, 76, 1513–1526. [DOI] [PubMed] [Google Scholar]
- Jacobson K. A.; Ukena D.; Kirk K. L.; Daly J. W. [3H]xanthine amine congener of 1,3-dipropyl-8-phenylxanthine: an antagonist radioligand for adenosine receptors. Proc. Natl. Acad. Sci. U.S.A. 1986, 83, 4089–4093. [DOI] [PMC free article] [PubMed] [Google Scholar]
- Daly J. W. Alkylxanthines as research tools. J. Auton. Nerv. Syst. 2000, 81, 44–52. [DOI] [PubMed] [Google Scholar]
- Jenner P. Istradefylline, a novel adenosine A2A receptor antagonist, for the treatment of Parkinson’s disease. Expert Opin. Invest. Drugs 2005, 14, 729–738. [DOI] [PubMed] [Google Scholar]
- Baraldi P. G.; Cacciari B.; Romagnoli R.; Spalluto G.; Monopoli A.; Ongini E.; Varani K.; Borea P. A. 7-Substituted 5-Amino-2-(2-furyl)pyrazolo[4,3-e]-1,2,4-triazolo[1,5-c]pyrimidines as A2A adenosine receptor antagonists: A study on the importance of modifications at the side chain on the activity and solubility. J. Med. Chem. 2002, 45, 115–126. [DOI] [PubMed] [Google Scholar]
- Jaakola V. P.; Lane J. R.; Lin J. Y.; Katritch V.; Ijzerman A. P.; Stevens R. C. Ligand binding and subtype selectivity of the human A2A adenosine receptor: identification and characterization of essential amino acid residues. J. Biol. Chem. 2010, 285 (17), 13032–13044. [DOI] [PMC free article] [PubMed] [Google Scholar]
- Cheng F.; Xu Z.; Liu G.; YunTang Y. Insights into binding modes of adenosine A2B antagonists with ligand-based and receptor-based methods. Eur. J. Med. Chem. 2010, 45, 3459–3471. [DOI] [PubMed] [Google Scholar]
- Ivanov A. A.; Barak D.; Jacobson K. A. J. Med. Chem. 2009, 52, 3284–3292. [DOI] [PMC free article] [PubMed] [Google Scholar]
- Barton N.; Blaney F. E.; Garland S.; Tehan B.; Wall I. Seven transmembrane G protein-coupled receptors: insights for drug design from structure and modeling. Comp. Med. Chem. II 2007, 4, 669–701. [Google Scholar]
- Katritch V.; Rueda M.; Lam P. C.; Yeager M.; Abagyan R. GPCR 3D homology models for ligand screening: lessons learned from blind predictions of adenosine A2a receptor complex. Proteins 2010, 78 (1), 197–211. [DOI] [PMC free article] [PubMed] [Google Scholar]
- Doré A. S.; Robertson N.; Errey J. C.; Ng I.; Hollenstein K.; Tehan B.; Hurrell E.; Bennet K.; Congreve M.; Magnani F.; Tate C. G.; Weir M.; Marshall F. H.. Structure of the adenosine A2A receptor in complex with ZM241385 and the xanthines XAC and caffeine. Structure 2011, in press. [DOI] [PMC free article] [PubMed]
- de Zwart M.; Vollinga R. C.; Beukers M. W.; Sleegers D. F.; Von Frijtag Drabbe Kunzel J. K.; De Groote M.; Ijzerman A. P. Potent antagonists for the human adenosine A2B receptor. Derivatives of the triazolotriazine adenosine receptor antagonist ZM241385 with high affinity. Drug Dev. Res. 1999, 48, 95–103. [Google Scholar]
- Congreve M.; Chessari G.; Tisi D.; Woodhead A. J. Recent developments in fragment-based drug discovery. J. Med. Chem. 2008, 51, 3661–3680. [DOI] [PubMed] [Google Scholar]
- Hopkins A. L.; Groom C. R.; Alex A. Ligand efficiency: a useful metric for lead selection. Drug Discovery Today 2004, 9, 430–431. [DOI] [PubMed] [Google Scholar]
- Congreve M; Rich R. L.; Myszka D. G.; Figaroa F.; Siegal G.; Marshall F. H. Fragment screening of stabilised G protein-coupled receptors using biophysical mapping. Methods Enzymol. 2011, 493, 115–134. [DOI] [PubMed] [Google Scholar]
- Hockemeyer J.; Burbiel J. C.; Müller C. E. Multigram-scale syntheses, stability, and photoreactions of A2A adenosine receptor antagonists with 8-styrylxanthine structure: Potential drugs for Parkinson’s disease. J. Org. Chem. 2004, 69, 3308–3318. [DOI] [PubMed] [Google Scholar]
- Neustadt B. R; Hao J.; Lindo N.; Greenlee W. J.; Stamford A. W.; Tulshian D.; Ongini E.; Hunter J.; Monopoli A.; Bertorelli R.; Foster C.; Arik L.; Lachowicz J.; Nga K.; Feng K. Potent, selective, and orally active adenosine A2A receptor antagonists: Arylpiperazine derivatives of pyrazolo[4,3-e]-1,2,4-triazolo[1,5-c]pyrimidines. Bioorg. Med. Chem. Lett. 2007, 17, 1376–1380. [DOI] [PubMed] [Google Scholar]
- Berman H. M; Westbrook J.; Feng Z.; Gilliland G.; Bhat T. N.; Weissig H.; Shindyalov I. N.; Bourne P. E. The Protein Data Bank. Nucleic Acids Res. 2000, 28, 235–242. [DOI] [PMC free article] [PubMed] [Google Scholar]
- Thompson J. D.; Higgins D. G.; Gibson T. J. CLUSTAL W: improving the sensitivity of progressive multiple sequence alignment through sequence weighting, position-specific gap penalties and weight matrix choice. Nucleic Acids Res. 1994, 22, 4673–4680. [DOI] [PMC free article] [PubMed] [Google Scholar]
- Mirzadegan T.; Benko G. Sequence analyses of G-protein coupled receptor: Similarities to rhodopsin. Biochemistry 2003, 42 (10), 2759–2767. [DOI] [PMC free article] [PubMed] [Google Scholar]
- Maestro, version 9.1; Schrödinger, LLC: New York.
Associated Data
This section collects any data citations, data availability statements, or supplementary materials included in this article.