

Abstract
Bioaccumulation and biotransformation are key toxicokinetic processes that modify toxicity of chemicals and sensitivity of organisms. Bioaccumulation kinetics vary greatly among organisms and chemicals; thus, we investigated the influence of biotransformation kinetics on bioaccumulation in a model aquatic invertebrate using fifteen 14C-labeled organic xenobiotics from diverse chemical classes and physicochemical properties (1,2,3-trichlorobenzene, imidacloprid, 4,6-dinitro-o-cresol, ethylacrylate, malathion, chlorpyrifos, aldicarb, carbofuran, carbaryl, 2,4-dichlorophenol, 2,4,5-trichlorophenol, pentachlorophenol, 4-nitrobenzyl-chloride, 2,4-dichloroaniline, and sea-nine (4,5-dichloro-2-octyl-3-isothiazolone)). We detected and identified metabolites using HPLC with UV and radio-detection as well as high resolution mass spectrometry (LTQ-Orbitrap). Kinetics of uptake, biotransformation, and elimination of parent compounds and metabolites were modeled with a first-order one-compartment model. Bioaccumulation factors were calculated for parent compounds and metabolite enrichment factors for metabolites. Out of 19 detected metabolites, we identified seven by standards or accurate mass measurements and two via pathway analysis and analogies to other compounds. 1,2,3-Trichlorobenzene, imidacloprid, and 4,6-dinitro-o-cresol were not biotransformed. Dietary uptake contributed little to overall uptake. Differentiation between parent and metabolites increased accuracy of bioaccumulation parameters compared to total 14C measurements. Biotransformation dominated toxicokinetics and strongly affected internal concentrations of parent compounds and metabolites. Many metabolites reached higher internal concentrations than their parents, characterized by large metabolite enrichment factors.
Introduction
Background
Organic micropollutants such as pesticides will only cause detrimental effects to organisms if they are taken up by the organism and can reach a target site where they can do harm.1,2 The processes of uptake, biotransformation, and elimination, also termed bioaccumulation or toxicokinetics, modify the concentration of organic chemicals in organisms, and kinetic rate constant models of these processes quantify and yield the time course of internal concentrations.3−5 Bioaccumulation and biotransformation are key factors modifying toxicity,6−8 and bioaccumulation itself is one of the assessment end points in risk assessment of chemicals.9
Bioaccumulation based on total radioactivity measurements of 14C-labeled compounds varies greatly among species10 and compounds,11 but the causes remain partially unresolved because the contribution of biotransformation cannot be quantified with these methods. Biotransformation in freshwater arthropods has been shown to greatly modify internal concentrations of organic chemicals for various biological species and chemical compounds.12−17 However, there are no studies that investigate the uptake, biotransformation, and elimination kinetics of larger sets of chemicals (n > 4) with diverse properties in freshwater invertebrates.
Objectives and Study Design
In this study, we investigated the uptake, biotransformation, and elimination kinetics of 15 organic chemicals from diverse chemical classes and physicochemical properties (octanol–water partition coefficient log Kow from 0.33 to 5.18, including acids and bases) that exhibit a wide range of modes of toxic action in the freshwater amphipod Gammarus pulex. G. pulex are of ecological importance due to their role as shredders in the detritus processing in streams, are used extensively in ecotoxicological research,18−20 and are suitable for bioaccumulation studies due to their slow growth and relatively large size.11,21 In a previous study of bioaccumulation kinetics in G. pulex, several organic compounds exhibited unexpectedly slow apparent elimination kinetics, but the cause of these could not be elucidated because only total radioactivity of 14C-labeled compounds was measured and biotransformation was not investigated.11
In order to understand the role of biotransformation for the kinetics of bioaccumulation, we measured and modeled not only the uptake and elimination of the parent compounds but also biotransformation and, if applicable, tried to identify the biotransformation products (metabolites). We carried out metabolite screening and identification tests with a 24 h exposure period as well as biotransformation kinetics experiments consisting of a 24 h uptake phase followed by a depuration phase of variable length (adapted from refs (11, 17, 21, and 22)). Further, toxicokinetic rate constant models were parametrized for each compound to facilitate process-based modeling of toxicity.22−25 Kinetic rate constants were derived for all relevant processes: uptake, biotransformation, and elimination of parent compound as well as formation and elimination of the metabolites. The uptake and elimination rate constants comprise uptake via food, respiratory surfaces, and dermal absorption and elimination via excretion and through respiratory or dermal surfaces; i.e., we measured and modeled bioaccumulation sensu Mackay and Fraser.4 The terms metabolism, xenobiotic metabolism, or biotransformation have been used to describe the biochemical modification and transformation of chemicals in an organism. In the following, we will use the term biotransformation for the process, because it emphasizes the transformation aspect and cannot be confused with energy metabolism in organisms. For the biotransformation products, however, we use the more conventional term metabolites.
Experimental Methods
Organisms
Adult G. pulex were collected during 2008 to 2010 from a small headwater stream in the Itziker Ried, ca. 20 km southeast of Zürich, Switzerland (E 702150, N 2360850), and acclimatized to the test conditions (13 °C, 12 h:12 h light/dark) for at least 3 days prior to experiments. Experiments generally followed previous studies’ conditions11,22 and were carried out in beakers with 500 mL of preaerated artificial pond water,26 where organisms were fed ad libitum with horse-chestnut leaf discs (20 mm diameter, 3 to 5 discs per beaker, replaced when necessary) that were inoculated with Cladosporium herbarum.26
Chemicals
Experiments were carried out with 14C-labeled compounds (see Table 1 for compounds and log Kow values, Figures 1–4 for positions of the 14C-label, and the Supporting Information, Text SI-1, for further details).
Table 1. Parent Compounds (P) and Metabolites (M1, M2 and M3) As Well As Metabolite Enrichment Factors (MEFs) for Metabolites and Bioaccumulation Factors (BAFs) for Parent Compounds.
| parent compound (CAS number) |
log Kowa and pKa values [-] | molecules (in order of increasing
retention time for each compound) |
method of detection and identification | MEF or BAF [L/kgwet weight] |
|---|---|---|---|---|
| imidacloprid (CAS 138261-41-3) |
0.33 (pKa = 11.12) | no metabolites detected | Radio-HPLC | BAFP = 7f |
| ethylacrylate (CAS 140-88-5) |
1.32 | no metabolites detectedd | Radio-HPLC | BAFP = 87f |
| 4,6-dinitro-o-cresol (CAS 534-52-1) |
2.22 (pKa = 4.46) | no metabolites detected | Radio-HPLC | BAFP = 37f |
| 1,2,3-trichlorobenzene (CAS 87-61-6) |
4.05 | no metabolites detected | Radio-HPLC | BAFP = 191f |
| malathion (121-75-5) |
2.36 | M1: not identified | Radio-HPLC | MEFM1 = 5 |
| P: malathion + malaoxone | HPLC-radio/UV | BAFP = 3 | ||
| chlorpyrifos (CAS 2921-88-2) |
4.96 | M1: not identified | Radio-HPLC | MEFM1 = 492 |
| M2: chlorpyrifos-oxon | HPLC-radio/UV | MEFM2 = 183 | ||
| P: chlorpyrifos | HPLC-radio/UV | BAFP = 412 | ||
| aldicarb (CAS 116-06-3) |
1.13 | M1: aldicarb-sulfone | HPLC-radio/UV | MEFM1 = 0.3 |
| P: aldicarb | HPLC-radio/UV | BAFP = 0.9 | ||
| carbofuran (CAS 1563-66-2) |
2.32 | M1: hydroxy-carbofuran | HPLC-radio/UV | MEFM1 = 69 |
| P: carbofuran | HPLC-radio/UV | BAFP = 0.7 | ||
| carbaryl (CAS 63-25-2) |
2.36 | M1: naphtol-sulfate | Radio-HPLC, Orbitrap | MEFM1 = 153 |
| P: carbaryl + naphtolc | HPLC-radio/UV | BAFP = 4 | ||
| 2,4-dichlorophenol (CAS 120-83-2) |
3.17 (pKa = 7.97) | M1: 2,4-dichlorophenol-sulfateb | Radio-HPLC, Orbitrap | MEFM1 = 195 |
| M2: not identified | Radio-HPLC | MEFM2 = 14 | ||
| P: 2,4-dichlorophenol | HPLC-radio/UV | BAFP = 4 | ||
| 2,4,5-trichlorophenol (CAS 95-95-4) |
3.72 (pKa = 6.94) | M1: 2,4,5-trichlorophenol-sulfate | Radio-HPLC, Orbitrap | MEFM1 = 1454 |
| M2: not identified | Radio-HPLC | MEFM2 = 109 | ||
| P: 2,4,5-trichlorophenol | HPLC-radio/UV | BAFP = 82 | ||
| pentachlorophenol (CAS 87-86-5) |
5.18 (pKa = 4.72) | M1: not identified | Radio-HPLC | MEFM1 = 318 |
| P: pentachlorophenol | Radio-HPLC | BAFP = 202 | ||
| 4-nitrobenzyl-chloride (CAS 100-14-1) |
2.61 | M1: not identified | Radio-HPLC | MEFM1 = 15 |
| M2: 4-nitrobenzyl-alcohol | HPLC-radio/UV | MEFM2 = 50 | ||
| M3: not identified | Radio-HPLC | MEFM3 = 87 | ||
| P: 4-nitrobenzyl-chloride | HPLC-radio/UV | BAFP = 5 | ||
| 2,4-dichloroaniline (CAS 554-00-7) |
2.78 | M1: not identified | Radio-HPLC | MEFM1 = 58 |
| M2: not identified | Radio-HPLC | MEFM2 = 22 | ||
| P: 2,4-dichloroaniline | HPLC-radio/UV | BAFP = 29 | ||
| sea-nine (CAS 64359-81-5) |
2.8 | M1: not identified | Radio-HPLC | MEFM1 = 35 |
| M2: not identified | Radio-HPLC | MEFM2 = 316 | ||
| P: sea-nine | Radio-HPLC | BAFP = 272 | ||
| M3: not identified | Radio-HPLC | MEFM3 = 37 |
Experimental log KOW values from Sangster’s database37 and from Jacobson and Williams38 for sea-nine. For 4-nitrobenzyl-chloride, no experimental value was available; thus, we calculated it with the EPI suite KowWin software (http://epa.gov/oppt/exposure/pubs/episuite.htm). The pKa values were also taken from Sangster’s database (http://logkow.cisti.nrc.ca/logkow/).
Sulfate must be metabolite 1 because orbitrap likely detected the largest peak only.
Peaks of carbaryl and naphtol cannot be separated; naphtol was likely formed during sample preparation.
Ethylacrylate reacts with methanol during sample preparation (spiked samples). We did not observe any peaks of potential biotransformation products that were distinguishable from the artifact peaks of this adduct.
The peaks of malathion and malaoxon could not be clearly separated in the biotransformation kinetics experiment. Both peaks also come closely after each other in the HPLC-UV chromatogram.
Bioaccumulation factors for compounds that were not biotransformed are taken from ref (11).
Figure 1.

Molecular structures and label positions of compounds that are not biotransformed in Gammarus pulex (a) or where biotransformation could not be quantified (b).
Figure 4.

Molecular structures, label positions, exposure concentration (left), bioaccumulation, biotransformation, and elimination kinetics (right, transfer to fresh media indicated by dashed line) and model structure (middle) for 4-nitrobenzyl-chloride, sea-nine, and 2,4-dichloroaniline.
Metabolite Screening Experiments
Metabolite screening experiments were carried out for each test chemical separately. Adult G. pulex were exposed to 14C radio-labeled compounds for 24 h and then sampled, blotted dry, weighed, and frozen in glass vials at −20 °C until analysis. In each experiment, four organisms composed one sample (in one vial) and four samples per experiment were taken (16 organisms total). Two of those four samples were later pooled for carbofuran and malathion to raise the limit of detection, because exposure to those two compounds had to be at very low concentrations due to their toxicity. For all other compounds, the four samples were analyzed separately. Experimental details can be found in the Text SI-2 and Table S1, Supporting Information.
Biotransformation Kinetics Experiments
For those compounds, which showed biotransformation in the metabolite screening experiments (Table 1), we carried out biotransformation kinetics experiments (design adapted from ref (22), details in Text SI-3, Supporting Information). Organisms were exposed to 14C radio-labeled compounds for 24 h and then removed from the test solution, rinsed, and transferred to fresh media. Eight replicate beakers of 500 mL of preaerated artificial pond water and one solvent control beaker each contained 10, 15, or 20 adult G. pulex (see Table S2, Supporting Information), depending on the length of the depuration phase. The length of the depuration phase depended on the previously measured elimination times for total radioactivity.11 During the experiment, the concentration of the parent compound and its metabolite(s) in the organisms were quantified. One organism was sampled from each beaker at each time and blotted dry, and four organisms from different beakers were combined in one glass vial, weighed, and frozen at −20 °C until analysis. Compounds with slow elimination11 required more sampling time points, hence, the different numbers of organisms per beaker. Each beaker also contained five leaf discs as food and shelter, which were renewed during the depuration phase if needed. G. pulex were sampled frequently throughout the experiment (see Figures 2 to 4 and data file in Supporting Information for timing). Immediately after dosing (time 0 h) and at each sampling time, we also sampled 1 mL of test solution to quantify exposure concentrations. Initial exposure concentrations were chosen so that organisms would not be strongly affected by toxic effects, while still being close enough to toxic levels to be meaningful for toxicity modeling purposes22 and maximizing the limit of quantification for internal concentrations of parent compounds and biotransformation products (see Text SI-3, Supporting Information, for more details).
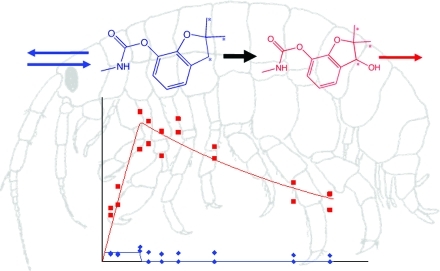
Figure 2.

Molecular structures, label positions, exposure concentration (left), bioaccumulation, biotransformation, and elimination kinetics (right, transfer to fresh media indicated by dashed line) and model structure (middle) for malathion, chlorpyrifos, aldicarb, carbofuran, and carbaryl.
Quantification of Aqueous Concentrations
Concentrations of the test compounds in the exposure medium were quantified by liquid scintillation counting (LSC, see Text SI-4, Supporting Information, for details).
Quantification of Parent Compound and Metabolites in Organisms
Samples were ground with a glass rod, while methanol was added to extract the compounds. Then, filtered samples were concentrated to about 1 mL using a GeneVac (EZ-2 PLUS, Genevac, UK) and under nitrogen flow to 90 μL. Subsequently, 210 μL of distilled water were added to obtain a ratio of 30/70 (v/v) methanol to water. Subsequently, samples were split: 100 μL were analyzed by LSC and another 100 μL were analyzed by High-Performance Liquid Chromatography (HPLC, HP 1100, Agilent) with a radio-detector (500 TR, Packard) to quantify amounts of parent compound and metabolites (details in Text SI-5, Supporting Information).
Blank organism samples were spiked with a known amount of parent compound at the beginning of the extraction method. Comparison of the spiked radioactivity with the radioactivity measured by LSC yielded recovery of the extraction steps and comparison with the radioactivity measured on the HPLC yields overall recovery (Table S1, Supporting Information).
Identification of Metabolites in Organisms
Known metabolites as well as the parent compound were identified by spiking unlabeled standard material of these to samples of control organisms during the grinding step and identification of these peaks via UV-detection. Peaks with corresponding retention times in chromatograms of the UV-detector and the radio-detector were assumed to originate from identical compounds. In case no reference standards were available or biotransformation products were unknown, extracts were analyzed after HPLC separation and electrospray ionization in either positive or negative mode with high resolution mass spectrometry using a LTQ-Orbitrap (Thermo, Waltham, MA). The analytical method was adopted from a method for ultratrace level screening of organic micropollutants.27 Data-dependent MS/MS acquisition was triggered at masses of possible transformation products and the most intensive masses. Screening for possible metabolites was carried out either by extracting the high-resolution, full-scan MS data at the exact mass of known metabolites from literature or by postacquisition data processing using the MetWorks software (Thermo, Waltham, MA). With this software, we predicted the masses of possible metabolites produced by phase I and phase II reactions and compared high-resolution, full-scan MS data from the G. pulex control and the treatment extract to identify the metabolite masses that occur only in the treatment (or only to a much higher extent). Candidate metabolites identified by this procedure were confirmed or rejected following manual extraction of the respective 14C-masses from full-scan chromatograms as well as interpretation of MS and MS/MS spectra if available (comparison of peak shape and relative intensities of 12C and 14C peaks of parent and metabolite). Extracts of 1,2,3-trichlorobenzene, imidacloprid, and 4,6-dinitro-o-cresol, for which no or minor biotransformation was found, as well as malathion and chlorpyrifos, for which the known oxon-metabolites could be purchased, were not analyzed with HPLC-MS. See Text SI-6, Supporting Information, for further details on metabolite identification.
Data Analysis and Modeling
Modeling Bioaccumulation and Biotransformation Kinetics
Model Structure
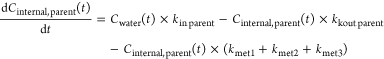
Compounds that are not subject to biotransformation (Figure 1) can be modeled with a simple one-compartment model.11 The structures of the toxicokinetic models for compounds that are subject to biotransformation are shown in Figures 2–4, and metabolites are labeled M1, M2, and M3. We do not differentiate between passive4 and active28 uptake and elimination mechanisms, but assume, as an approximation, first-order kinetics for all toxicokinetic processes and that biotransformation products were formed from parent compounds in separate, independent pathways. The model structure differs depending on the number of metabolites:
 |
1 |
| 2 |
| 3 |
| 4 |
where Cinternal, parent(t) is the time course of the concentration of parent compound in G. pulex [nmol kg wet weight–1], Cwater(t) is the time course of parent compound in the medium [nmol L–1], kin_parent is the uptake rate constant for parent compound [L kg wet weight–1 d–1], kout_parent is the elimination rate constant for parent compound [d–1], kmet1, kmet2, and kmet3 are the biotransformation rate constants for biotransformation of parent compound to metabolites M1, M2, and M3, respectively, [d–1], Cinternal, M1(t), Cinternal, M2(t), and Cinternal, M3(t) are the time courses of the concentrations of metabolites M1, M2, and M3 in G. pulex, respectively, [nmol kg wet weight–1], and kloss_M1, kloss_M2, and kloss_M3 are the elimination rate constants of the metabolites M1, M2, and M3, respectively, [d–1]. The elimination rate constants of the metabolites represent direct elimination or elimination after further biotransformation. For compounds with only one or two metabolites, the model reduces to eqs 1 and 2 or eqs 1 to 3, respectively. The biotransformation rate constants kmet2 and kmet3 or only kmet3 are then zero.
Parameter Estimation
Model parameter values, constrained to positive values, were found by least-squares minimization (Levenberg–Marquardt algorithm) without weighting of data. Asymptotic standard errors of parameters were derived from the covariance matrix followed by calculation of confidence intervals.29 All parameters of a given compound were fitted simultaneously, except for carbaryl and 4-nitro-benzyl-chloride where the uptake rate constant needed to be kept fixed at the value from a previous study11 in order to achieve a good fit. Simulations and parameter estimation were carried out in ModelMaker (v4.0, Cherwell Scientific Ltd., Oxford, UK).
Metabolite Enrichment Factors
Metabolite enrichment factors (MEFs) were calculated by fixing the aqueous concentration of the parent at a constant concentration of 1 nmol/L and running the model for 730 days, the maximum life-span of G. pulex, which is beyond the time to approach steady-state for all compounds here.11 Thus, in steady-state, the MEF of metabolite i is defined as the ratio of the internal concentration of the metabolite Cinternal, Mi [nmol kg wet weight–1] to the external concentration of the parent Cwater, parent [nmol L–1]:
| 5 |
where MEFMi is the metabolite enrichment factor of metabolite i, [L kg wet weight–1]. The same method was used to calculate the corresponding factors for the parent compounds, which in this case are bioaccumulation factors (BAFparent) because the organisms were fed during the experiments. The total bioaccumulation of parent and metabolites is described by
| 6 |
where BAFtotal, [L kg wet weight–1], is equal to the apparent bioaccumulation factor that is measured by quantifying internal concentrations as total 14C-radioactivity.10,11
Results and Discussion
Metabolite Identification with LC High Resolution MS and Its Limitations
The parent compounds 4-nitrobenzyl-chloride, sea-nine, ethylacrylate, and aldicarb were not detected in the LC-MS analysis even after purification of the extracts by solid phase extraction. This can be explained by insufficient ionization, low sensitivity, or interference with the G. pulex matrix and, in case of 4-nitrobenzylchloride, sea-nine and ethylacrylate also by rapid hydrolysis of these reactive electrophiles. Since metabolites usually show similar behavior during electrospray ionization and MS detection as their parent compounds, we did not screen for metabolites in those extracts.
Furthermore, some metabolites were likely not detected, because of their low molecular weight, because they are not easily ionized, and because the matrix of the G. pulex extract prevented detection in the LC-MS analysis. In some cases, new masses were detected in G. pulex samples, but these masses could not be assigned with certainty to a possible metabolite of phase I or phase II reactions.
Contribution of Dietary Uptake
We measured the concentrations of the chemicals adsorbed to the leaf discs that were used for feeding the test organisms and approximated the dietary uptake of the chemicals by calculating the intake via food using the feeding rate and assimilation efficiency (see Text-SI 7, Supporting Information, for details). The assumptions needed for modeling dietary uptake, such as the assimilation efficiency, are highly uncertain; thus, the dietary uptake data needs to be interpreted with caution. The percentage of dietary uptake of total uptake was less than 1% for ten out of twelve compounds (Table S7, Supporting Information). The exceptions, carbaryl and malathion (8% and 9%, respectively), can be explained with the fixed uptake rate constant for carbaryl and the zero elimination rate (leading to a relatively small uptake rate) for malathion. Overall, it appears that dietary uptake contributed much less than uptake via water in our bioaccumulation experiments. Thus, the bioaccumulation factors measured here could also be viewed as bioconcentration factors.
Compounds That Are Not Biotransformed
No biotransformation products were found in G. pulex for 1,2,3-trichlorobenzene and imidacloprid using HPLC with radiodetector (Figure 1, Table 1). In one out of four samples of 4,6-dinitro-o-cresol, we detected a small peak (4% of total radioactivity), which we considered negligible. In case of ethylacrylate, parent compound and possible metabolites could not be distinguished or identified because these compounds are not stable during extraction and analysis (Text SI-8, Supporting Information), also indicated by very low recovery (Table S1, Supporting Information). Bioaccumulation kinetics of the three nonmetabolized compounds (1,2,3-trichlorobenzene, imidacloprid, 4,6-dinitro-o-cresol) and ethylacrylate are assumed to be well captured by toxicokinetic studies based on total radioactivity. Thus, previously measured rate-constants11 and the corresponding one-compartment model characterize toxicokinetics of these compounds. Note, that for the insecticide imidacloprid this means that the very slow elimination measured previously11 (time for 95% elimination >11 d) must be interpreted as accumulation of the parent and could lead to carry-over toxicity from repeated pulsed exposure.
Organothiophosphates
We observed oxidative desulfuration of chlorpyrifos to chlorpyrifos-oxon, a common pathway in aquatic organisms.30,31 Previously, we found that G. pulex biotransformed diazinon to 2-isopropyl-6-methyl-4-pyrimidinol and a major metabolite of chlorpyrifos in fish and other species is 3,5,6-trichloro-2-pyridinol;31 however, this cannot be our M1, because the label positions of chlorpyrifos (Figure 2) are such that 3,5,6-trichloro-2-pyridinol would not be radioactive. Thus, it is likely that the M1 of chlorpyrifos is the hydrolyzed ester of chlorpyrifos, but we could not confirm that with standards or accurate mass measurements.
We could not clearly separate the peaks of malathion and malaoxon. Also, if the kinetics of malaoxon formation and elimination are similar to those of chlorpyrifos-oxon (Figure 2) and diazoxon,22 then the malaoxon concentrations would be close to the limit of quantification. Hydrolysis of malathion would result in the metabolite M1 being one or both of the malathion monoacids, the dicarboxylic acid or the carboxylic acid esters, although further possible metabolites have been found in insects and fish.31
Carbamates
We could identify the metabolite of each carbamate (Table 1, Figure 2). For carbaryl, the sulfate conjugate of the transformation product naphtol was tentatively identified by the exact mass of the molecular ion (Δm: 0.9 ppm), the 14C-isotope (Δm: 3.1 ppm), naphthol as specific fragment in the MS/MS spectrum, and the retention time (1.3 min less than carbaryl). The oxidation product of carbofuran, hydroxy-carbofuran was identified with radio-HPLC. Oxidation of carbofuran to hydroxy-carbofuran has also been found in various species,30,31 and hydrolysis of carbaryl to 1-naphtol and subsequent conjugation to napthol-sulfate is also a very common pathway in a range of organisms.30,31 Using radio-HPLC,we identified aldicarb-sulfone. Like hydroxy-carbofuran, this is the product of a phase I reaction, whereas naphtol-sulfate is the product of phase I and subsequent phase II reaction of carbaryl.
Chlorinated Phenols
Biotransformation of the chlorinated phenols resulted in sulfate conjugates after phase II reactions directly from the parent molecule (Table 1, Figure 3). In case of 2,4-dichlorophenol and 2,4,5-trichlorophenol but not for PCP, the sulfate conjugate could be tentatively identified as metabolites in G. pulex. Identification was based on detecting the exact mass of the molecular ion (Δm: 0.8 ppm (DCP), 1.8 ppm (TCP)), the pattern of the mass spectrum with 14C and 37Cl isotopes, and the occurrence of di- and trichlorophenol as a specific fragment of the sulfate conjugate in the MS/MS spectrum (Δm: 3 ppm (DCP), 1.5 ppm (TCP)) as well as a shorter retention time compared to the parent compound (2 min (DCP) and 3.5 min (TCP) less). M1 is likely the PCP-sulfate, based on the retention time of M1 and the fact that the two other chlorinated phenols were sulfate conjugated, although it could not be identified, presumably because the concentration was below the limit of detection of the orbitrap.
Figure 3.

Molecular structures, label positions, exposure concentration (left), bioaccumulation, biotransformation, and elimination kinetics (right, transfer to fresh media indicated by dashed line) and model structure (middle) for 2,4-dichlorophenol, 2,4,5-trichlorophenol, and pentachlorophenol.
Other Chlorinated Compounds
Sea-nine and 4-nitrobenzyl-chloride had three biotransformation products each, and 2,4-dichloroaniline had one (Table 1, Figure 4). We identified M2 of 4-nitrobenzyl-chloride as the alcohol, and on the basis of retention times and possible pathways, M3 very likely is the conjugate even though we could not confirm that with standards or accurate mass measurements. We could not identify the metabolites of sea-nine and 2,4-dichloroaniline.
Biotransformation Pathways
We observed products of phase I reactions (aldicarb-sulfone, chlorpyrifos-oxon, hydroxy-carbofuran), the products of phase I and subsequent phase II reactions (naphtol-sulfate) and products of phase II reactions directly from the parent molecule (2,4-dichlorophenol-sulfate, 2,4,5-trichlorophenol-sulfate, 4-nitrobenzyl-alcohol, 4-nitrobenzyl-conjugate, and pentachlorophenol-conjugate). Generally, biotransformation in G. pulex appears to follow similar routes as in other aquatic organisms.31,32 Conjugation with sulfate was observed for three compounds (naphtol-sulfate, 2,4-dichlorophenol-sulfate, 2,4,5-trichlorophenol-sulfate) and seems to be a dominant phase II pathway in G. pulex.
Uncertainties Related to Measurement of Aqueous Concentrations
Quantification of aqueous concentrations yields a combined measure of parent compound and any metabolite in the water. We assumed that degradation of the parent compounds in the water during the one day exposure phase was negligible and that reuptake of metabolites excreted by the organisms during the exposure phase is negligible because the ratio of water to organisms is very large. Radioactivity in the water during the depuration phase can consist of parent compound and metabolites that were excreted by the organisms. We simplify and assume that the radioactivity in the water represents the parent compound and only model uptake of the parent. This assumption is justified because (a) the radioactivity levels were very small compared to the exposure phase and (b) we did not observe raised levels of radioactivity during the depuration phase for aldicarb, carbofuran, carbaryl, and 2,4-dichloroaniline ruling out the possibility for reuptake of metabolites (Figures 2 and 4). Slightly increasing levels of radioactivity during the depuration phase were observed for malathion, chlorpyrifos, 4-nitrobenzyl-chloride, and sea-nine (Figures 2 and 4). However, reuptake of metabolites from water can also be neglected for these compounds because the radioactivity levels were very small compared to the exposure phase (<10%). Furthermore, some proportion of that radioactivity can also be attributed to the parent compound because measured internal concentrations indicate that a mix of parent and metabolites would be excreted into the water (Figures 2 and 4). The chlorinated phenols (Figure 3) exhibited raised levels of radioactivity during the depuration phase. For pentachlorophenol, approximately half of that radioactivity can be attributed to the parent assuming a similar ratio between parent and metabolite as for the internal concentrations, thus reducing the potential error by not including reuptake of metabolites into model equations. For 2,4-dichlorophenol and 2,4,5-trichlorophenol, our method is likely to overestimate parent concentrations in the water phase and thus underestimate uptake rates. Therefore, these uptake rates must be considered uncertain, even more so as other factors cause large confidence intervals of the uptake rate constants for these two compounds (explanation below).
Model Uncertainties
Some compounds, in particular carbofuran, 2,4-dichlorophenol, and 2,4,5-trichlorophenol, exhibit large confidence intervals for their uptake and elimination rate constants. These large confidence intervals can be explained by very fast uptake so that steady-state concentrations were reached fast and experimental values did not capture well the shape of the internal concentration curve. Thus, the data contained insufficient information to narrow down the confidence intervals for the corresponding model parameters. Further, there is systematic uncertainty in the model because we had to assume that all metabolites were directly formed from their parents. Of course, alternative pathways are possible but cannot be inferred from our data.
Bioaccumulation, Biotransformation, and Elimination Kinetics
The time course of internal concentrations of the parent compounds and their biotransformation in G. pulex can be simulated for any exposure pattern, including pulsed or fluctuating exposures using the models and parameter values derived in this study (Table 2). Toxicokinetics of compounds without biotransformation could be simulated with the model and parameter values from our previous study,11 because in those cases all the radioactivity in the organism can be attributed to the parent compound. In addition, the parameter values can be used to compare among chemicals to find those that are more or less susceptible to biotransformation. However, the parameter values must be interpreted with care, especially those of carbaryl and 4-nitrobenzyl-chloride, where the uptake rate constants were kept fixed to previously measured values as well as the parameters of malathion, pentachlorophenol, chlorpyrifos, 2,4,5-trichlorophenol, and sea-nine, where the elimination rate constant of the parent compound converged to its lower boundary zero (Table 2). Nevertheless, we conclude that biotransformation of xenobiotics in G. pulex occurs for a wide range of compounds and results in a variety of metabolites and the kinetics differ widely among compounds (first-order biotransformation rate constants range from 0.13 to 44 d–1, Table 2).
Table 2. Uptake, Elimination, and Biotransformation Rate Constants with 95% Confidence Intervals (CI)a.
| parent |
M1 |
M2 |
M3 |
|||||
|---|---|---|---|---|---|---|---|---|
| compound (n = # of internal concentration data points, df = degrees of freedom)b |
kin_parent [95% CI] L × kg–1 × d–1 |
kout_parent [95% CI] d–1 |
kmet1 [95% CI] d–1 |
kloss_M1 [95% CI] d–1 |
kmet2 [95% CI] d–1 |
kloss_M2 [95% CI] d–1 |
kmet3 [95% CI] d–1 |
kloss_M3 [95% CI] d–1 |
| aldicarb (n = 28, df = 24) |
9.86 [6.8; 12.9] |
9.31 [5.1; 13.6] |
2.05 [0.8; 3.3] |
6.19 [2.3; 10.0] |
||||
| carbofuran (n = 36, df = 32) |
4930 [0; 595904] |
7063 [0; 878858] |
16.22 [0; 32.6] |
0.16 [0.12; 0.20] |
||||
| carbaryl (n = 40, df = 37) |
23.4 [n.a.]c |
2.258 [1.4; 3.1] |
3.36 [2.4; 4.4] |
0.09 [0.05; 0.13] |
||||
| malathion (n = 36, df = 32) |
8.86 [4.4; 13.3] |
0 [0; 3.1] |
2.99 [1.1; 4.9] |
1.91 [0.5; 3.3] |
||||
| pentachlorophenol (n = 40, df = 36) |
646 [143; 1149] |
0 [0; 5.5] |
3.19 [0; 6.7] |
2.03 [0; 4.6] |
||||
| chlorpyrifos (n = 45, df = 39) |
1499 [1072; 1926] |
0 [0; 2.4] |
3.50 [1.9; 5.1] |
2.93 [1.5; 4.4] |
0.132 [0; 0.4] |
0.298 [0; 1.8] |
||
| 2,4-dichloroaniline (n = 42, df = 36) |
293 [82; 504] |
8.23 [0.4; 16.0] |
0.949 [0.6; 1.3] |
0.478 [0.05; 0.90] |
0.799 [0.2; 1.4] |
1.07 [0; 2.2] |
||
| 2,4-dichlorophenol (n = 60, df = 54) |
723 [0; 6343] |
153 [0; 1478] |
19.62 [0; 43] |
0.413 [0.34; 0.49] |
3.17 [0; 8.2] |
0.911 [0; 2.3] |
||
| 2,4,5-trichlorophenol (n = 54, df = 48) |
1389 [0; 4073] |
0 [0; 36] |
14.52 [1.1; 28.0] |
0.822 [0.42; 1.23] |
2.35 [0; 9.7] |
1.78 [0; 9] |
||
| 4-nitrobenzyl-chloride (n = 56, df = 49) |
576 [n.a.]c |
31.23 [0; 90] |
0.86 [0; 4.2] |
0.278 [0; 3.4] |
42.5 [0; 111] |
4.13 [2.2; 6.1] |
44.3 [0; 115] |
2.46 [1.8; 3.2] |
| sea-nine (n = 80, df = 72) |
345 [295; 395] |
0 [0; 1.1] |
0.349 [0; 1.2] |
2.70 [0; 9.8] |
0.623 [0.5; 0.8] |
0.536 [0.34; 0.73] |
0.299 [0; 0.9] |
2.18 [0; 7.4] |
Confidence intervals extending below zero were truncated at zero.
The raw data used for modeling is available as Supporting Information.
The uptake rate constants kin for carbaryl and 4-nitrobenzyl-chloride were kept fixed to previously measured values.11
Comparison with Total 14C Rate Constants
Comparison of rate constants and BAFtotal derived in this study (eq 6) with those from our previous study11 based on total 14C measurements was undertaken for ten compounds where biotransformation occurred (carbofuran and 2,4-dichlorophenol were excluded because of large uncertainty; diazinon was added from another study22). The uptake rate is independent of biotransformation, which is confirmed by good agreement between the uptake rate constants derived with both experimental methods (Figure 5a, excluding data for carbaryl and 4-nitrobenzyl-chloride, see Supporting Information). The variability of 1 order of magnitude is due to interexperimental variability, different amounts of data in the two studies, and possible influences of elimination and biotransformation on the fitted uptake rates in this study because all parameters were fitted simultaneously.
Figure 5.

Correlation of rate constants (top) and bioaccumulation factors (bottom) from studies based on total 14C internal concentrations (y-axis) compared to this study where metabolites were measured and modeled explicitly (x-axis).
The elimination rates (parent compounds from this study) fell into two groups (Figure 5b). One group contains compounds, which were biotransformed very fast and had a negligible elimination rate in this study, but had very different elimination rates in the total 14C-based study,11 because there the elimination rate reflects elimination of the biotransformation products. Thus, total 14C-studies overestimate parent compound elimination, unless elimination is explicitly defined as the sum of parent and biotransformation products. The second group contains those compounds where the elimination rate differs from zero. Here, parameter values from the total 14C-based study11 are consistently lower. That means elimination in the total 14C-based study is slower than in this study, because there metabolites are also counted toward internal concentrations and the sum of parent and metabolites in the organism declines slower than the parent alone.
When apparent bioaccumulation factors from a study based on total 14C internal concentrations (i.e., BAFtotal values) are compared to the BAFtotal values from this study, i.e., the sum of BAFparent and MEFs for each compound, they correlate and scatter around the line of unity (Figure 5c, text SI-9, Supporting Information). In the study based on total 14C internal concentrations, the metabolites are also counted toward total radioactivity. Approximating BAFparent values with apparent bioaccumulation factors from a total 14C-study11 (i.e., BAFtotal values) consistently overestimates BAFparent values, with the exception of pentachlorophenol (Figure 5d, see also Table S8 and text SI-9, Supporting Information).
Metabolite Enrichment
We calculated MEFs (eq 5) for the metabolites and compared them to the BAFs of their parent compounds (Table 1). For all compounds with biotransformation, except aldicarb, the BAF of the parent was smaller than the MEF of one or more of its metabolites, illustrating that biotransformation products generally achieve larger internal concentrations in G. pulex than the parent compounds. Note, however, that further metabolites may have been formed with smaller bioaccumulation factors, but we would not have detected those. Other studies with crustaceans also found higher internal concentrations of some metabolites than the respective parent compounds, for example, in Daphnia magna,12,33,34Hyalella azteca,17Gammarus fossarum,16 and Gammarus pulex.22 Together with our result that 14 out of 19 MEFs are larger than the BAFs of their parent compounds, there is enough evidence to suggest that field biomonitoring studies using crustaceans may also need to look for metabolites and confirms that assessment of toxic effects may need to include metabolites.
Significance of Xenobiotic Metabolism for Bioaccumulation
Out of the 19 metabolites that we observed in the radio-chromatograms, we could only identify seven with standards or accurate mass measurements. The MEFs of 14 metabolites were larger than the BAFs of their parents, indicating that metabolites could be found more often in field biomonitoring studies than their parent compounds, if they are being looked for. We found that biotransformation dominated toxicokinetics and strongly affected internal concentrations of parent compounds and metabolites. Many metabolites reached higher internal concentrations than their parents, characterized by large metabolite enrichment factors. Thus, comparing toxicokinetics across organisms10 and chemicals11 without explicit consideration of biotransformation has limited explanatory power. Extensive biotransformation, as observed in this study, also implies that the development of quantitative-structure activity relationships cannot rely on descriptors for partitioning alone but must also include descriptors for susceptibility to biotransformation. We conclude that mechanistic understanding of differences in species sensitivity24,35 or toxic potency of chemicals24,36 is more likely to succeed if biotransformation kinetics are considered.
Acknowledgments
We thank Eva Potthoff for experimental assistance, Heinz Singer for advice with the LTQ-Orbitrap, and our colleagues for helping to collect G. pulex. This study was supported by the Swiss National Science Foundation (grant 200021-119795), the SETAC-CEFIC-LRI Innovative Science Award, and the University of Queensland travel award for collaborative research. We thank Thomas Preuss and three anonymous reviewers for comments on an earlier version of this manuscript.
Supporting Information Available
Details on experimental conditions, analytical methods, quantification of dietary uptake, and comparison with total 14C study. Raw data used for biotransformation modeling, including the measured internal concentrations. This material is available free of charge via the Internet at http://pubs.acs.org.
The authors declare no competing financial interest.
Supplementary Material
References
- Schwarzenbach R. P.; Escher B. I.; Fenner K.; Hofstetter T. B.; Johnson C. A.; von Gunten U.; Wehrli B. The challenge of micropollutants in aquatic systems. Science 2006, 313 (5790), 1072–1077. [DOI] [PubMed] [Google Scholar]
- Escher B. I.; Hermens J. L. M. Internal exposure: Linking bioavailability to effects. Environ. Sci. Technol. 2004, 38 (23), 455A–462A. [DOI] [PubMed] [Google Scholar]
- Landrum P.; Lee H. II; Lydy M. Toxicokinetics in aquatic systems: model comparison and use in hazard assessment. Environ. Toxicol. Chem. 1992, 11, 1709–1725. [Google Scholar]
- Mackay D.; Fraser A. Bioaccumulation of persistent organic chemicals: mechanisms and models. Environ. Pollut. 2000, 110 (3), 375–391. [DOI] [PubMed] [Google Scholar]
- Hendriks A. J.; van der Linde A.; Cornelissen G.; Sijm D. T. H. M. The power of size. 1. Rate constants and equilibrium ratios for accumulation of organic substances related to octanol-water partition ratio and species weight. Environ. Toxicol. Chem. 2001, 20 (7), 1399–1420. [PubMed] [Google Scholar]
- Escher B. I.; Hermens J. L. M. Modes of action in ecotoxicology: Their role in body burdens, species sensitivity, QSARs, and mixture effects. Environ. Sci. Technol. 2002, 36 (20), 4201–4217. [DOI] [PubMed] [Google Scholar]
- Meador J. P.; McCarty L. S.; Escher B. I.; Adams W. J. 10th Anniversary Critical Review: The tissue-residue approach for toxicity assessment: Concepts, issues, application, and recommendations. J. Environ. Monit. 2008, 10 (12), 1486–1498. [DOI] [PubMed] [Google Scholar]
- McCarty L. S.; Mackay D. Enhancing ecotoxicological modeling and assessment: body residues and modes of toxic action. Environ. Sci. Technol. 1993, 27 (9), 1719–1728. [Google Scholar]
- van Leeuwen C. J.; Vermeire T. G.. Risk assessment of chemicals - an introduction, 2nd ed.; Springer: Dordrecht, The Netherlands, 2007; p 686. [Google Scholar]
- Rubach M. N.; Ashauer R.; Maund S. J.; Baird D. J.; Van den Brink P. J. Toxicokinetic variation in 15 freshwater arthropod species exposed to the insecticide chlorpyrifos. Environ. Toxicol. Chem. 2010, 29 (10), 2225–2234. [DOI] [PubMed] [Google Scholar]
- Ashauer R.; Caravatti I.; Hintermeister A.; Escher B. I. Bioaccumulation kinetics of organic xenobiotic pollutants in the freshwater invertebrate Gammarus pulex modeled with prediction intervals. Environ. Toxicol. Chem. 2010, 29 (7), 1625–1636. [DOI] [PubMed] [Google Scholar]
- Akkanen J.; Kukkonen J. V. K. Biotransformation and bioconcentration of pyrene in Daphnia magna. Aquat. Toxicol. 2003, 64 (1), 53–61. [DOI] [PubMed] [Google Scholar]
- Ankley G. T.; Collyard S. A. Influence of piperonyl butoxide on the toxicity of organophosphate insecticides to 3 species of fresh-water benthic invertebrates. Comp. Biochem. Physiol., Part C: Pharmacol. Toxicol. Endocrinol. 1995, 110 (2), 149–155. [Google Scholar]
- Baldwin W. S.; Leblanc G. A. In-vivo biotransformation of testosterone by phase-I and phase-II detoxication enzymes and their modulation by 20-hydroxyecdysone in Daphnia magna. Aquat. Toxicol. 1994, 29 (1–2), 103–117. [Google Scholar]
- Ikenaka Y.; Eun H.; Ishizaka M.; Miyabara Y. Metabolism of pyrene by aquatic crustacean, Daphnia magna. Aquat. Toxicol. 2006, 80 (2), 158–165. [DOI] [PubMed] [Google Scholar]
- Richter S.; Nagel R. Bioconcentration, biomagnification and metabolism of 14C-terbutryn and 14C-benzo[a]pyrene in Gammarus fossarum and Asellus aquaticus. Chemosphere 2007, 66 (4), 603–610. [DOI] [PubMed] [Google Scholar]
- Nuutinen S.; Landrum P. F.; Schuler L. J.; Kukkonen J. V. K.; Lydy M. J. Toxicokinetics of organic contaminants in Hyalella azteca. Arch. Environ. Contam. Toxicol. 2003, 44 (4), 467–475. [DOI] [PubMed] [Google Scholar]
- Maltby L.; Clayton S. A.; Wood R. M.; McLoughlin N. Evaluation of the Gammarus pulex in situ feeding assay as a biomonitor of water quality: Robustness, responsiveness, and relevance. Environ. Toxicol. Chem. 2002, 21 (2), 361–368. [PubMed] [Google Scholar]
- McCahon C. P.; Pascoe D. Use of Gammarus pulex (L) in Safety Evaluation Tests - Culture and Selection of a Sensitive Life Stage. Ecotoxicol. Environ. Saf. 1988, 15 (3), 245–252. [DOI] [PubMed] [Google Scholar]
- Kunz P. Y.; Kienle C.; Gerhardt A.. Gammarus spp. in aquatic ecotoxicology and water quality assessment: Toward integrated multilevel tests. In Reviews of Environmental Contamination and Toxicology; 2010; Vol. 205, pp 1–76. [DOI] [PubMed] [Google Scholar]
- Ashauer R.; Boxall A.; Brown C. Uptake and elimination of chlorpyrifos and pentachlorophenol into the freshwater amphipod Gammarus pulex. Arch. Environ. Contam. Toxicol. 2006, 51 (4), 542–548. [DOI] [PubMed] [Google Scholar]
- Ashauer R.; Hintermeister A.; Caravatti I.; Kretschmann A.; Escher B. I. Toxicokinetic-toxicodynamic modeling explains carry-over toxicity from exposure to diazinon by slow organism recovery. Environ. Sci. Technol. 2010, 44 (10), 3963–3971. [DOI] [PubMed] [Google Scholar]
- Schuler L. J.; Landrum P. F.; Lydy M. J. Time-dependent toxicity of fluoranthene to freshwater invertebrates and the role of biotransformation on lethal body residues. Environ. Sci. Technol. 2004, 38 (23), 6247–6255. [DOI] [PubMed] [Google Scholar]
- Ashauer R.; Escher B. I. Advantages of toxicokinetic and toxicodynamic modelling in aquatic ecotoxicology and risk assessment. J. Environ. Monit. 2010, 12 (11), 2056–2061. [DOI] [PubMed] [Google Scholar]
- Ashauer R.; Boxall A. B. A.; Brown C. D. Modeling combined effects of pulsed exposure to carbaryl and chlorpyrifos on Gammarus pulex. Environ. Sci. Technol. 2007, 41 (15), 5535–5541. [DOI] [PubMed] [Google Scholar]
- Naylor C.; Maltby L.; Calow P. Scope for growth in Gammarus pulex, a fresh-water benthic detritivore. Hydrobiologia 1989, 188–189 (1), 517–523. [Google Scholar]
- Helbling D. E.; Hollender J.; Kohler H. P. E; Singer H.; Fenner K. High-throughput identification of microbial transformation products of organic micropollutants. Environ. Sci. Technol. 2010, 44 (17), 6621–6627. [DOI] [PubMed] [Google Scholar]
- Epel D.; Luckenbach T.; Stevenson C. N.; MacManus-Spencer L. A.; Hamdoun A.; Smital T. Efflux transporters: Newly appreciated roles in protection against pollutants. Environ. Sci. Technol. 2008, 42 (11), 3914–3920. [DOI] [PMC free article] [PubMed] [Google Scholar]
- Motulsky H. J.; Christopoulos A.. Fitting models to biological data using linear and nonlinear regression. A practical guide to curve fitting; GraphPad Software Inc.: San Diego, CA, USA, 2003. [Google Scholar]
- Katagi T.Bioconcentration, bioaccumulation, and metabolism of pesticides in aquatic organisms. In Reviews of Environmental Contamination and Toxicology; Whitacre D. M., Ed.; 2010; Vol. 204, pp 1–132. [DOI] [PubMed] [Google Scholar]
- Roberts T. R.; Hutson D. H.; Jewess P. J.; Lee P. W.; Nicholls P. H.; Plimmer J. R.. Metabolic Pathways of Agrochemicals. Part 2: Insecticides and Fungicides. In Metabolic Pathways of Agrochemicals. Part 2: Insecticides and Fungicides; Roberts T. R.; Hutson D. H.; Jewess P. J.; Lee P. W.; Nicholls P. H.; Plimmer J. R., Eds.; The Royal Society of Chemistry: Cambridge, UK, 1999. [Google Scholar]
- Katikou P.; Robb D. H. F. Evaluation and comparison of the CEM rapid extraction method with official standard methods for the determination of lipid content in fillets of farmed Atlantic salmon (Salmo salar). Aquaculture 2001, 194 (1–2), 99–105. [Google Scholar]
- Preuss T. G.; Telscher M.; Ratte H. T. Life stage- dependent bioconcentration of a nonylphenol isomer in Daphnia magna. Environ. Pollut. 2008, 156 (3), 1211–1217. [DOI] [PubMed] [Google Scholar]
- Ruotsalainen A. M.; Akkanen J.; Kukkonen J. V. Dissolved organic matter modulating the uptake, biotransformation, and elimination rates of pyrene in Daphnia magna. Environ. Toxicol. Chem. 2010, 29 (12), 2783–2791. [DOI] [PubMed] [Google Scholar]
- Rubach M. N.; Ashauer R.; Buchwalter D. B.; de Lange H. J.; Hamer M.; Preuss T. G.; Töpke K.; Maund S. J. Framework for traits-based assessment in ecotoxicology. Integr. Environ. Assess. Manage. 2011, 7 (2), 172–186. [DOI] [PubMed] [Google Scholar]
- Jager T.; Kooijman S. A. L. M. A biology-based approach for quantitative structure-activity relationships (QSARs) in ecotoxicity. Ecotoxicology 2009, 18 (2), 187–196. [DOI] [PubMed] [Google Scholar]
- Sangster J. Octanol-Water Partition-Coefficients of Simple Organic-Compounds. J. Phys. Chem. Ref. Data 1989, 18 (3), 1111–1229. [Google Scholar]
- Jacobson A.; Williams T. M. The environmental fate of isothiazolone biocides. Chim. Oggi 2000, 18 (10), 105–108. [Google Scholar]
Associated Data
This section collects any data citations, data availability statements, or supplementary materials included in this article.