Abstract
Abdominal fat, and in particular, visceral adipose tissue (VAT), is the critical fat depot associated with metabolic aberrations. At present VAT can only be accurately measured by computed tomography (CT) or magnetic resonance imaging (MRI). This study was designed to compare a new abdominal bioelectrical impedance device against total abdominal adipose tissue (TAAT) and VAT area measurements made from an abdominal MRI scan, and to assess it’s reliability and accuracy.
120 participants were recruited, stratified by gender and body mass index (BMI). Participants had triplicate measures of abdominal fat and WC with the AB-140 (Tanita Corp, Tokyo, Japan) and WC measurements using a manual tape measure. A single abdominal MRI scan was performed as the reference method.
Triplicate measures with the AB-140 showed excellent precision for ‘visceral fat level’, trunk fat % and WC. AB-140 ‘visceral fat level’ showed significantly stronger correlations with MRI TAAT area than with MRI VAT area (r=0.94 vs. 0.65 in men and 0.92 vs. 0.64 in women). AB-140 WC showed good correlation with manual WC measurements (r=0.95 in men and 0.90 in women). AB-140 and manual WC’s showed comparable correlations with MRI TAAT area (r=0.92 and 0.96 in men and 0.88 and 0.88 in women). AB-140 is a simple, quick and precise technique to measure abdominal fat and WC in healthy adults. It provides a useful proxy for TAAT measured by MRI, comparable to the correlation obtained with manual WC measurements. Neither the AB-140 abdominal fat measures, nor WC measurement appear to provide a useful proxy measure of VAT.
Keywords: Abdominal obesity, Visceral fat, Waist circumference, Bioelectrical impedance, Magnetic resonance imaging / MRI
INTRODUCTION
The relationship between obesity and an increased risk of morbidity and premature mortality is well established (1). Analyses have traditionally used body mass index (BMI) as the proxy measure of obesity. However, in 1956 it was first suggested that the distribution of the excess weight was more important (2) and, over subsequent years, the focus of research has expanded to encompass the relationship between regional fat depots and disease.
Visceral adipose tissue (VAT), deposited in the intra-abdominal cavity and surrounding the internal organs, is associated with a variety of metabolic risk factors (3), is a predictor of premature mortality (4) and is causally implicated in the development of disease through a variety of different mechanisms (5, 6). However, research is constrained because imaging techniques, such as computed tomography (CT) and magnetic resonance imaging (MRI) are the only direct methods to quantify VAT (7).
It has been shown previously that waist circumference (WC) is correlated with measures of total abdominal adipose tissue (TAAT) from CT and MRI (8, 9). Similarly, WC has been shown to be correlated, but less strongly so, with VAT, particularly in obese subjects (10, 11). WC has been used widely in observational studies, and shown to be a stronger and indeed independent, predictor of health risks over BMI (12).
Bioelectrical impedance (BIA) is an established method for the prediction of whole-body fat mass. A new method, combining the use of infra-red (IR) and abdominal BIA, has been designed to measure WC and to estimate trunk fat percentage and ‘visceral fat level’. The Tanita AB-140 (Tanita Corp, Tokyo, Japan) has the potential to provide valuable information to improve the assessment of individual health risks or to monitor the impact of intervention.
Objectives
This study reports the results of a study to examine the performance of the AB-140 as a measure of abdominal fatness, against the reference method, MRI, and to compare it against manual measurements of WC.
METHODS
Study Design
The study was approved by the Local Research Ethics Committee 08/H0306/64. Participants gave written, informed consent before inclusion in the study. The study was a cross-sectional design, with each participant completing two study visits within 7 days. On the first visit, at MRC Human Nutrition Research, all anthropometry and BIA measurements were made. On the second visit, at the MRIS Unit, the MRI was performed.
Recruitment
120 participants, aged between 18-79 years were recruited into one of 6 groups (n=20 per group), stratified by gender and BMI (<25, 25-29.9 and 30-35 kg/m2, or lean, overweight and obese groups respectively). Selection criteria were designed to exclude subjects for whom the MRI or BIA was unsuitable, and for whom results may be unreliable due to unusual changes in body weight or composition. Participants were excluded if they were not weight stable (defined as a self-reported weight change of more than 2kg in the previous month), were pregnant or lactating women, athletes, had been previously diagnosed with lipodystrophy, any disorder or concomitant medication known to affect fat distribution, cancer within last 5 years, or had been treated with surgical aneurysm clips in the brain, inner ear implants, replacement joints or prosthetic limbs or metal implants or a pacemaker.
Anthropometry
Height was measured using a wall-mounted stadiometer (Holtain Ltd, Dyfed, Wales, UK), to the nearest 0.5cm, with the participant’s head in the Frankfort plane. Body mass, wearing light indoor clothing but no shoes, was measured using the BC-420 MA (Tanita Corp, Tokyo, Japan), to the nearest 0.1kg. A correction factor of −1kg was used to adjust for the weight of clothes. WC was measured using a tape measure to the nearest 0.5 cm, at both the level of the umbilicus and the level of the midpoint waist, as defined by the World Health Organisation, by measuring at the mid-point between the lowest palpable rib and the top of the iliac crest, in the mid-axillary line. WC measurements were made in triplicate, repositioning the tape between measurements with the average at each level taken and reported. One observer performed 89% of all measurements, with all measurements within a participant made by the same trained observer.
AB-140
For the first 13 participants the AB-100 was used, and for the remaining participants the AB-140 was used. Since these two devices differ only in their cosmetic appearance and use the same core components, AB-140 will be used to describe these two devices. For all AB-140 measurements participants were in a supine position, without a pillow, with arms laid across the chest. The AB-140 was positioned perpendicular to the participant’s body at the umbilical level as per manufacturers instructions, with the multi-frequency electrode device positioned on the abdomen in direct contact with the skin. Trunk fat %, ‘visceral fat level’ and WC measurements were made in triplicate, repositioning the AB-140 between each measurement. The average of the triplicate results was used to compare with the MRI and manual WC results.
MRI
Participants were each examined once on a GE 1.5T HDx (GE Healthcare, Waukesha, WI) using an 8-channel torso phased array coil, and analysed with SliceOmatic, version 4.3 software, licensed by TomoVision (TomoVision, Montreal, Canada). A single shot fast spin echo (SSFSE) sequence was applied with the following parameters: TE/TR/BW/matrix size/FOV (minfull/min/62.5KHz/256! 256/32-48cm). The field of view was set to encompass both VAT and the subcutaneous abdominal adipose tissue (SAAT). The slice thickness was 10mm with a 5mm inter-slice gap. Slices were obtained from the level of the xiphisternum to the pubic symphysis. For measurement of VAT and SAAT area in the abdominal region, the single slice selected for analysis was in line with the iliac crests at the L4/5 vertebrae, a slice commonly selected and previously shown to be correlated with multi-slice visceral and subcutaneous adipose tissue volumes (13) and close to the umbilicus. VAT and SAAT areas were identified by an experienced trained technician with 5 years experience in quantifying abdominal adipose tissue; each assessment was agreed in consensus with a radiologist with over 20 years experience in adipose tissue quantification. VAT and SAAT areas were summed to give the TAAT area.
Statistical analysis
Raw data was checked and analysed by an independent statistician (MC). Data was analysed using a mixed effects model with participant as a random effect in order to separate the within and between individual components of variation and assess the reliability of repeat measures. An average of the repeat measures was then calculated and agreement between methods assessed visually by scatter-plots and Bland-Altman plots (14). Pearson’s correlation coefficients with 95% confidence intervals were calculated. All analysis was performed using Stata version 10.1 (StataCorp, College Station, Texas 77845, USA).
RESULTS
A total of 120 participants were included in the study, with 20 participants in each of the 6 groups. A single AB-140 measurement was missing for 2 individuals (with obvious outlying values, due to a machine error). For these individuals, instead an average from the duplicate repeat was obtained. Participant characteristics are shown in Table 1.
Table 1.
Descriptive characteristics of the participants, divided by gender and BMI group
| Male | Female | |||||||
|---|---|---|---|---|---|---|---|---|
|
Lean n=20 |
Overweight n=20 |
Obese n=20 |
TOTAL
n=60 |
Lean n=20 |
Overweight n=20 |
Obese n=20 |
TOTAL
n=60 |
|
| Age (years) | 53 (16) | 59 (13) | 58 (14) | 57 (14) | 60 (13) | 56 (16) | 55 (13) | 57 (14) |
| BMI (kg/m2) | 22.3 (1.7) | 27.8 (1.5) | 32.4 (1.6) | 27.5 (4.4) | 22.7 (1.7) | 27.3 (1.1) | 32.1 (1.4) | 27.4 (4.1) |
| MRI TAAT (cm2) | 197 (79) | 370 (62) | 520 (97) | 362 (155) | 274 (68) | 393 (72) | 550 (74) | 405 (134) |
| MRI VAT (cm2) | 78 (56) | 153 (58) | 210 (81) | 147 (85) | 70 (31) | 78 (31) | 131 (50) | 93 (46) |
| MRI SAAT (cm2) | 119 (36) | 216 (55) | 310 (101) | 215 (104) | 204 (60) | 315 (61) | 419 (76) | 312 (110) |
| AB-140 trunk fat % | 19.6 (5.6) | 30.1 (4.1) | 36.2 (4.2) | 28.6 (8.3) | 34.5 (6.7) | 43.1 (4.7) | 48.6 (2.4) | 42.1 (7.6) |
| AB-140 ‘visceral fat level’ | 7.9 (2.4) | 13.8 (2.7) | 19.1 (3.7) | 13.6 (5.5) | 6.3 (2.3) | 9.7 (2.1) | 12.6 (1.4) | 9.5 (3.2) |
| AB-140 WC (cm) | 87.3 (4.8) | 98.2 (5.4) | 110.0 (6.2) | 98.5 (10.8) | 90.6 (9.5) | 105.3 (6.9) | 115.0 (5.3) | 103.6 (12.5) |
| Manual Umbilical WC (cm) | 87.7 (5.1) | 103.1 (5.3) | 113.9 (5.9) | 101.6 (12.1) | 85.8 (8.6) | 97.3 (8.2) | 109.4 (6.5) | 97.5 (12.4) |
| Manual True WC (cm) | 87.1 (5.5) | 103.0 (5.2) | 113.8 (5.9) | 101.3 (12.3) | 81.8 (7.3) | 93.1 (7.4) | 105.2 (5.8) | 93.4 (11.7) |
Data presented as Mean (SD).
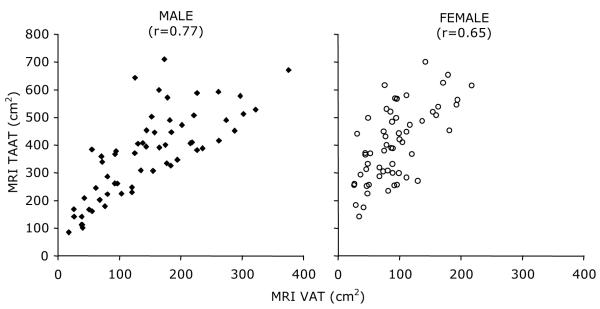
The design of the study, with stratification of participants by BMI, was intended to include a broad range of VAT area values. Data from the MRI scan, illustrates that this was successfully achieved. Table 1 shows that within a given BMI group, men have greater quantities of VAT, but lesser quantities of SAAT and TAAT, than women. The large SD illustrates that inter-individual variability of VAT area within each BMI group is particularly marked in men. Figure 1 shows the relationship between VAT and TAAT area in men and women, measured using MRI. While the two measures are broadly correlated (r=0.77 and r=0.65 in men and women, respectively), they are not directly proportional in men or women.
Figure 1.
Scatterplots of the relationship between MRI VAT and MRI TAAT
Reliability
The triplicate measurements show excellent reliability for the AB-140 for trunk fat %, ‘visceral fat level’ and WC, with a similar level of reliability for the manual tape measure WC at both levels. The standard deviation (SD) for ‘visceral fat level’ was 0.61, with an intra-class correlation coefficient (ICC) of 0.985, while the SD for trunk fat % was 0.66%, with an ICC of 0.996. The SD of the triplicate measurements of WC by the AB-140 was 0.54cm, with an ICC of 0.998. The SD of the manual WC was 0.73cm, with an ICC of 0.997 at the midpoint WC level and an SD of 0.77cm and an ICC of 0.996 at the umbilical WC level.
Agreement between WC measurements
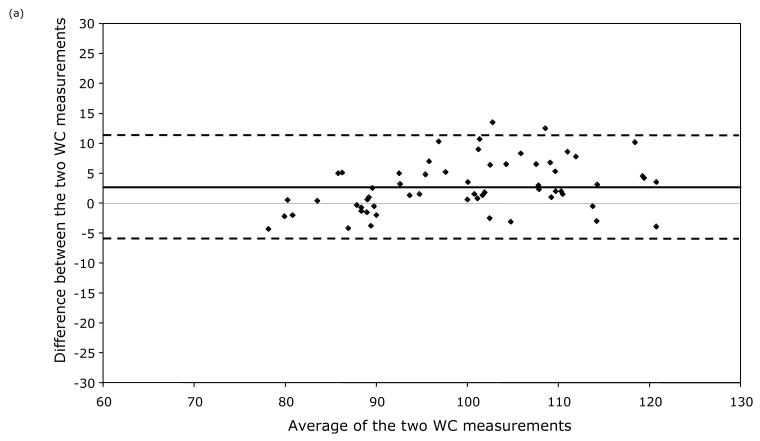
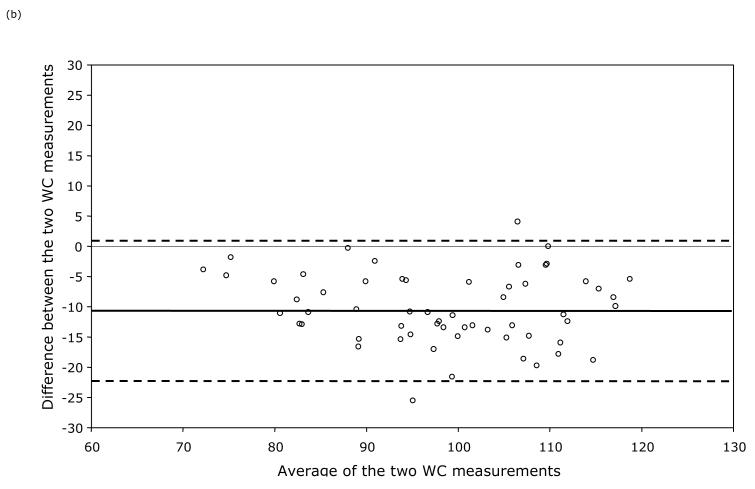
Table 1 shows the average WC measurements and Figure 2 shows the Mean-Difference plots of the AB-140 WC and the manual umbilical WC. On average, the AB-140 WC was 3.0cm smaller in men (95% CI −10.5 to 4.5cm) and 6.1cm larger in women (95% CI −5.0 to 17.2cm) than the manual umbilical WC. When comparing with the manual midpoint WC, the mean AB-140 WC was 2.8cm smaller in men (95% CI −11.2 to 5.7cm) and 10.3cm larger in women (95% CI −1.2 to 21.7cm).
Figure 2.
Mean-difference plot for manual umbilical WC and AB-140 WC in (a) men and (b) women. Solid line indicates the mean difference, dashed lines the 95% CI.
Relationship between AB-140 measures and MRI VAT and TAAT
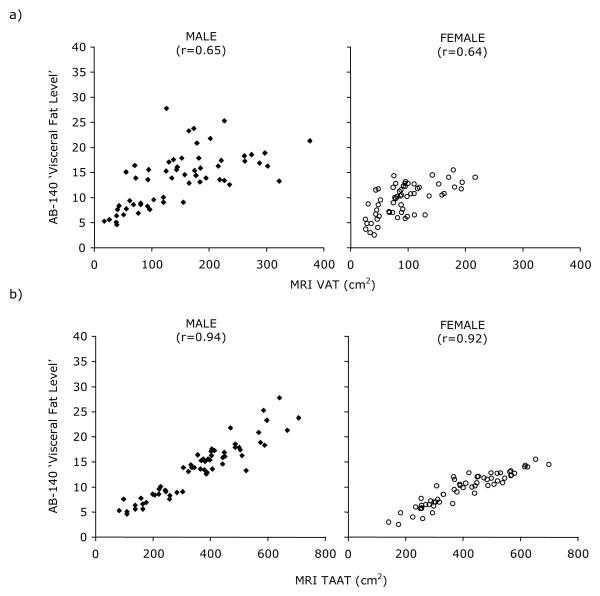
Table 2 shows the correlation coefficients between the AB-140 trunk fat % and MRI TAAT area. There are good correlations in both men and women (r=0.93 and 0.89 respectively). Table 2 and Figure 3 show the correlation coefficients between the AB-140 ‘visceral fat level’ and MRI VAT area and MRI TAAT area. The correlation with MRI TAAT area is significantly higher than that with MRI VAT area, in both men and women (r=0.94 vs. 0.65 and 0.92 vs. 0.64 respectively, p<0.05).
Table 2.
Pearson’s correlation coefficients between results from the MRI, AB-140 and manual techniques
| MRI variables | AB-140 variables | Manual | |||||||
|---|---|---|---|---|---|---|---|---|---|
| VAT area | SAAT area | Trunk Fat % | ‘Visceral fat level’ | WC | True WC | Umbilical WC | BMI | ||
|
MEN
| |||||||||
|
MRI
variables |
TAAT area | 0.77 (0.64-0.85) | 0.86 (0.77-0.91) | 0.93 (0.88-0.95) | 0.94 (0.90-0.96) | 0.92 (0.87-0.95) | 0.96 (0.93-0.97) | 0.96 (0.93-0.97) | 0.92 (0.87-0.95) |
| VAT area | 0.33 (0.08-0.54) | 0.65 (0.47-0.77) | 0.65 (0.47-0.77) | 0.63 (0.44-0.77) | 0.75 (0.61-0.84) | 0.71 (0.55-0.81) | 0.64 (0.46-0.77) | ||
| SAAT area | 0.85 (0.76-0.90) | 0.87 (0.79-0.92) | 0.86 (0.77-0.91) | 0.82 (0.71-0.89) | 0.85 (0.76-0.90) | 0.84 (0.74-0.90) | |||
|
AB-140
variables |
Trunk fat % | 0.96 (0.93-0.97) | 0.90 (0.83-0.94) | 0.91 (0.85-0.94) | 0.91 (0.85-0.94) | 0.87 (0.79-0.92) | |||
| ‘Visceral fat level’ | 0.95 (0.92-0.97) | 0.92 (0.87-0.95) | 0.93 (0.88-0.95) | 0.89 (0.82-0.93) | |||||
| WC | 0.94 (0.90-0.96) | 0.95 (0.92-0.97) | 0.92 (0.87-0.95) | ||||||
| Manual | True WC | 0.99 (0.98-0.99) | 0.95 (0.92-0.97) | ||||||
| Umbilical WC | 0.96 (0.93-0.97) | ||||||||
|
| |||||||||
|
WOMEN
| |||||||||
|
MRI
variables |
TAAT area | 0.65 (0.47-0.77) | 0.95 (0.92-0.97) | 0.89 (0.82-0.93) | 0.92 (0.87-0.95) | 0.88 (0.80-0.92) | 0.91 (0.85-0.94) | 0.88 (0.80-0.92) | 0.91 (0.85-0.94) |
| VAT area | 0.37 (0.13-0.57) | 0.61 (0.42-0.74) | 0.64 (0.46-0.77) | 0.57 (0.37-0.72) | 0.75 (0.61-0.84) | 0.74 (0.60-0.84) | 0.58 (0.38-0.73) | ||
| SAAT area | 0.83 (0.73-0.89) | 0.86 (0.77-0.91) | 0.84 (0.74-0.90) | 0.80 (0.68-0.87) | 0.76 (0.63-0.85) | 0.86 (0.77-0.91) | |||
|
AB-140
variables |
Trunk fat % | 0.97 (0.95-0.99) | 0.96 (0.93-0.97) | 0.89 (0.82-0.93) | 0.91 (0.85-0.94) | 0.83 (0.73-0.89) | |||
| ‘Visceral fat level’ | 0.96 (0.93-0.97) | 0.90 (0.83-0.94) | 0.92 (0.87-0.95) | 0.86 (0.77-0.91) | |||||
| WC | 0.86 (0.77-0.91) | 0.90 (0.82-0.94) | 0.85 (0.76-0.90) | ||||||
| Manual | True WC | 0.95 (0.92-0.97) | 0.89 (0.82-0.93) | ||||||
| Umbilical WC | 0.86 (0.77-0.91) | ||||||||
Data presented as Pearson’s correlation coefficient (95% CI).
Figure 3.
Scatterplots of the relationship between AB-140 ‘visceral fat level’ and (a) MRI VAT and (b) MRI TAAT
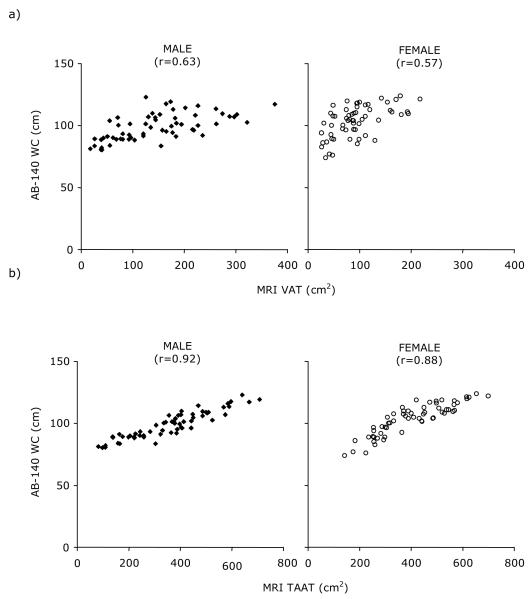
The AB-140 WC measurement also shows significantly better correlation with TAAT area than with VAT area in both men and women (Table 2 and Figure 4, r=0.92 vs. 0.63 and 0.88 vs. 0.57, p<0.05). The correlation of MRI TAAT area with both manual WC’s is similar to that between the MRI TAAT area and the AB-140 WC (r=0.96, 0.96, 0.92 in men and r=0.91, 0.88, 0.88 in women with midpoint WC, umbilical WC and AB-140 WC respectively).
Figure 4.
Scatterplots of the relationship between AB-140 WC and (a) MRI VAT and (b) MRI TAAT
DISCUSSION
The results of this study show that the AB-140, a novel bioelectrical impedance technique, is a very precise measure of WC, trunk fat and ‘visceral fat level’. Both the AB-140 BIA measures, trunk fat % and ‘visceral fat level’, show better correlations with MRI measurements of TAAT than VAT. This is particularly apparent for subjects with a greater proportion of VAT, where the relationship between VAT and TAAT is less predictable. This suggests that the “visceral fat level” measure would more appropriately be regarded as ‘abdominal fat level’.
AB-140 ‘visceral fat level’, trunk fat % and WC show similar correlations to the manual WC measurements at both the midpoint and umbilical level, with MRI TAAT, suggesting that they are all useful as proxy measurements. It is now important to explore the relationship between the AB-140 measurements and obesity-related disease outcomes, to determine its usefulness as a predictor of disease.
In this study, a similar degree of precision was obtained with AB-140 and manual tape measures of WC. However, manual repeat measurements were made by a single observer with a high level of training, within a very short timeframe, with visible markings of the measurement site and in full knowledge that the data would be used to calculate precision. Hence, the manual tape measure precision is likely to be lower in routine use, particularly in cases of multiple observers. Inter-observer differences are reported to be significantly higher than intra-observer differences (15-17). In contrast, the ease of use of the AB-140, with an infra-red tool used to aid correct positioning of the device at the level of the umbilicus, would suggest the precision estimate in this study is appropriate.
WC was measured with a tape measure at both the midpoint waist and the umbilical level to provide both a comparison with the current field method, and a like-with-like comparison for the AB-140 WC. There are clear systematic differences between the measurements of WC by the AB-140 and the current field method and the umbilical level. This difference is particularly evident in women, where AB-140 WC is consistently larger than either manual WC. This difference may in part be due to absolute differences in the two approaches, not least that subjects were measured supine with the AB-140 and standing with the tape measure. The difference between measurements was slightly larger for the midpoint WC measurement, where there is the additional variability of the measurements being taken at slightly different levels. Similar observations of differences in WC measured at different sites, particularly in women, have been reported (17-19) and may be explained by differences in body shape between genders (20). Hence, while the AB-140 provides a precise and objective measurement of WC, it is not directly comparable to the current field measure. This will limit its applicability as a diagnostic tool, where current cut off values will not be appropriate and in large-scale surveys where there is comparison with historical measurements of WC. However, studies have shown that the site of measurement does not affect the association with disease outcomes (19, 21) and hence the AB-140 is potentially a valuable tool for new surveys and particularly for intervention studies where there is a need to make precise measurements of potentially subtle changes.
The AB-140 is, to our knowledge, the only simple device that directly assesses abdominal fat. It requires only prior information on gender and then makes an infra-red measurement of WC and an impedance measurement in order to calculate an abdominal fat level value. Unlike whole-body impedance devices, the algorithm does not rely on factors such as age, weight or height to refine the estimation of body fat.
CONCLUSION
This is the first study to demonstrate that the AB-140 is a precise and useful measure of both abdominal fat and WC. Although AB-140 measurements show no closer correlation with MRI TAAT than manual WC, the AB-140 may overcome the observer error associated with manual WC. Further work is now needed to assess the relationship between abdominal fat and WC measurements from the AB-140 and health outcomes to determine their individual and combined usefulness in the prediction of disease risk.
Acknowledgments
CONFLICT OF INTEREST: Funding for this study was provided by Tanita Corp (Tanita, Tokyo, Japan). SAJ and AMP receive compensation as members of the Tanita Medical Advisory Board. We also acknowledge support from the NIHR Cambridge Biomedical Research Centre and the Medical Research Council.
ABREVIATONS
- BMI
body mass index
- CT
computed tomography
- ICC
intra class correlation
- MRI
magnetic resonance imaging
- SAAT
subcutaneous abdominal adipose tissue
- SD
standard deviation
- TAAT
total abdominal adipose tissue
- VAT
visceral adipose tissue
- WC
waist circumference
REFERENCES
- 1.Willett WC, Dietz WH, Colditz G. Guidelines for Healthy Weight. N Engl J Med. 1999;341(6):427–34. doi: 10.1056/NEJM199908053410607. [DOI] [PubMed] [Google Scholar]
- 2.Vague J. The degree of masculine differentiation of obesities: a factor determining predisposition to diabetes, atherosclerosis, gout and uric calculous disease. Am J Clin Nutr. 1956;4:20–34. doi: 10.1093/ajcn/4.1.20. [DOI] [PubMed] [Google Scholar]
- 3.Fox CS, Massaro JM, Hoffmann U, et al. Abdominal visceral and subcutaneous adipose tissue compartments: association with metabolic risk factors in the Framingham Heart Study. Circulation. 2007;116(1):39–48. doi: 10.1161/CIRCULATIONAHA.106.675355. [DOI] [PubMed] [Google Scholar]
- 4.Kuk JL, Katzmarzyk PT, Nichaman MZ, Church TS, Blair SN, Ross R. Visceral fat is an independent predictor of all-cause mortality in men. Obesity (Silver Spring) 2006;14(2):336–41. doi: 10.1038/oby.2006.43. [DOI] [PubMed] [Google Scholar]
- 5.Frayn KN. Visceral fat and insulin resistance--causative or correlative? Br J Nutr. 2000;83(Suppl 1):S71–7. doi: 10.1017/s0007114500000982. [DOI] [PubMed] [Google Scholar]
- 6.Mathieu P, Poirier P, Pibarot P, Lemieux I, Despres JP. Visceral Obesity: The Link Among Inflammation, Hypertension and Cardiovascular Disease. Hypertension. 2009;53:577–84. doi: 10.1161/HYPERTENSIONAHA.108.110320. [DOI] [PubMed] [Google Scholar]
- 7.van der Kooy K, Seidell JC. Techniques for the measurement of visceral fat: a practical guide. Int J Obes Relat Metab Disord. 1993;17(4):187–96. [PubMed] [Google Scholar]
- 8.Ashwell M, Cole TJ, Dixon AK. Obesity: new insight into the anthropometric classification of fat distribution shown by computed tomography. Br Med J (Clin Res Ed) 1985;290(6483):1692–4. doi: 10.1136/bmj.290.6483.1692. [DOI] [PMC free article] [PubMed] [Google Scholar]
- 9.Ross R, Leger L, Morris D, de Guise J, Guardo R. Quantification of adipose tissue by MRI: relationship with anthropometric variables. J Appl Physiol. 1992;72(2):787–95. doi: 10.1152/jappl.1992.72.2.787. [DOI] [PubMed] [Google Scholar]
- 10.Busetto L, Baggio MB, Zurlo F, Carraro R, Digito M, Enzi G. Assessment of abdominal fat distribution in obese patients: anthropometry versus computerized tomography. Int J Obes Relat Metab Disord. 1992;16(10):731–6. [PubMed] [Google Scholar]
- 11.Oka R, Miura K, Sakurai M, et al. Comparison of waist circumference with body mass index for predicting abdominal adipose tissue. Diabetes Res Clin Pract. 2009;83(1):100–5. doi: 10.1016/j.diabres.2008.10.001. [DOI] [PubMed] [Google Scholar]
- 12.Yusuf S, Hawken S, Ounpuu S, et al. Obesity and the risk of myocardial infarction in 27,000 participants from 52 countries: a case-control study. Lancet. 2005;366(9497):1640–9. doi: 10.1016/S0140-6736(05)67663-5. [DOI] [PubMed] [Google Scholar]
- 13.Shen W, Punyanitya M, Wang Z, et al. Total body skeletal muscle and adipose tissue volumes: estimation from a single abdominal cross-sectional image. J Appl Physiol. 2004;97(6):2333–8. doi: 10.1152/japplphysiol.00744.2004. [DOI] [PubMed] [Google Scholar]
- 14.Bland JM, Altman DG. Statistical Methods for assessing the agreement between two methods of clinical Measurement. Lancet. 1986 Feb 8th;:307–310. [PubMed] [Google Scholar]
- 15.Klipstein-Grobusch K, Georg T, Boeing H. Interviewer variability in anthropometric measurements and estimates of body composition. Int J Epidemiol. 1997;26(Suppl 1):S174–80. doi: 10.1093/ije/26.suppl_1.s174. [DOI] [PubMed] [Google Scholar]
- 16.Nadas J, Putz Z, Kolev G, Nagy S, Jermendy G. Intraobserver and interobserver variability of measuring waist circumference. Med Sci Monit. 2008;14(1):CR15–18. [PubMed] [Google Scholar]
- 17.Mason C, Katzmarzyk PT. Variability in Waist Circumference Measurements According to Anatomic Measurement Site. Obesity (Silver Spring) 2009 doi: 10.1038/oby.2009.87. doi:10.1038/oby.2009.87. [DOI] [PubMed] [Google Scholar]
- 18.Wang J, Thornton JC, Bari S, et al. Comparisons of waist circumferences measured at 4 sites. Am J Clin Nutr. 2003;77(2):379–84. doi: 10.1093/ajcn/77.2.379. [DOI] [PubMed] [Google Scholar]
- 19.Matsushita Y, Tomita K, Yokoyama T, Mizoue T. Optimal waist circumference measurement site for assessing the metabolic syndrome. Diabetes Care. 2009;32(6):e70. doi: 10.2337/dc09-0190. [DOI] [PubMed] [Google Scholar]
- 20.Wells JC, Cole TJ, Treleaven P. Age-variability in body shape associated with excess weight: the UK National Sizing Survey. Obesity (Silver Spring) 2008;16(2):435–41. doi: 10.1038/oby.2007.62. [DOI] [PubMed] [Google Scholar]
- 21.Ross R, Berentzen T, Bradshaw AJ, et al. Does the relationship between waist circumference, morbidity and mortality depend on measurement protocol for waist circumference? Obes Rev. 2008;9(4):312–25. doi: 10.1111/j.1467-789X.2007.00411.x. [DOI] [PubMed] [Google Scholar]


