Abstract
OBJECTIVE
The evidence on the association between fish consumption, dietary long-chain n-3 fatty acids, and risk of type 2 diabetes is inconsistent. We therefore performed a systematic review and meta-analysis of the available prospective evidence.
RESEARCH DESIGN AND METHODS
Studies were identified by searching the PubMed and EMBASE databases through 15 December 2011 and by reviewing the reference lists of retrieved articles. Prospective studies were included if they reported relative risk (RR) estimates with 95% CIs for the association between fish consumption and/or dietary long-chain n-3 fatty acids and incidence of type 2 diabetes. A dose-response random-effects model was used to combine study-specific RRs. Potential sources of heterogeneity were explored by prespecified stratifications.
RESULTS
Sixteen studies involving 527,441 participants and 24,082 diabetes cases were included. Considerable statistical heterogeneity in the overall summary estimates was partly explained by geographical differences. For each serving per week increment in fish consumption, the RRs (95% CIs) of type 2 diabetes were 1.05 (1.02–1.09), 1.03 (0.96–1.11), and 0.98 (0.97–1.00) combining U.S., European, and Asian/Australian studies, respectively. For each 0.30 g per day increment in long-chain n-3 fatty acids, the corresponding summary estimates were 1.17 (1.09–1.26), 0.98 (0.70–1.37), and 0.90 (0.82–0.98).
CONCLUSIONS
Results from this meta-analysis indicate differences between geographical regions in observed associations of fish consumption and dietary intake of long-chain n-3 fatty acids with risk of type 2 diabetes. In consideration of the heterogeneous results, the relationship warrants further investigation. Meanwhile, current public health recommendations on fish consumption should be upheld unchanged.
Type 2 diabetes is one of the most common chronic diseases with a great public health burden in most countries. The worldwide prevalence has been estimated to be about 285 million and is predicted to increase substantially in the coming decades (1). Lifestyle factors, including diet, are key components in the primary prevention of type 2 diabetes (2). Fish consumption has been of particular interest given the beneficial effects seen on multiple risk factors associated with diabetes, such as lipid profile, blood pressure, and inflammation, as well as on coronary heart disease and stroke (3). The observed cardiovascular benefits of fish consumption have largely been attributed to the long-chain n-3 fatty acids eicosapentaenoic acid (EPA) and docosahexaenoic acid (DHA), predominantly found in fatty fish (3). Composition of dietary fatty acids is of interest in diabetes because fatty acids may influence glucose metabolism by altering cell membrane function, enzyme activity, insulin signaling, and gene expression (4), and long-chain n-3 fatty acids are known to be especially potent (5). However, the role of fish consumption and long-chain n-3 fatty acids in the development of type 2 diabetes remains unclear. Results from randomized controlled trials evaluating the effects of long-chain n-3 fatty acid supplementation on insulin and glucose metabolism among nondiabetic individuals have been mixed. Most studies, including a recent meta-analysis, have however reported no effect (6). The epidemiological evidence on fish and long-chain n-3 fatty acids in relation to diabetes incidence has recently emerged, but the results have been inconsistent.
Our aim was to summarize the results from prospective studies on the association between self-reported total fish consumption and dietary intake of long-chain n-3 fatty acids and incident type 2 diabetes with a systematic review and a dose-response meta-analysis, adhering to the PRISMA statement (7).
RESEARCH DESIGN AND METHODS
Literature search and data extraction
We conducted a literature search through 15 December 2011 using the PubMed and EMBASE databases without restrictions on language or publication date. The search term “diabetes” was used in combination with “fish,” “seafood,” “fatty acids,” “long-chain omega-3,” “long-chain n-3,” “docosahexaenoic acid,” or “eicosapentaenoic acid” and “cohort,” “prospective,” “follow-up,” or “longitudinal.” Moreover, we reviewed the reference lists from retrieved articles to identify additional relevant studies. Studies were included in the meta-analysis if the following criteria were met and reported: 1) prospective design (prospective cohort studies or nested case-control studies); 2) the exposure studied was self-reported fish consumption or dietary intake of long-chain n-3 fatty acids (marine derived n-3 fatty acids such as EPA and DHA); 3) the outcome of interest was incidence of type 2 diabetes; and 4) relative risk (RR) estimates with 95% CIs. We considered odds ratios, risk ratios, and hazard ratios as estimates of the RR. Dose-response meta-analysis requires the distribution of cases and noncases or person-time, and RRs with 95% CIs for at least three quantitative exposure categories or for a continuous exposure. For all identified studies that met inclusion criteria but failed to report sufficient information (8–13), we obtained additional information from the authors. If data were duplicated in more than one study, we included the study with the largest number of cases.
The following data were extracted from each study: the first author’s last name, publication year, country where the study was performed, study period, number of cases and cohort size, sex and age of study participants, measure and range of exposure, methods for identifying type 2 diabetes, variables adjusted for in the analysis, and RR estimates with corresponding 95% CIs for each category of consumption of fish and/or long-chain n-3 fatty acids. When several risk estimates were presented, we extracted the ones that reflected the greatest degree of control for potential confounders. The study quality was assessed using the Newcastle-Ottawa Quality Assessment Scale for cohort studies, with which each study is judged based on the selection of study groups, the comparability of the groups, the exposure assessment, and ascertainment of outcome (14). Study selection, data extraction, and quality assessment were conducted independently by two authors (A.Wa. and D.D.G.), with disagreements resolved by consensus.
Meta-analysis
We conducted a two-stage dose-response random-effects meta-analysis to combine study-specific RRs (15). Linear dose-response curves were estimated taking the covariance among risk estimates for different exposure categories into account (15). Because the included studies used different units to report fish consumption (i.e., grams or servings), we rescaled consumption into servings per week using 100 g as the approximate average serving size. In addition, we explored how this assumption affected the results by changing the approximated serving size to 80 g and 140 g. The median level of consumption for each category was assigned to the corresponding RR estimate. When the median consumption per category was not presented in the article, the midpoint between the upper and lower boundary was used. If the lowest category was open-ended, the lower boundary was assumed to be zero. Open-ended top categories were assumed to be of the same magnitude as the preceding category. We assessed a potential departure from linearity in the dose-response relationship by modeling consumption levels using restricted cubic splines with three knots at fixed percentiles 10, 50, and 90% of the distribution. A P value for nonlinearity was calculated by testing the null hypothesis that the coefficient of the second spline is equal to 0 in a multivariable random-effects meta-regression model (16). To examine potential sources of heterogeneity, prespecified sensitivity analyses were defined, including stratifications by sex, geographical region, methods for exposure assessment and ascertainment of outcome, and quality score. Data were not available in the published articles to examine other potentially influential factors, such as age and BMI categories. Further, we conducted sensitivity analyses omitting one study at the time to evaluate whether results were affected markedly by single studies. We also examined the effect of omitting studies with nested case-control design. Statistical heterogeneity among studies was evaluated with the Cochran Q-test and the I 2 statistic (17), which assesses the proportion of total variation that is due to between-study variation. Potential publication bias was assessed with the Egger regression asymmetry test (18). All statistical analyses were performed with Stata software, version 10.1 (Stata Corp, College Station, Texas, USA). P < 0.05 was considered statistically significant.
RESULTS
Systematic review and study characteristics
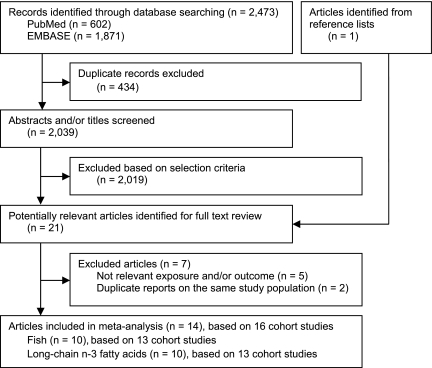
The detailed steps of our literature search are shown in Fig. 1. Briefly, a total of 2,473 articles were identified by searching the databases, 434 duplicated articles and 2,019 articles that did not meet the selection criteria were excluded after screening of abstract and/or title. The remaining 20 articles and 1 additional article (12) identified from reference lists were obtained for full-text review. Among these, 5 articles were excluded because they assessed only total polyunsaturated fatty acids and/or outcome was defined as impaired glucose tolerance rather than incidence of type 2 diabetes (19–23). In addition, two duplicate reports from the same study population were excluded (24,25). The remaining 14 publications, reporting results from 16 separate cohort studies, were included in the meta-analysis (8–13,26–33).
Figure 1.
Systematic review flow diagram.
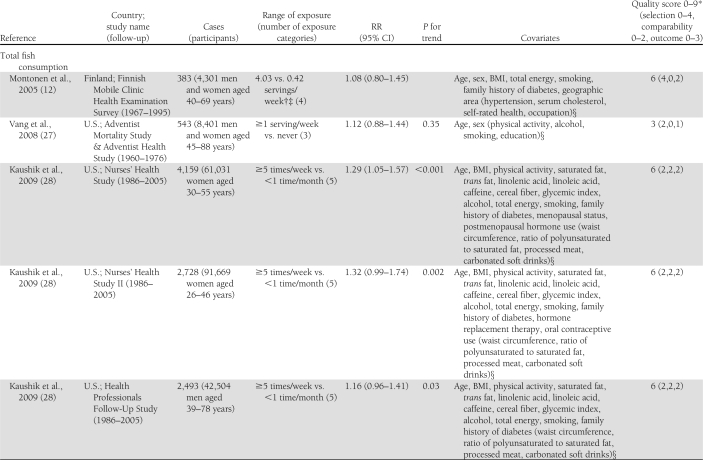
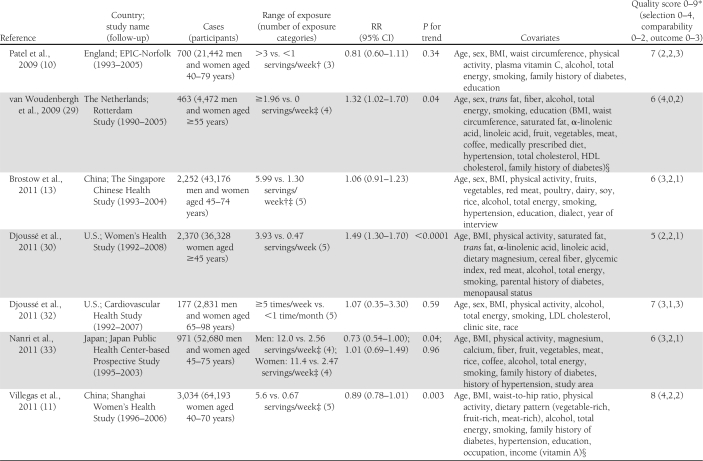
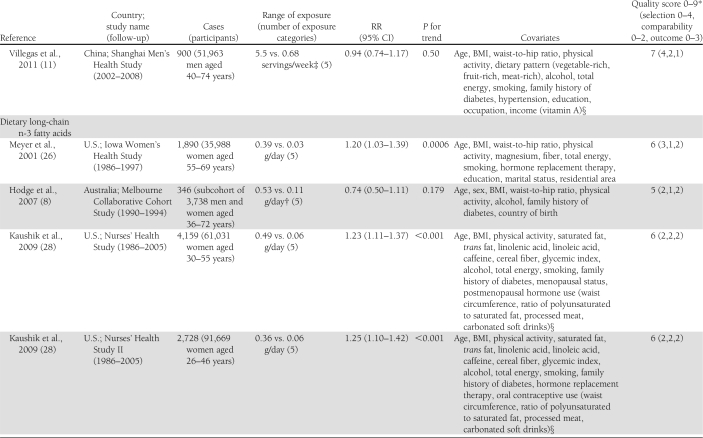
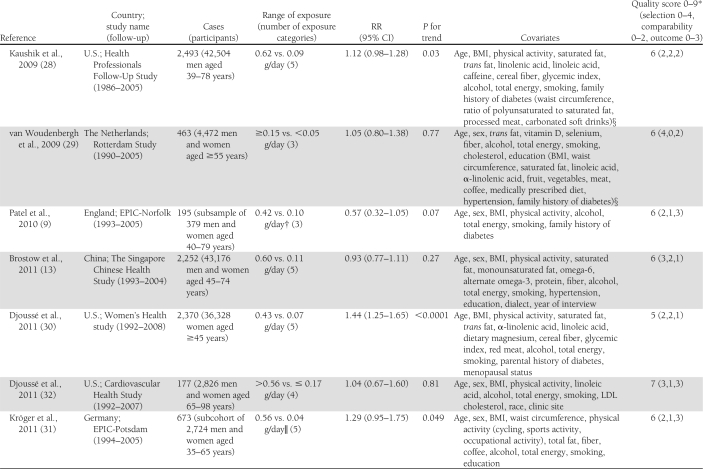
Characteristics of the included studies are presented in Table 1. The 14 articles were published between 2001 and 2011 and involved a total of 527,441 participants and 24,082 cases of diabetes. Two articles reported results from 2 (11) or 3 (28) independent cohorts. Three studies that also assessed biomarkers of fatty acid composition, available only in subsets of the study populations, used a nested case-control design within cohorts with prospective collection of dietary data to study the association between intake of long-chain n-3 fatty acids and risk of type 2 diabetes (8,9,31). Among them, one reported on the association with fish consumption in the whole cohort in a separate article (10). Among the 16 cohorts, 10 assessed both fish consumption and intake of long-chain n-3 fatty acids (9–11,13,28–30,32), whereas 3 reported only on the fatty acids (8,26,31) and 3 only on fish consumption (12,27,33). Seven studies were conducted in the U.S. (26–28,30,32), 4 in Europe (9,10,12,29,31), 4 in Asia (11,13,33), and 1 in Australia (8). All studies reported RRs adjusted for age and sex; all but 2 were further adjusted for total energy intake (8,27), smoking (8,27) and BMI (27,29); and all but 3 were adjusted for physical activity (12,27,29) and alcohol intake (12,26,27). Other covariates were less consistently included in the multivariate models. Eleven studies used self-administered food frequency questionnaires (FFQ) to collect dietary data (8–10,26–28,30–33), whereas 5 used interviewer-administered FFQs (11–13,29). In 1 study, total fish consumption was assessed by a single question (27), whereas it was obtained as the sum of different types of fish in other studies. Long-chain n-3 fatty acids was defined as the sum of EPA and DHA in 11 studies (8,9,11,13,28,29,31,32), as the sum of EPA, DHA, and docosapentenoic acid in 1 study (30), and not further explained in 1 study (26). Six studies updated the dietary information with additional FFQs after baseline (11,28,32). Incident diabetes cases were identified by self-report in 13 studies, of which 7 followed up the information with supplementary questionnaires or interviews (28,30), with physician’s confirmation (8,31), or with linkage to medical registries (9,10). One study used information from general practitioners and pharmacy databases to identify incident cases (29), 1 used medication inventory information together with measurements of fasting glucose (32), and 1 used linkage to a nationwide register of drug reimbursement (12). Among studies that included all self-reported cases (11,13,26,27,33), 2 stated that validity of self-reports was reasonable (13,33) and 1 that results did not differ substantially when using a more strict case definition (11). The mean range of intake between the highest and the lowest category across studies was about 5.0 servings per week for fish and about 0.38 g per day for long-chain n-3 fatty acids. The study quality was generally good, with all but 3 studies (8,27,30) reaching criteria for ≥6 stars on the scale of 9 (14).
Table 1.
Prospective studies on fish consumption, dietary long-chain n-3 fatty acids, and risk of type 2 diabetes
Combined results
The results across all studies were mixed, with positive, inverse, or null associations. For total fish consumption, there was a high degree of heterogeneity between the 13 included studies (I 2 = 81.3%; P < 0.001). For dietary intake of long-chain n-3 fatty acids, substantial heterogeneity was also observed between the 13 included studies (I 2 = 78.3%; P < 0.001). Omitting 1 study at a time showed that neither summary risk estimates nor measures of statistical heterogeneity were markedly influenced by single studies (I 2 range, fish: 70.2–82.8%; long-chain n-3 fatty acids: 73.2–80.1%; P < 0.001). Further, results of the analysis on fish consumption were not substantially affected by changing the approximated average serving size from 100 g to 80 g (I 2 = 82.5%; P < 0.001) or 140 g (I 2 = 78.9%; P < 0.001). Excluding the 3 nested case-control studies on long-chain n-3 fatty acid intake (8,9,31) also had little influence (I 2 = 79.7%; P < 0.001).
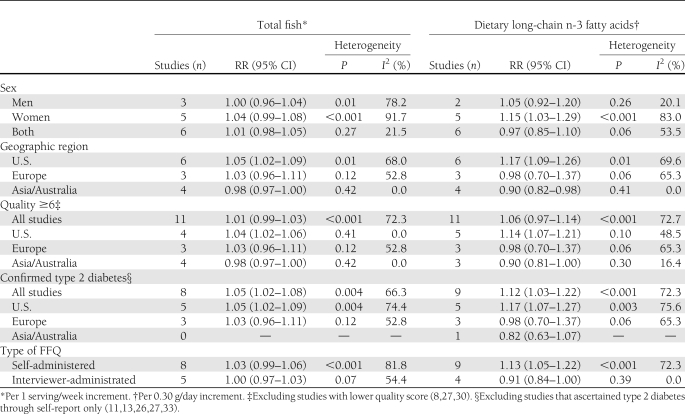
Because of the high degree of heterogeneity, we did not combine results across all studies into an overall summary risk estimate. Results of the sensitivity analyses conducted to investigate potential sources of heterogeneity are shown in Table 2, including stratifications by sex, geographical region, and FFQ type, and exclusion of studies with a quality score <6 (8,27,30) and studies that ascertained type 2 diabetes through self-report only (11,13,26,27,33). There were substantial differences according to geographical region, in part explaining the heterogeneity in the overall estimates.
Table 2.
Summary RRs of type 2 diabetes for an increment of 1 serving/week in total fish consumption and 0.30 g/day in dietary intake of long-chain n-3 fatty acids (corresponding to approximately 1 serving/week of fatty fish)
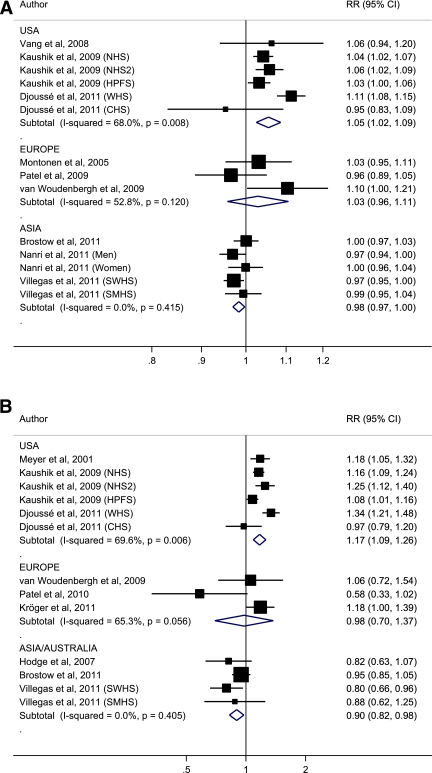
The estimated RRs of type 2 diabetes associated with fish consumption and intake of long-chain n-3 fatty acids are shown in Fig. 2A and B for individual studies and combined by geographical region. For each serving per week increment in total fish consumption, the summary RRs of type 2 diabetes were 1.05 (95% CI 1.02–1.09), 1.03 (0.96–1.11), and 0.98 (0.97–1.00) combining studies from the U.S., Europe, and Asia/Australia, respectively. For each 0.30 g per day increment in dietary long-chain n-3 fatty acid intake (corresponding to approximately one serving per week of fatty fish), the corresponding summary RRs were 1.17 (1.09–1.26), 0.98 (0.70–1.37), and 0.90 (0.82–0.98). Excluding one Australian nested case-control study on long-chain n-3 fatty acid intake (8) did not markedly affect the summary estimate of Asian/Australian studies (0.90 [0.81–1.00]), whereas all six of the U.S. studies were of cohort design, and only a single European cohort study remained after exclusion of two nested case-control studies (9,31) in this subgroup.
Figure 2.
A: RR estimates of type 2 diabetes associated with a one serving per week increment in total fish consumption, for individual studies and combined by geographical region. B: RR estimates of type 2 diabetes associated with a 0.3 g/day increment in dietary intake of long-chain n-3 fatty acids (corresponding to approximately one serving per week of fatty fish), for individual studies and combined by geographical region. (A high-quality color representation of this figure is available in the online issue.)
The Egger test showed no evidence of publication bias for total fish consumption (P = 0.85) or dietary intake of long-chain n-3 fatty acids (P = 0.10). We flexibly modeled the dose-response relationships using restricted cubic splines, and we found no evidence of departure from the simpler linear trends (P nonlinearity = 0.81 for fish; P nonlinearity = 0.76 for long-chain n-3 fatty acids).
CONCLUSIONS
We report the first systematic review and meta-analysis of the prospective association between total fish consumption, dietary intake of long-chain n-3 fatty acids, and risk of incident type 2 diabetes. Results from this large analysis including 24,082 cases of diabetes and 527,441 participants show substantial heterogeneity across study results, potentially explained by differences between geographical regions. The summary risk estimates indicate no association among European studies, a direct association among U.S. studies, and an inverse association among Asian/Australian studies. However, results are also partly inconsistent within study areas, and the number of studies outside the U.S. is limited. Compared with major risk factors for type 2 diabetes, such as overweight and obesity (associated with RRs of 2.99 [95% CI 2.42–3.72] and 7.19 [5.74–9.00] in a recent meta-analysis [34]), the strength of the summary risk estimates in the current study is modest. A 5% increase in risk for each weekly serving of fish in U.S. studies, however, is comparable to risk estimates reported for other dietary factors in relation to type 2 diabetes, such as red meat (1.19 [1.04–1.37] per 100 g per day) (35).
Strengths of this meta-analysis include its large size, and that the assessment was based on data from prospective studies only. This minimizes the possibility that the results were due to recall or selection bias, which are of particular concern in other epidemiological study designs. Recall bias may be especially problematic when studying associations between dietary factors and type 2 diabetes, as diagnosed patients commonly get specific dietary advice and thus may change their habits. In addition, the use of a dose-response approach is superior to the conventional methodology of comparing only the extreme categories of intake, which can vary considerably between studies conducted in different populations. From a public health perspective, a dose-response meta-analysis can provide more useful estimates for better quantifying associations between specified amounts of food and disease risk. However, the approach requires a number of assumptions to be made. In terms of associations between absolute intake levels and disease risk, a meta-analysis can only be as good as the individual study instruments that were used. Dietary questionnaires such as the FFQs are generally more valuable for ranking study participants according to their consumption than for measuring exact consumption levels. In addition, combining results from different studies requires comparing different instruments. Assumptions also had to be made regarding the median level of consumption for each category when this information was missing in the individual studies. Finally, since six studies expressed fish consumption in grams rather than in servings, we had to make assumptions about average serving size.
There are also potential limitations of our findings that must be taken into consideration when interpreting the results. First, a meta-analysis cannot solve inherent problems with confounding in the included studies, which may bias the results toward exaggeration or underestimation of risk estimates. Although most studies controlled for total energy intake, smoking, BMI, physical activity, and alcohol, other factors were less consistently included in the multivariate models. To evaluate the impact of these differences on heterogeneity between studies, we separately combined age- and sex-adjusted (plus race and area where applicable) RR estimates from the 7 studies on fish consumption providing such data (10,27,28,32,33). The statistical heterogeneity in the summary estimate remained (I 2 = 79.5%; P < 0.001), indicating that differences in included covariates is not an important explanation of the differences between studies observed in this meta-analysis. Second, most of the included studies assessed diet with a self-administered FFQ, and in all but 6 studies (11,28,32) dietary intake was based on a single questionnaire administered at baseline. Therefore, our findings are likely to be affected by some misclassification of exposure. In cohort studies, misclassification is generally nondifferential, which most likely attenuates the association. Our meta-analysis included questionnaire data on fatty acid intake, while objectively measured fatty acids (e.g., in plasma phospholipid or erythrocyte membrane fractions) would reduce measurement error. Among the 13 studies included in the meta-analysis of long-chain n-3 fatty acids, 4 used biomarker measurements in addition to intake derived from FFQs (8,9,31,32). Neither EPA nor DHA in plasma phospholipids (8,9,32) or erythrocyte membrane phospholipids (9,31) were significantly associated with risk of type 2 diabetes in individual studies. However, because of the limited number of studies, we did not pool the study-specific risk estimates. Measurement error may potentially also have affected the outcome variable (diabetes incidence) as the result of underreporting of diagnosis in asymptomatic individuals. It is plausible that rates of screening and surveillance may be higher among participants with a healthier lifestyle associated with higher fish consumption, which could lead to greater case ascertainment among such individuals. Further, it is possible that people who are diagnosed with one or several risk factors for diabetes increase their fish consumption as part of a lifestyle change. However, studies that additionally adjusted for hypertension and serum cholesterol (12) restricted analyses to individuals without hypercholesterolemia or hypertension (28), tested for interaction with hypertensive status (13), or excluded participants who were diagnosed with diabetes during the first years of follow-up (11,13,30,31) observed no substantial differences in risk estimates. Finally, in a meta-analysis of published studies, publication bias could be of concern because studies with null results or small sample sizes tend not to be published. However, we found no evidence of publication bias in this meta-analysis.
Intake of long-chain n-3 fatty acids has been hypothesized to have beneficial effects on insulin resistance and type 2 diabetes because of their ability to inhibit inflammatory pathways and suppress expression of genes related to lipid metabolism (5). However, most randomized controlled trials that have examined the effects of long-chain n-3 fatty acid supplementation on insulin sensitivity have found no effects (6). If an association between fish consumption and risk of type 2 diabetes is attributable to a high intake of EPA and DHA, the association should be more evident with fatty than with lean fish. However, only three studies assessed types of fish separately (10,29,33). The Rotterdam study reported positive associations with total and lean fish (accounting for 81% of total fish consumption), but not with fatty fish or with long-chain n-3 fatty acids (29). Results from the European Prospective Investigation of Cancer (EPIC)-Norfolk cohort indicated inverse associations with total, white and oily fish, although statistically significant only for total fish (10). In a subsample of the same cohort, the association with intake of long-chain n-3 fatty acids was nonsignificantly inverse (9). In the Japanese study, risk of type 2 diabetes tended to decrease with oily fish consumption, but not with lean fish among men; no associations were observed with either total or types of fish among women (33). It should also be noted that most studies did not distinguish between preparation methods. It is possible that consumption of fried and deep-fried fish, as well as the use of batter and type of frying media may differ between populations, potentially in part explaining the differences between geographical regions.
In addition to long-chain n-3 fatty acids, fish is an important contributor to selenium intake. Findings from randomized trials indicate that selenium supplementation may be associated with an increased risk of type 2 diabetes (36). In one of the included studies on long-chain n-3 fatty acids, additional adjustment for selenium intake markedly attenuated the risk estimates (29). Regarding vitamin D, another nutrient abundant in fish, there is accumulating evidence that inadequate vitamin D status may be associated with development of type 2 diabetes, but evidence from longitudinal studies measuring circulating 25-hydroxyvitamin D is sparse and inconsistent (37). There is also the potential of adverse effects due to ingestion of contaminated fish. The available evidence of an association between exposure to persistent organic pollutants and risk of type 2 diabetes is relatively consistent (38). However, as it is conceivable that the metabolism of the pollutants could be altered as a consequence of the disease, identification of mechanisms by which these compounds could influence risk is needed to determine if the association reflects a causal relationship (38). Further, fish consumption is one of the major sources of mercury exposure, which has been shown to affect insulin secretion through oxidative stress–induced β-cell dysfunction (39). A recent large scale cross-sectional study suggested that both blood mercury and serum dioxin levels are associated with increased risk of insulin resistance, and that simultaneous exposure additionally increases the risk (40).
In conclusion, results from this meta-analysis indicate differences between geographical regions in observed associations of total fish consumption and dietary intake of long-chain n-3 fatty acids with risk of type 2 diabetes, with an increased risk among studies conducted in the U.S., no association in European populations, and an inverse association in Asian/Australian populations. In consideration of the heterogeneous results, as well as the cardiovascular benefits associated with the studied exposures, the relationship and its possible mechanisms warrant further investigation. Types of fish consumed (lean, fatty, shellfish), dietary factors in fish, as well as preparation methods and levels of contamination, which could vary across different countries, should be comprehensively investigated when the potential role of fish and long-chain n-3 fatty acids in the development of type 2 diabetes is examined in future studies.
Acknowledgments
This work was supported by a research grant from the Swedish Research Council for Environment, Agricultural Sciences and Spatial Planning (FORMAS).
No potential conflicts of interest relevant to this article were reported.
A.Wa., D.D.G., and N.O. contributed to the conception and design of the study and performed statistical analyses. A.Wa. and D.D.G. collected data and drafted the manuscript. A.Wo. contributed to the conception and design of the study. A.Wa., D.D.G., N.O., P.S.P., N.G.F., and A.Wo. contributed to the interpretation of data and critically revised the manuscript for important intellectual content. All authors gave final approval. A.Wa. and D.D.G. are the guarantors of this work and, as such, had full access to all the data in the study and take responsibility for the integrity of the data and the accuracy of the data analysis.
The authors thank Dr. Allison Hodge (The Cancer Council Victoria), Dr. Raquel Villegas (Vanderbilt Epidemiology Center), Dr. Paul Knekt (National Institute for Health and Welfare, Helsinki), and Dr. Andrew O. Odegaard (University of Minnesota) for delivery of original data. The authors also thank the funders, the study team, general practitioners, and participants of the EPIC-Norfolk Study.
Footnotes
This article contains Supplementary Data online at http://care.diabetesjournals.org/lookup/suppl/doi:10.2337/dc11-1631/-/DC1.
References
- 1. Shaw JE, Sicree RA, Zimmet PZ. Global estimates of the prevalence of diabetes for 2010 and 2030. Diabetes Res Clin Pract 2010;87:4–14 [DOI] [PubMed] [Google Scholar]
- 2. Gillies CL, Abrams KR, Lambert PC, et al. Pharmacological and lifestyle interventions to prevent or delay type 2 diabetes in people with impaired glucose tolerance: systematic review and meta-analysis. BMJ 2007;334:299 [DOI] [PMC free article] [PubMed] [Google Scholar]
- 3. He K. Fish, long-chain omega-3 polyunsaturated fatty acids and prevention of cardiovascular disease—eat fish or take fish oil supplement? Prog Cardiovasc Dis 2009;52:95–114 [DOI] [PubMed] [Google Scholar]
- 4. Risérus U, Willett WC, Hu FB. Dietary fats and prevention of type 2 diabetes. Prog Lipid Res 2009;48:44–51 [DOI] [PMC free article] [PubMed] [Google Scholar]
- 5. Deckelbaum RJ, Worgall TS, Seo T. n-3 fatty acids and gene expression. Am J Clin Nutr 2006;83(Suppl.):1520S–1525S [DOI] [PubMed] [Google Scholar]
- 6. Akinkuolie AO, Ngwa JS, Meigs JB, Djoussé L. Omega-3 polyunsaturated fatty acid and insulin sensitivity: A meta-analysis of randomized controlled trials. Clin Nutr 2011;30:702–707 [DOI] [PMC free article] [PubMed] [Google Scholar]
- 7. Moher D, Liberati A, Tetzlaff J, Altman DG; PRISMA Group Preferred reporting items for systematic reviews and meta-analyses: the PRISMA statement. PLoS Med 2009;6:e1000097 [DOI] [PMC free article] [PubMed] [Google Scholar]
- 8. Hodge AM, English DR, O’Dea K, et al. Plasma phospholipid and dietary fatty acids as predictors of type 2 diabetes: interpreting the role of linoleic acid. Am J Clin Nutr 2007;86:189–197 [DOI] [PubMed] [Google Scholar]
- 9. Patel PS, Sharp SJ, Jansen E, et al. Fatty acids measured in plasma and erythrocyte-membrane phospholipids and derived by food-frequency questionnaire and the risk of new-onset type 2 diabetes: a pilot study in the European Prospective Investigation into Cancer and Nutrition (EPIC)-Norfolk cohort. Am J Clin Nutr 2010;92:1214–1222 [DOI] [PubMed] [Google Scholar]
- 10. Patel PS, Sharp SJ, Luben RN, et al. Association between type of dietary fish and seafood intake and the risk of incident type 2 diabetes: the European prospective investigation of cancer (EPIC)-Norfolk cohort study. Diabetes Care 2009;32:1857–1863 [DOI] [PMC free article] [PubMed] [Google Scholar]
- 11. Villegas R, Xiang YB, Elasy T, et al. Fish, shellfish, and long-chain n-3 fatty acid consumption and risk of incident type 2 diabetes in middle-aged Chinese men and women. Am J Clin Nutr 2011;94:543–551 [DOI] [PMC free article] [PubMed] [Google Scholar]
- 12. Montonen J, Järvinen R, Heliövaara M, Reunanen A, Aromaa A, Knekt P. Food consumption and the incidence of type II diabetes mellitus. Eur J Clin Nutr 2005;59:441–448 [DOI] [PubMed] [Google Scholar]
- 13. Brostow DP, Odegaard AO, Koh WP, et al. Omega-3 fatty acids and incident type 2 diabetes: the Singapore Chinese Health Study. Am J Clin Nutr 2011;94:520–526 [DOI] [PMC free article] [PubMed] [Google Scholar]
- 14.Wells G, Shea B, O'Connell D, et al. The Newcastle-Ottawa Scale (NOS) for assessing the quality of nonrandomised studies in meta-analyses [article online]. Ottawa, Ontario, Canada, Department of Epidemiology and Community Medicine, University of Ottawa. Available from http://www.ohri.ca/programs/clinical_epidemiology/oxford.asp Accessed 2 March 2011
- 15. Orsini N, Bellocco R, Greenland S. Generalized least squares for trend estimation of summarized dose-response data. Stata J 2006;6:40–57 [Google Scholar]
- 16. Jackson D, White IR, Thompson SG. Extending DerSimonian and Laird’s methodology to perform multivariate random effects meta-analyses. Stat Med 2010;29:1282–1297 [DOI] [PubMed] [Google Scholar]
- 17. Higgins JP, Thompson SG. Quantifying heterogeneity in a meta-analysis. Stat Med 2002;21:1539–1558 [DOI] [PubMed] [Google Scholar]
- 18. Sterne JA, Egger M, Smith GD. Systematic reviews in health care: Investigating and dealing with publication and other biases in meta-analysis. BMJ 2001;323:101–105 [DOI] [PMC free article] [PubMed] [Google Scholar]
- 19. Kiyohara Y, Shinohara A, Kato I, et al. Dietary factors and development of impaired glucose tolerance and diabetes in a general Japanese population: the hisayama study. J Epidemiol 2003;13:251–258 [DOI] [PMC free article] [PubMed] [Google Scholar]
- 20. Salmerón J, Hu FB, Manson JE, et al. Dietary fat intake and risk of type 2 diabetes in women. Am J Clin Nutr 2001;73:1019–1026 [DOI] [PubMed] [Google Scholar]
- 21. Feskens EJ, Virtanen SM, Räsänen L, et al. Dietary factors determining diabetes and impaired glucose tolerance. A 20-year follow-up of the Finnish and Dutch cohorts of the Seven Countries Study. Diabetes Care 1995;18:1104–1112 [DOI] [PubMed] [Google Scholar]
- 22. Feskens EJ, Bowles CH, Kromhout D. Inverse association between fish intake and risk of glucose intolerance in normoglycemic elderly men and women. Diabetes Care 1991;14:935–941 [DOI] [PubMed] [Google Scholar]
- 23. Harding AH, Day NE, Khaw KT, et al. Dietary fat and the risk of clinical type 2 diabetes: the European prospective investigation of Cancer-Norfolk study. Am J Epidemiol 2004;159:73–82 [DOI] [PubMed] [Google Scholar]
- 24. van Dam RM, Willett WC, Rimm EB, Stampfer MJ, Hu FB. Dietary fat and meat intake in relation to risk of type 2 diabetes in men. Diabetes Care 2002;25:417–424 [DOI] [PubMed] [Google Scholar]
- 25. Schulze MB, Manson JE, Willett WC, Hu FB. Processed meat intake and incidence of Type 2 diabetes in younger and middle-aged women. Diabetologia 2003;46:1465–1473 [DOI] [PubMed] [Google Scholar]
- 26. Meyer KA, Kushi LH, Jacobs DR, Jr, Folsom AR. Dietary fat and incidence of type 2 diabetes in older Iowa women. Diabetes Care 2001;24:1528–1535 [DOI] [PubMed] [Google Scholar]
- 27. Vang A, Singh PN, Lee JW, Haddad EH, Brinegar CH. Meats, processed meats, obesity, weight gain and occurrence of diabetes among adults: findings from Adventist Health Studies. Ann Nutr Metab 2008;52:96–104 [DOI] [PubMed] [Google Scholar]
- 28. Kaushik M, Mozaffarian D, Spiegelman D, Manson JE, Willett WC, Hu FB. Long-chain omega-3 fatty acids, fish intake, and the risk of type 2 diabetes mellitus. Am J Clin Nutr 2009;90:613–620 [DOI] [PMC free article] [PubMed] [Google Scholar]
- 29. van Woudenbergh GJ, van Ballegooijen AJ, Kuijsten A, et al. Eating fish and risk of type 2 diabetes: A population-based, prospective follow-up study. Diabetes Care 2009;32:2021–2026 [DOI] [PMC free article] [PubMed] [Google Scholar]
- 30. Djoussé L, Gaziano JM, Buring JE, Lee IM. Dietary omega-3 fatty acids and fish consumption and risk of type 2 diabetes. Am J Clin Nutr 2011;93:143–150 [DOI] [PMC free article] [PubMed] [Google Scholar]
- 31. Kröger J, Zietemann V, Enzenbach C, et al. Erythrocyte membrane phospholipid fatty acids, desaturase activity, and dietary fatty acids in relation to risk of type 2 diabetes in the European Prospective Investigation into Cancer and Nutrition (EPIC)-Potsdam Study. Am J Clin Nutr 2011;93:127–142 [DOI] [PubMed] [Google Scholar]
- 32. Djoussé L, Biggs ML, Lemaitre RN, et al. Plasma omega-3 fatty acids and incident diabetes in older adults. Am J Clin Nutr 2011;94:527–533 [DOI] [PMC free article] [PubMed] [Google Scholar]
- 33. Nanri A, Mizoue T, Noda M, et al. ; Japan Public Health Center-based Prospective Study Group Fish intake and type 2 diabetes in Japanese men and women: the Japan Public Health Center-based Prospective Study. Am J Clin Nutr 2011;94:884–891 [DOI] [PubMed] [Google Scholar]
- 34. Abdullah A, Peeters A, de Courten M, Stoelwinder J. The magnitude of association between overweight and obesity and the risk of diabetes: a meta-analysis of prospective cohort studies. Diabetes Res Clin Pract 2010;89:309–319 [DOI] [PubMed] [Google Scholar]
- 35. Pan A, Sun Q, Bernstein AM, et al. Red meat consumption and risk of type 2 diabetes: 3 cohorts of US adults and an updated meta-analysis. Am J Clin Nutr 2011;94:1088–1096 [DOI] [PMC free article] [PubMed] [Google Scholar]
- 36. Stranges S, Marshall JR, Natarajan R, et al. Effects of long-term selenium supplementation on the incidence of type 2 diabetes: a randomized trial. Ann Intern Med 2007;147:217–223 [DOI] [PubMed] [Google Scholar]
- 37. Pittas AG, Chung M, Trikalinos T, et al. Systematic review: Vitamin D and cardiometabolic outcomes. Ann Intern Med 2010;152:307–314 [DOI] [PMC free article] [PubMed] [Google Scholar]
- 38. Carpenter DO. Environmental contaminants as risk factors for developing diabetes. Rev Environ Health 2008;23:59–74 [DOI] [PubMed] [Google Scholar]
- 39. Chen YW, Yang CY, Huang CF, Hung DZ, Leung YM, Liu SH. Heavy metals, islet function and diabetes development. Islets 2009;1:169–176 [DOI] [PubMed] [Google Scholar]
- 40. Chang JW, Chen HL, Su HJ, Liao PC, Guo HR, Lee CC. Simultaneous exposure of non-diabetics to high levels of dioxins and mercury increases their risk of insulin resistance. J Hazard Mater 2011;185:749–755 [DOI] [PubMed] [Google Scholar]


