

Loss of interaction between the dystonin-a2 isoform and the microtubule-associated protein MAP1B induces microtubule instability and trafficking defects that may underlie certain neuropathies.
Abstract
Loss of function of dystonin cytoskeletal linker proteins causes neurodegeneration in dystonia musculorum (dt) mutant mice. Although much investigation has focused on understanding dt pathology, the diverse cellular functions of dystonin isoforms remain poorly characterized. In this paper, we highlight novel functions of the dystonin-a2 isoform in mediating microtubule (MT) stability, Golgi organization, and flux through the secretory pathway. Using dystonin mutant mice combined with isoform-specific loss-of-function analysis, we found dystonin-a2 bound to MT-associated protein 1B (MAP1B) in the centrosomal region, where it maintained MT acetylation. In dt neurons, absence of the MAP1B–dystonin-a2 interaction resulted in altered MAP1B perikaryal localization, leading to MT deacetylation and instability. Deacetylated MT accumulation resulted in Golgi fragmentation and prevented anterograde trafficking via motor proteins. Maintenance of MT acetylation through trichostatin A administration or MAP1B overexpression mitigated the observed defect. These cellular aberrations are apparent in prephenotype dorsal root ganglia and primary sensory neurons from dt mice, suggesting they are causal in the disorder.
Introduction
Dystonia musculorum (dt) is an inherited homozygous recessive sensory neuropathy in mice caused by mutations in the dystonin (Dst) gene (Duchen et al., 1964; Brown et al., 1995). In early postnatal development, dt mice lose control of the forelimbs, hind limbs, and trunk and subsequently die of unknown causes (Duchen, 1976). The Dst gene is remarkably large (∼400 kb in mice) and gives rise to three tissue-specific dystonin isoforms, namely dystonin-e (epithelial isoform, ∼315 kD), dystonin-b (muscle isoform, ∼834 kD), and dystonin-a (neuronal isoform, ∼615 kD; Sawamura et al., 1991; Brown et al., 1995; Leung et al., 2001; Okumura et al., 2002). Although dystonin-e serves as an autoantigen in the skin-blistering disease bullous pemphigoid, loss of function of a dystonin-a isoform or isoforms is believed to be causal in the dt disorder (Kothary et al., 1988; Sawamura et al., 1991; Brown et al., 1995; Pool et al., 2005). Three neuronal isoforms are derived through alternative splicing, namely dystonin-a1, dystonin-a2, and dystonin-a3 (Young and Kothary, 2007). These isoforms share an N-terminal actin-binding domain, an extensive coiled-coil region, and a C-terminal microtubule (MT)-binding domain, allowing for interactions with cytoskeletal filaments and facilitating their function as cytoskeletal linkers (Leung et al., 2001). Although the dystonin-a isoforms share similar domain architecture, it is their unique N-terminal regions that differentiate them and dictate their subcellular localization. Specifically, dystonin-a1 encodes a short N-terminal domain that includes an actin-binding domain, localizing it to actin filaments, whereas dystonin-a2 possesses a transmembrane domain localizing it to the nuclear envelope and perinuclear membranes, and dystonin-a3 possesses a putative myristoylation domain, aiding in anchoring to the plasma membrane (PM; Jefferson et al., 2006; Young et al., 2006). Loss of the neuronal dystonin isoforms has been attributed to degeneration of both sensory and motor neurons (Brown et al., 1995; Guo et al., 1995; De Repentigny et al., 2011).
Several dt alleles exist through spontaneous mutations (dt27J and dtAlb), chemically induced mutations (dt37J and dt33J), targeted alleles (dttm1Efu), and transgenic insertions (dtTg4; Pool et al., 2005). Although only three dt mutations (dtTg4, dttm1Efu, and dtAlb) have been characterized at the DNA level, dtTg4 and dt27J are allelic and do not complement (Kothary et al., 1988; Guo et al., 1995; Bernier et al., 1998). To date, dt pathologies have been recorded in motor neurons, skeletal muscle, and Schwann cells, but degeneration is most prominent in dorsal root ganglia (DRG) sensory neurons (Dowling et al., 1997; Bernier et al., 1998; Dalpé et al., 1999; De Repentigny et al., 2011). Although dt pathology has been thoroughly examined, evidence explaining the mechanisms of dt pathogenesis remains elusive. Moreover, it is unresolved as to whether loss of a single isoform or combination of isoforms is responsible for the neurodegeneration.
The consensus regarding this degenerative event is that it arises as a result of loss of structural organization of cytoskeletal elements (Yang et al., 1996, 1999). The numerous functions of the cytoskeleton have made elucidating the mechanism underlying dt pathogenesis challenging. The present study therefore aims to elucidate the mechanism of sensory neuron degeneration underlying dt pathogenesis to further our understanding of the diverging functions of dystonin isoforms. We have previously determined that the dystonin-a2 isoform is involved in nuclear envelope structuring, nuclear tethering, and organization of membranous structures surrounding the nucleus (Young et al., 2003, 2006; Young and Kothary, 2008). Here, we use expression profiling of prephenotype DRGs to identify early aberrations in biological processes. We find defects in anterograde transport and secretion coupled with ultrastructural dilation of the Golgi complex and loss of MT acetylation, which precede phenotype onset. Through isoform-specific loss-of-function analysis, we identify a novel role for the dystonin-a2 isoform in mediating MT acetylation and stability. Through interaction with the MT-associated protein 1B (MAP1B), dystonin-a2 maintains perinuclear acetylation of α-tubulin necessary for discrete organization of the Golgi complex. Maintenance of MT acetylation status through chemical inhibition of deacetylation or MAP1B overexpression maintains Golgi structure after dystonin-a2 loss, normalizing flux through the secretory pathway. Moreover, dystonin-a2 is critical for MAP1B localization at the centrosome. Collectively, these findings provide needed insight into how aberrant cytoskeletal linkage may participate in dysfunctional neuronal signaling in multiple neurodegenerative pathologies and identify a novel function for the dystonin-a2 protein.
Results
To gain a better understanding of the mechanism underlying the specific pathological decline of dt sensory neurons, we first conducted expression profiling of DRGs from prephenotype wild-type (WT) and dt27J mice. Differentially expressed genes were clustered based on gene ontology (GO), and enrichment analysis of those biological processes among up-regulated (1,580 genes) or down-regulated (1,809 genes) genes was preformed to identify early changes in cellular processes that may predict mechanistic functions of dystonin proteins (Fig. 1). Not surprisingly, several processes associated with cytoskeletal organization were aberrant, including MT polymerization and axon guidance. In addition, there was an indication of early apoptotic signal transduction coupled with enhanced cell cycle and differentiation, likely to compensate for cytodegeneration. The most significantly down-regulated biological process in prephenotype dt27J DRGs, however, was transport (Fig. 1). We thus sought to determine whether this expression profile translated into impairment of intracellular transport and a role for dystonin isoforms in mediating vesicle trafficking.
Figure 1.

GO enrichment map of biological processes altered in prephenotype dt27J mice. mRNA expression profiling of P4 WT (n = 3) and dt27J (n = 3) DRGs. Genes were clustered based on GO term, and an enrichment map of those biological processes up-regulated (left) or down-regulated (right) in prephenotype dt27J DRGs relative to WT littermates is depicted. Each node represents one GO term. The node size represents the number of genes clustered to each GO term, node color reflects the significance of the enrichment above the background of the entire mouse genome (white shows most significant, and black shows least significant; significance cut is P < 0.05, Fisher’s exact test), and edge length reflects the similarity between GO terms. Clusters of functionally related gene sets were manually circled and assigned a label representative of the overall biological process. The most significantly down-regulated biological process in prephenotype dt27J DRGs is transport.
Analysis of the specific biological processes (Table 1) altered within the enriched transport cluster lead us to focus on anterograde transport and components of the secretory pathway. Indeed, protein validation of down-regulated target genes indicated that expression of components of the kinesin motor complex (Fig. S1) were in fact, decreased in dt27J DRGs. We thus assessed flux through the secretory pathway in primary sensory neurons from prephenotype (postnatal day 4 [P4]) and phenotype (P15) stage dt27J mice (Fig. 2, A–C). Lentiviral vector encoding the secreted YFP-Gaussia luciferase (GLuc) was delivered to cells, and GLuc secretion was monitored by measuring luciferase activity in the medium over time. P4 and P15 dt27J neurons show a decrease in flux through the secretory pathway relative to WT sensory neurons (Fig. 2, B and C), indicating that an impairment of protein transport exists in dt sensory neurons before phenotype onset in mice.
Table 1.
Selected GO biological processes significantly enriched among genes down-regulated in prephenotype DRGs from dt27J mice
| Category | Targets | P-value | Fold enrichment | Example gene products |
| Transport | 561 | 4.30 E−20 | 1.4 | DLC2, KCL2, and DNM1 |
| Vesicle-mediated transport | 125 | 8.90 E−08 | 1.7 | DNM1, CLTB, and HTT |
| Cytoskeleton organization | 77 | 6.50 E−03 | 1.5 | DNAHC9, MAPT, and TUBGCP2 |
| Synaptic transmission | 76 | 4.30 E−15 | 2.7 | APBA1, CDK5, and KIF1B |
| Neurotransmitter secretion | 21 | 3.30 E−06 | 3.7 | SYN1, SYN2, and VAMP2 |
| MT bundle formation | 14 | 3.70 E−04 | 4.5 | TPPP, MAP1B, and SPAST |
The p-values given are using Fisher’s exact test with correction for multiple hypothesis testing by the algorithm of Benjamini and Hochberg (1995). The background set of genes used was the entire mouse genome.
Figure 2.

Loss of dystonin impedes flux through the secretory pathway. Flux through the secretory pathway was assessed in primary sensory neurons. (A) GLuc was delivered to cells, and its secretion was monitored by measuring luciferase activity in the medium over time. (B and C) P4 (B) and P15 (C) dt27J neurons show a decrease in flux through the secretory pathway relative to WT sensory neurons. Data are expressed as fold change relative to WT 20 min (ANOVA posthoc Tukey; *, P < 0.05; n = 4–8). (D and E) Isoform-specific silencing of dystonin (Dst)-a1 and -a2 isoforms in 293T cells was confirmed on a protein (D) and mRNA (E) level. (F) Isoform-specific silencing of dystonin-a1 and -a2 isoforms or combined silencing in 293T cells has no impact on MACF1 mRNA levels. (G–J) Defective trafficking of VSVG from the ER to the Golgi after loss of dystonin-a2. Arrows depict Golgi-associated VSVG at 20 min and PM-associated VSVG at 1 h, whereas arrowheads depict aberrant VSVG localization (H). Although trafficking to the PM was retarded in both dystonin-a1 and dystonin-a2 knockdown cells at 1 h (G and I), only loss of dystonin-a2 showed a persisting defect at 24 h (G [arrows] and J). ANOVA posthoc Dunnett’s t test; **, P < 0.01; n = 6. Error bars show means ± SEM. Cont, control. Bars, 10 µm.
The null mutation in dt27J precludes expression of all dystonin isoforms. The diverging cellular localization of the three neuronal isoforms of dystonin implicates each protein at different stages of secretion. Characterizations of other allelic mutations (dtTg4) resulting in dt have shown that expression of dystonin-a3 is insufficient to rescue phenotype (Young and Kothary, 2007). The known expression profile of dystonin-a1 and dystonin-a2 proteins in DRG tissue leads us to focus on these proteins for mechanistic analysis (Pool et al., 2005; Young and Kothary, 2007). To identify the role of each dystonin isoform in intracellular transport, we used loss-of-function analysis in 293T cells. Microarray and proteomic analysis of 293T cells has revealed that these cells express several cytoskeletal components characteristic of neurons (Shaw et al., 2002). As such, we find that 293T cells endogenously express dystonin-a1 and dystonin-a2 (Fig. 2 E and Fig. S1, C and G). Isoform-specific silencing of dystonin-a1 and dystonin-a2 was confirmed on a protein (Fig. 2 D) and mRNA (Fig. 2 E and Fig. S1 G) level. To determine whether dystonin knockdown had an impact on the expression of a closely related spectraplakin, MT–actin cross-linking factor 1 (MACF1), we monitored the level of MACF1 transcripts in 293T cells silenced for dystonin-a1, dystonin-a2, or both. There was no compensatory increase in MACF1 levels under any of the experimental conditions (Fig. 2 F). To evaluate anterograde transport in a compartmentalized fashion, we traced the movement of YFP-tagged VSV-Gts0–45 (VSVG) through the secretory pathway. By regulating cellular temperature, unfolded VSVG can be loaded into the ER and then visualized as it traffics to the Golgi, where the protein temporarily accumulates while undergoing N-glycosylation. Trafficking continues to the PM, where the protein ultimately deposits. VSVG packaged into an adenoviral vector was administered to 293T cells after isoform-specific silencing of dystonin. Kinetic visualization of VSVG trafficking from the ER to the Golgi (Fig. 2, G and H) showed a defect in transport after loss of dystonin-a2. We confirmed these defects were specific to cells in which dystonin had been depleted using RFP-tagged shRNAs to total dystonin (Fig. S1, D–F). Subsequently, we confirmed that this effect was not caused by impaired protein folding or ER exit, as folded VSVG protein was readily detectable (Fig. S2). Although trafficking to the PM was retarded in both dystonin-a1 and dystonin-a2 knockdown at 1 h (Fig. 2, G and I), only loss of dystonin-a2 showed a persistent defect (Fig. 2, G and J). Collectively, these data indicate that a defect in flux through the secretory pathway in dt sensory neurons may exist prephenotype and is likely the combined result of the loss of multiple dystonin isoforms.
To address the varying degree to which loss of each isoform contributed to the transport defect and whether either isoform is functional in the normal transport process, we attempted to differentiate the cytoskeletal aberrations resulting from loss of each isoform. In a healthy cell, the MT network should distribute uniformly from the cell center to the cortex of the cell. After either dystonin-a1 or dystonin-a2 silencing, the MT network of cells appeared abnormal, with compact and dense packs of MTs in the center and significantly decreased density in the periphery (Fig. 3 A). Furthermore, peripheral MTs failed to reach the cell cortex, with the greatest deficiency evident after dystonin-a2 loss (Fig. 3 B). Full-length epitope-tagged dystonin-a2 (dystonin-a2–myc) colocalizes with α-tubulin in the perinuclear region of the cell (Fig. 3 C). This suggests that the observed defect is not a failure of MT anchoring to the cell cortex but rather compromised MT stability and organization. We confirmed that dystonin-a2 mediated MT stability by challenging 293T cells with nocodazole. Cells overexpressing dystonin-a2–myc maintain polymerized MTs relative to nontransfected cells in the presence of nocodazole (Fig. 3 D). We thus examined the acetylation status of α-tubulin as a marker of MT stability and found a significant reduction in acetylated (Ac) α-tubulin after specific loss of dystonin-a2 (Fig. 3, E–G). This decrease in Ac–α-tubulin was most prominent in the perinuclear region of the cell where dystonin-a2 localization was observed (Fig. 3 G). We confirmed that MT acetylation status was decreased in the perinuclear region of primary sensory neurons from prephenotype (Fig. 4 A) and phenotype (Fig. 4 B) stage mice as well as in tissue (Fig. 4, C–F). We expanded this analysis to include assessment of tubulin tyrosination (ty). Although minor dynamic changes in ty–α-tubulin expression were observed, no significant change in the ratio of ty–α-tubulin to total α-tubulin could be detected (Fig. 3 E and Fig. S1 H). MT acetylation has previously been shown to promote anterograde transport via the kinesin motor complex (Reed et al., 2006). We thus sought to determine the impact of MT acetylation on transport in dt. The prominence of defects resulting from loss of dystonin-a2 led us to focus on this isoform as a mediator of cytoskeletal organization critical to anterograde transport.
Figure 3.

Loss of dystonin-a2 reduces α-tubulin acetylation status. (A and B) Loss of either dystonin-a1 or dystonin-a2 in 293T cells results in disorganization of the MTs relative to the actin cortex (ANOVA posthoc Dunnett’s t test; *, P < 0.05; **, P < 0.01; n = 9–12). Insets show that MTs do not extend to the actin cortex after dystonin silencing. (C) Dystonin-a2 colocalizes with α-tubulin in the perinuclear region. (D) Overexpression of dystonin-a2–myc stabilizes MTs in 293T cells as indicated by conferring resistance to nocodazole-mediated depolymerization of α-tubulin (compare the protected cell depicted by arrows vs. the susceptible cell depicted by arrowheads). (E–G) 293T Western blot (E) and immunofluorescent analysis (G) of Ac–α-tubulin after dystonin depletion. (F) Quantification of the normalized ratio of Ac–α-tubulin to total α-tubulin showed a significant decrease in Ac–α-tubulin after dystonin-a2 depletion (ANOVA posthoc Dunnett’s t test; *, P < 0.05; n = 4). (G) Note the decrease in Ac–α-tubulin in the perinuclear region of the cell after dystonin-a2 silencing (arrows vs. arrowheads). Error bars show means ± SEM. Tub, tubulin; Cont, control; Dst, dystonin. Bars, 10 µm.
Figure 4.

MT acetylation is reduced in DRGs and primary sensory neurons of dt27J mice. (A and B) P4 (A) and P15 (B) analysis of tubulin acetylation state. Decreased Ac–α-tubulin is evident in dt27J sensory neurons relative to WT in the perinuclear region (arrows vs. arrowheads). (C–F) Western blot analysis of DRG tissue at P4 (C and D) and P15 (E and F) also shows decreased Ac–α-tubulin in dt27J relative to WT samples. Each lane represents DRGs from one animal. (Student’s t test; *, P < 0.05; **, P < 0.01; n = 3). Error bars show means ± SEM. Tub, tubulin. Bars, 10 µm.
Trichostatin A (TSA) inhibits class II histone deacetylases and, in this respect, has been shown to promote MT acetylation (Matsuyama et al., 2002). We used TSA to maintain MT acetylation status after dystonin-a2 silencing. Western blot analysis of the 293T lysate shows that TSA treatment maintains the α-tubulin acetylation state after depletion of dystonin-a2 (Fig. 5 A). Subsequent evaluation of anterograde transport showed that TSA promotes VSVG trafficking to the Golgi (Fig. 5, B and C) and PM (Fig. 5, B and D) after dystonin-a2 depletion. To evaluate whether MT acetylation status could impact on anterograde transport in dt, primary DRG neurons from prephenotype and phenotype stage mice were treated for 24 h with TSA, and GLuc secretion into culture media was assessed. TSA returned GLuc flux through the secretory pathway to WT levels in both P4 (Fig. 5 E) and P15 (Fig. 5 F) dt27J sensory neurons.
Figure 5.
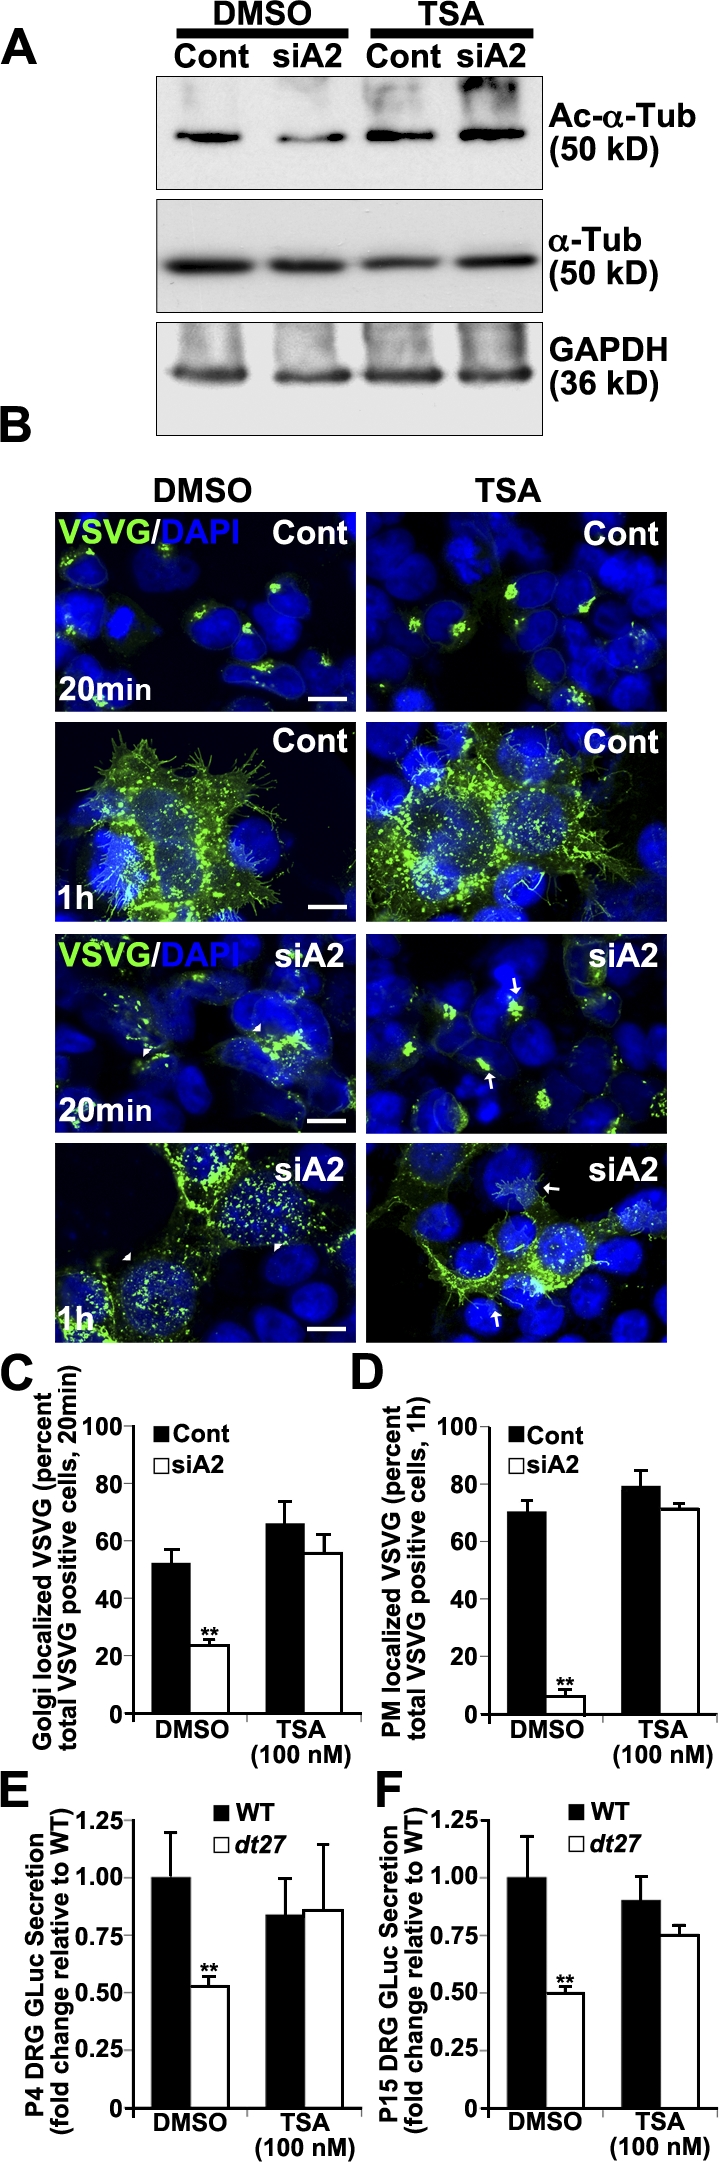
Maintaining Ac–α-tubulin status permits flux through the secretory pathway after dystonin depletion. (A) Western blot analysis of 293T cell lysate shows that TSA treatment maintains Ac–α-tubulin after depletion of dystonin-a2. (B) TSA promotes VSVG trafficking to the Golgi and PM after dystonin-a2 depletion relative to DMSO-treated control. Arrowheads identify aberrantly localized VSVG molecules, whereas arrows identify normal VSVG localization. (C and D) Quantification of TSA impact on VSVG accumulation in the Golgi (C) and at the PM (D; ANOVA posthoc Tukey; n = 3). (E and F) TSA promotes GLuc flux through the secretory pathway (time = 1 h) in P4 (E) and P15 (F) dt27J sensory neurons (ANOVA posthoc Tukey; n = 6). Error bars show means ± SEM. Cont, control; Tub, tubulin. **, P < 0.01. Bars, 10 µm.
In characterizing the defect in VSVG trafficking after dystonin-a2 silencing in 293T cells, we found that although VSVG protein never organized into a discrete Golgi pattern, colocalization with the cis-Golgi marker GM130 was observed nonetheless (Fig. 6 A). Further analysis of Golgi morphology indicated that loss of dystonin-a2 in 293T cells promotes Golgi fragmentation (Fig. 6, B and C). We have previously reported that the transmembrane domain of dystonin-a2 positions the protein in perinuclear membranes, including the cis-Golgi (Young and Kothary, 2008). We thus sought to evaluate the ultrastructure of Golgi in WT and dt27J DRGs. Electron micrographs of P4 and P15 WT and dt27J DRG sections show dilated Golgi in sensory neurons of dt27J mice before phenotype onset (Fig. 6, D–G). Furthermore, although Golgi stacking appears normal, laterally adjacent Golgi vesicles are disconnected, suggesting that Golgi ribboning may be impeded. These data suggest a role for dystonin in organization of Golgi membranes. A close spatial temporal association is known to exist between Ac–α-tubulin and cis-Golgi (Skoufias et al., 1990; Thyberg and Moskalewski, 1993). We thus sought to determine whether a change in MT acetylation status after dystonin loss was related to Golgi fragmentation in dt.
Figure 6.

Loss of dystonin-a2 alters Golgi morphology. (A) VSVG localizes with cis-Golgi marker GM130 despite inability to traffic in 293T cells deficient in dystonin-a2. (B and C) Loss of dystonin-a2 in 293T cells promotes Golgi fragmentation (Student’s t test; n = 3). (A and B) Arrows depict compact Golgi, whereas arrowheads depict dispersed Golgi. (D) Electron micrograph of P4 and P15 WT and dt27J DRG sections show dilated Golgi in sensory neurons of dt27J mice. Arrowheads depict the cis-Golgi face, whereas asterisks depict dilated Golgi vesicles. (E–G) Ultrastructural analysis of dt27J Golgi showed increased area at P4 and P15 relative to WT littermates and an increase in the number of dilated Golgi per animal (Student’s t test; n = 4). Error bars show means ± SEM. Cont, control; M, mitochondria; RER, rough ER. **, P < 0.01. Bars: (A and B) 10 µm; (D) 500 nm.
Silencing of dystonin-a2 in 293T cells results in decreased MT acetylation coupled with reorganization of the cis-Golgi (Fig. 7 A). This phenomenon also occurs in cultured sensory neurons from dt27J mice (Fig. 7 B). 3D rendering shows reduced Ac–α-tubulin coupled to a decrease in GM130 antigenic labeling in the cell soma of P15 primary sensory neurons from dt27J mice compared with WT. To determine whether loss of Golgi organization was impacted upon by MT acetylation status, we treated cells with TSA before dystonin-a2 depletion. Maintenance of MT acetylation status with TSA decreased Golgi fragmentation after dystonin-a2 silencing (Fig. 7, C and D). Ac–α-tubulin is often found in MTs polymerized via the Golgi complex (Chabin-Brion et al., 2001) and is implicated in Golgi-mediated MT nucleation. This coupled with prephenotype gene expression data from dt DRGs implicates impaired MT nucleation/polymerization as a component of dt pathology. Nocodazole washout of 293T cells after dystonin-a2 depletion, however, showed that noncentrosomal MT nucleation proceeds, albeit from dispersed cellular locations after dystonin-a2 depletion (Fig. 7 E, siA2, 30 s, arrow). Centrosomal MT nucleation, however, is moderately delayed after dystonin-a2 loss relative to dystonin-a1–depleted or control cells, normalizing soon after nocodazole is removed (Fig. 7 E). Centrosomal positioning and MT polymerization toward the leading edge of the cell require Golgi components to proceed normally (Bisel et al., 2008; Lowe, 2011). Although noncentrosomal nucleation was observed, chronically fragmented Golgi caused by dystonin loss would have a net negative impact on centrosomal MT polymerization. This coupled with MT instability caused by deacetylation may explain defective anterograde transport processes. No direct role for dystonin in the posttranslational modification of MTs has previously been reported. We recently conducted a proteomic screen of dystonin binding partners and identified a strong interaction between the MT-associated protein MAP1B and the plakin domain of dystonin (Bhanot et al., 2011). Interestingly, a functional role in maintaining Ac–α-tubulin has been attributed to MAP1B (Takemura et al., 1992). MAP1B overexpression in the presence and absence of nocodazole demonstrated that MAP1B could maintain tubulin acetylation status in the face of nocodazole treatment, indicating an increase in MT stability (Fig. S3 C). We therefore set out to verify whether loss of this interaction has a causal implication to dt pathology.
Figure 7.

Impaired MT acetylation results in Golgi fragmentation after loss of dystonin-a2. (A) Silencing of dystonin-a2 in 293T cells results in decreased MT acetylation coupled with reorganization of the Golgi complex. cis-Golgi (GM130) tightly associates with Ac–α-tubulin (arrows vs. arrowheads). (B) 3D rendering of P15 primary sensory neurons from WT and dt27J mice. dt27J sensory neurons show reduced Ac–α-tubulin coupled to a decrease GM130 antigenic labeling in the cell soma. (C and D) Maintenance of MT acetylation status with TSA prevents Golgi fragmentation after depletion of dystonin-a2 (ANOVA posthoc Tukey; *, P < 0.05; n = 6). Arrows depict compact Golgi, whereas arrowheads depict dispersed Golgi. (E) Nocodazole washout of 293T cells after dystonin-a2 depletion shows that MT nucleation from the centrosome is moderately delayed after dystonin-a2 depletion but not dystonin-a1 silencing. Arrows identify sites of MT polymerization. After dystonin-a2 silencing, centrosomal MT polymerization is impeded (arrowhead). Error bars show means ± SEM. Cont, control; Tub, tubulin. Bars, 10 µm.
We first characterized the interaction between MAP1B and dystonin-a2 in our system. Confocal microscopy of recombinant dystonin-a2 and MAP1B-GFP shows colocalization at the perinuclear cytoskeleton (Fig. 8 A). We confirmed the proximity of these proteins using the proximity ligation assay. Recombinant dystonin-a2 and MAP1B-GFP molecules within 3 Å of each other fluoresce red when excited with a 543-nm laser (Fig. 8 B). Reciprocal pull-down assays of MAP1B and the plakin domain of dystonin confirmed that MAP1B and dystonin interact via the plakin domain (Fig. 8 C). We then confirmed that ectopic dystonin-a2–myc colocalized with endogenous MAP1B (Fig. 8 D). The observed defect at centrosomal MTs coupled with the loss of cis-Golgi organization at the centrosome lead us to investigate the location of this interaction. Colabeling with pericentrin shows that dystonin-a2 and MAP1B interact in the area surrounding the centrosome (Fig. 8 E). We further examined the ability of dystonin-a1–myc to interact with MAP1B-GFP by confocal microscopy (Fig. S3 B). This experiment revealed that MAP1B is capable of interacting with the plakin domain of multiple dystonin isoforms. Our subsequent experiments sought to determine whether MAP1B-mediated acetylation of MTs prevents deficiency associated with dystonin loss.
Figure 8.

Dystonin-a2 interacts with MT-stabilizing protein MAP1B. (A) Colocalization of recombinant dystonin-a2–myc and MAP1B-GFP in 293T cells as assessed by confocal microscopy. Vector mask of colocalization shows the region of colocalization is at the perinuclear (Peri) cytoskeleton. (B) Proximity ligation assay (PLA) of recombinant dystonin-a2 and MAP1B-GFP shows that the two proteins are within 3 Å of each other. (C) Reciprocal GFP/FLAG pull-down of MAP1B and the plakin domain of dystonin shows that MAP1B and dystonin interact via the plakin domain. (D) Confocal microscopy of dystonin (Dst)-a2–myc and endogenous MAP1B shows colocalization in perinuclear regions of the cell. (E) Colocalization analysis of recombinant dystonin-a2–myc and MAP1B-GFP combined with antigenic labeling of pericentrin by confocal microscopy shows that the interaction occurs in a subcellular region surrounding the centrosome (arrows). IP, immunoprecipitation. Bars, 10 µm.
Western blot analysis of the 293T lysate shows that MAP1B overexpression maintains Ac–α-tubulin after dystonin-a2 depletion (Fig. 9 A). Furthermore, this change in acetylation state appears sufficient to overcome Golgi fragmentation after dystonin-a2 depletion (Fig. 9 B). We thus evaluated whether MAP1B overexpression influences the ability of VSVG to traffic out of the Golgi after dystonin-a2 silencing. Kinetic visualization of VSVG trafficking showed that MAP1B promoted VSVG accumulation in discreetly organized Golgi (Fig. 9, C and D). Furthermore, MAP1B facilitates Golgi exit of VSVG and trafficking to the PM (Fig. 9, C and E). This confirmed that MT stabilization rescues transport defects resulting from dystonin-a2 loss and suggested that the MAP1B–dystonin interaction is critical to anterograde transport. Antigenic labeling of WT primary sensory neurons shows a perinuclear accumulation of MAP1B that is lost in dt27J neurons (Fig. 9 F, arrows), indicating a requirement of dystonin for MAP1B subcellular localization and supporting the notion that disruption of the MAP1B–dystonin interaction is causal in dt pathogenesis. This was confirmed using isoform-specific dystonin silencing. Isoform-specific dystonin-a2 depletion resulted in a change in MAP1B localization whereby the decrease in Ac–α-tubulin in the centrosomal region of the cell corresponded with a decrease in MAP1B association with α-tubulin in this region (Fig. S3 A). This further suggests that MAP1B-mediated maintenance of MT acetylation at the centrosome requires dystonin-a2. Finally, we examined whether overexpression of MAP1B promoted GLuc flux through the secretory pathway in primary sensory neurons of dt27J mice (Fig. 9 G). We find that MAP1B ectopic expression normalizes flux through the secretory pathway in dt neurons. Collectively these data suggest that dystonin-a2 maintains the acetylation status of MTs in the subcellular compartments surrounding the Golgi through interaction with MAP1B and that stabilized MTs in turn maintain the organization of cis-Golgi compartments and facilitate flux through the secretory pathway.
Figure 9.
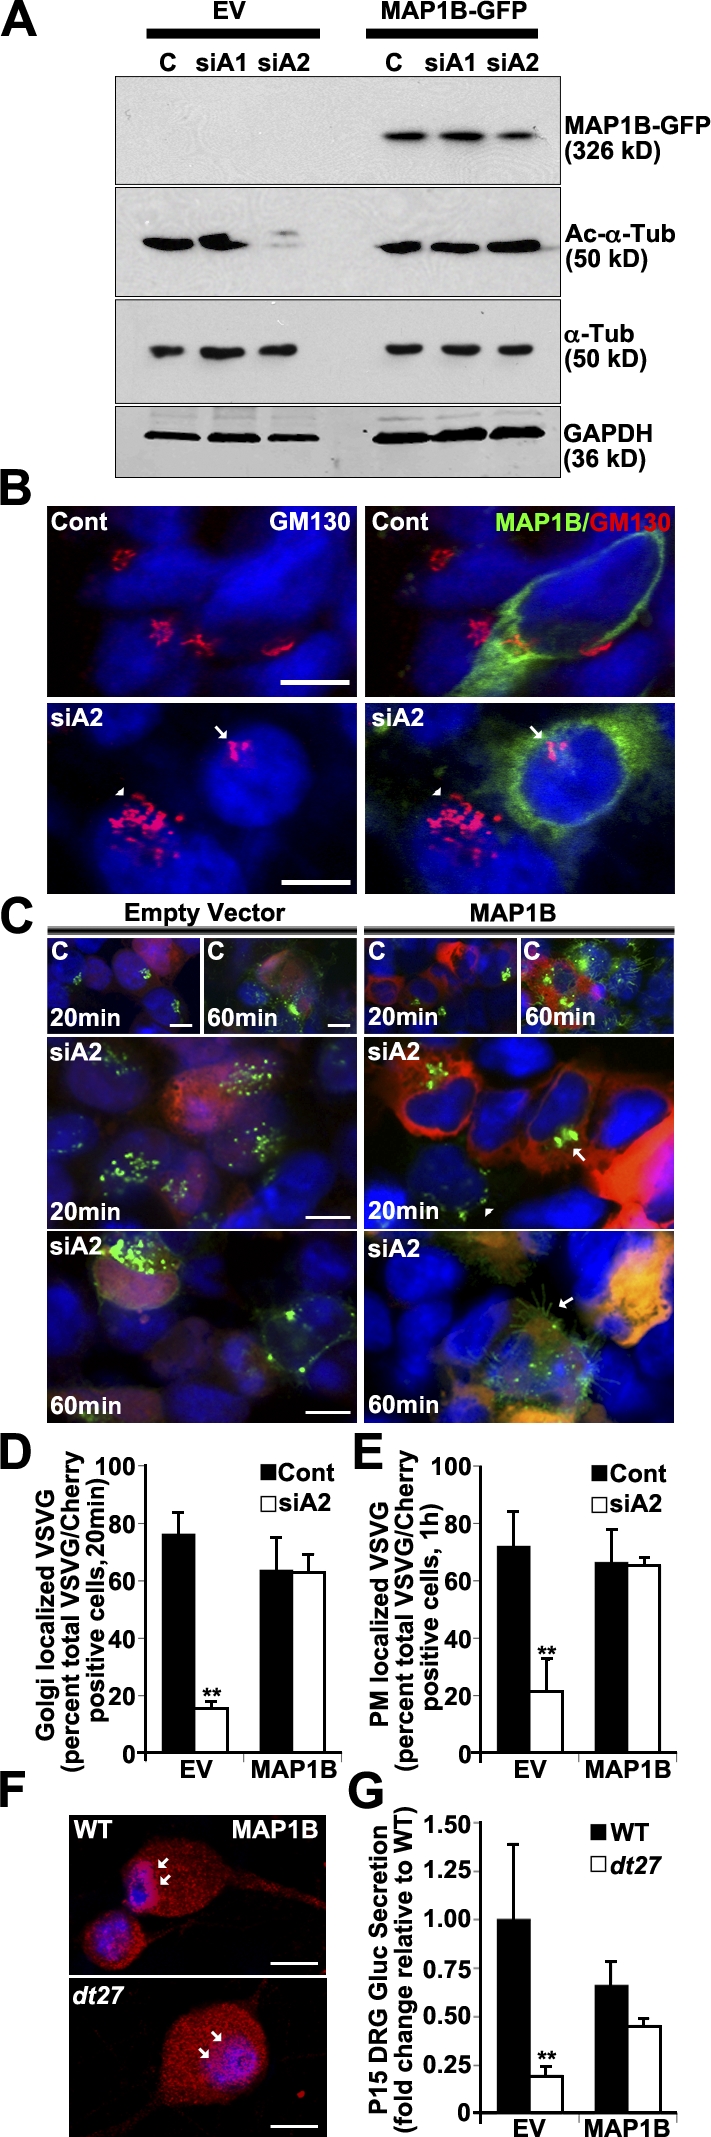
Dystonin-a2–MAP1B interaction maintains Ac–α-tubulin and promotes flux through the secretory pathway. (A) Western blot analysis of 293T cell lysate shows that MAP1B overexpression maintains Ac–α-tubulin after dystonin-a2 depletion relative to empty vector (EV) control. (B) MAP1B overexpression prevents Golgi fragmentation after dystonin-a2 depletion in 293Ts. Arrows point to intact Golgi in an siA2-treated cell that is positive for MAP1B-GFP expression. Arrowheads point to fragmented Golgi in a neighboring cell that was not transfected with the MAP1B-GFP construct. (C) MAP1B overexpression promotes VSVG trafficking to the Golgi and PM after dystonin-a2 depletion relative to empty vector control. Scramble siRNA-treated cells (top and A) are labeled C. The arrowhead identifies aberrantly localized VSVG molecules, whereas arrows identify normal VSVG localization. (D and E) Quantification of MAP1B impact on VSVG accumulation in the Golgi (D) and at the PM (E; ANOVA posthoc Tukey; n = 3). (F) MAP1B antigenic labeling of WT primary sensory neurons shows a perinuclear accumulation that is lost in dt27J neurons (arrows). (G) MAP1B expression restores GLuc flux through the secretory pathway (time = 1 h) in P15 dt27J sensory neurons (ANOVA posthoc Tukey; n = 6). Error bars show means ± SEM. Cont, control; Tub, tubulin. **, P < 0.01. Bars, 10 µm.
Discussion
Dst mutations have been attributed a casual role in degeneration of sensory neurons in the neurological mouse mutant dt. Although much investigation has focused on understanding dt pathology, the daunting size of the Dst gene coupled to the numerous protein isoforms generated from the gene have made elucidation of divergent isoform functions arduous. Here, we highlight a novel function of the dystonin-a2 isoform in mediating Golgi organization and flux through the secretory pathway (Fig. 10). We find under normal conditions dystonin-a2 associates with MAP1B in the area surrounding the centrosome, maintaining the acetylation status of MTs in this subcellular compartment. Stabilized MTs maintain the organization of the cis-Golgi and promote anterograde trafficking of motor proteins. In dt, the absence of the MAP1B–dystonin-a2 interaction results in a loss of MAP1B perinuclear localization, promoting MT instability through loss of MT acetylation. Deacetylated MT leads to Golgi fragmentation and prevents anterograde trafficking of motor proteins. These aberrations are apparent in prephenotype DRG tissue and primary sensory neurons of prephenotype dt mice, suggesting that they are causal in the dt disorder. Moreover, we report major changes in gene expression that precede the dt phenotype. Although MT stability in and of itself can lead to the changes in gene expression observed in dt DRGs, there may be direct effects of dystonin depletion on gene expression. Given the complexity of dystonin function, in particular its localization in the nuclear envelope and its known interaction with nesprin 3α (Young and Kothary, 2008), it is possible that the transcription changes observed may also be a direct result of dystonin depletion at the nuclear envelope.
Figure 10.

Schematic representation of the mechanism underlying transport defects in dt. (A) Under normal conditions, dystonin-a2 is present at Golgi membranes, maintaining the acetylation status of MTs in the subcellular compartments surrounding the centrosome. Stabilized MTs maintain the organization of the cis-Golgi and promote anterograde trafficking of motor proteins. (B) In dt mice, the absence of the MAP1B–dystonin-a2 interaction promotes MT instability through loss of MT acetylation. A deacetylated MT promotes Golgi fragmentation and prevents anterograde trafficking of motor proteins. Tub, tubulin.
Dystonin in MT stabilization
MTs radiate from the MT-organizing complex forming a scaffold network for organelles mediating their dispersal throughout the cell (Thyberg and Moskalewski, 1999; Lowe, 2011). Stabilized MTs form rigid, rodlike structures that collapse toward the MT-organizing complex, resulting in perinuclear rings where organelles aggregate (Kreitzer et al., 1999; Rios and Bornens, 2003). Loss of MT stability promotes organelle dispersal and Golgi fragmentation (Burkhardt, 1998). MT stability is regulated by MT-associated proteins, such as MAP1S and MAP1B, which bind and stabilize both organelles and MTs and by MT motor complexes (dynein and kinesin) involved in transporting Golgi vesicles to MT ends (Takemura et al., 1992; Thyberg and Moskalewski, 1993; Domínguez et al., 1994; Burkhardt, 1998; Liu et al., 2005; Bondallaz et al., 2006). The stabilizing effect of MAP1B is mediated in part through posttranslational modification of α-tubulin (Takemura et al., 1992; Bouquet et al., 2004). MAP1B maintains the acetylation status of α-tubulin, making MTs resistant to nocodazole-mediated depolymerization. MAP1B and MAP2 synergistically regulate multiple aspects of brain development (Teng et al., 2001; González-Billault et al., 2005). Mice with a complete MAP1B-null allele show developmental defects in the brain and peripheral nervous system with reduction in large caliber axons in the sciatic nerve, a similar result to what we have observed in dt mice (Bernier and Kothary, 1998; Meixner et al., 2000; De Repentigny et al., 2003). MT stability is associated with posttranslational acetylation of α-tubulin that closely associates with the cis-Golgi and is critical to Golgi organization (Thyberg and Moskalewski, 1993; Lowe, 2011). Deficiency of the histone acetyltransferase complex, elongator, results in a defect in neuronal migration and axon branching through loss of Ac–α-tubulin (Creppe et al., 2009). This suggests that tubulin acetylation status underlies neuronal deficits related to cytoskeletal instability. Our demonstration of a functional interaction between MAP1B and the plakin domain of dystonin-a2 may explain why phenotypic similarities exist among neuronal deficits resulting from mutations in MT-associated proteins. Indeed, developmental expression patterns of MAP1B show a decrease in expression with maturation of most nervous tissues with the exception of DRG sensory neurons (Ma et al., 1997). As the MAP1B phenotype has been interpreted as resulting from changes in MT stabilization in addition to effects on axonal transport, the prominent expression of MAP1B and dystonin in sensory neurons suggests that loss of this interaction may significantly contribute to MT instability. Interestingly, although aberrant MAP1B localization can be seen in dt27J sensory neurons, silencing of dystonin-a2 in 293T cells does not alter localization of ectopically overexpressed MAP1B. Although many differences, no doubt, exist between these two systems, we have observed an increased MAP1B phosphorylation status in phenotypic dt27J DRG tissue relative to WT littermates (Bhanot et al., 2011). This change in phosphorylation may be the result of altered kinase activity associated with the neurodegenerative process that is not represented by transient knockdown of dystonin-a2 in vitro. This may explain why we see altered MAP1B localization specifically in dt sensory neurons. The requirement of the dystonin-a2–MAP1B interaction for maintenance of MT acetylation status suggests that mutual expression of dystonin and MAP1B is critical in sensory neurons. Moreover, these data propose a role for MAP1B in other neurodegenerative conditions associated with mutations of plakin family members, such as MACF1.
Plakins as regulators of MT polymerization
Mammalian and Drosophila melanogaster plakin family members (mammalian MACF1 and dystonin and Drosophila Short stop) associate with MTs using two conserved domains: the Gas2-related domain and its adjacent C-terminal tail region (Leung et al., 1999; Sun et al., 2001; Lee and Kolodziej, 2002). Although Gas2-related domains associate along MT shafts and promote MT stabilization (Sun et al., 2001; Lee and Kolodziej, 2002) the C terminus of MACF1 and Short stop have recently been shown to bind EB1 and localize at growing MT ends (Kodama et al., 2003; Slep et al., 2005; Applewhite et al., 2010), establishing plakins as putative plus tip–interacting proteins. Here, we show that the dystonin–MAP1B interaction is critical to Golgi organization around the centrosome and supports MT polymerization. Plus end polymerization from the Golgi toward the leading edge of the cell supports cell migration (Bisel et al., 2008; Miller et al., 2009). MAP1B has previously been shown to localize to the centrosome, where it promotes MT nucleation (Domínguez et al., 1994), and numerous mutations of MT-associated proteins, including MAP1B and MACF1, are causal in defects of neuronal migration and cortical development (Meixner et al., 2000; Teng et al., 2001; Goryunov et al., 2010). Furthermore, migration defects have been noted in mice with mutations in the smaller epithelial isoform of dystonin (dystonin-e; Guo et al., 1995). These data implicate dystonin in guidance of plus end MTs to the leading edge of the cell and may offer insight into the role of cytoskeletal linker proteins in both axon guidance and neuronal migration.
Dystonin-a2 and organelle integrity
It has been established that organization, movement, and proper function of organelles is highly reliant upon the cytoskeleton (Barr and Egerer, 2005; Starr, 2007; Bola and Allan, 2009). The MACF1b isoform demonstrates the dependency of organelle integrity on cytoskeletal linking proteins. MACF1b shares similar domain architecture to neuronal dystonin and is critical for organization of the Golgi complex (Leung et al., 1999; Lin et al., 2005). Chemical dispersion of the Golgi results in reorganization of MACF1b to the ER, whereas silencing of MACF1b induces Golgi fragmentation. Furthermore, MACF1b localization to the Golgi is dictated by the protein’s N-terminal plakin domain (Lin et al., 2005). We have previously demonstrated an N-terminal transmembrane domain adjacent to the plakin domain in dystonin-a2 that facilitates its localization to the outer membrane of the nuclear envelope and perinuclear membranes of the ER and Golgi (Young et al., 2006). Indeed, ectopic dystonin-a2 protein colocalizes with the cis-Golgi protein GM130, which has been attributed a functional role in MT nucleation from the Golgi (Young et al., 2006; Rivero et al., 2009). Although the two proteins are expressed in many of the same tissues, DRG neurons predominantly express dystonin, whereas MACF1 is highly expressed in the brain (Leung et al., 2001). Contrasting localization may explain why dt degeneration is most prominent in sensory neurons. Indeed, the similarities in domain architecture and subcellular localization make it interesting to speculate whether there are compensating functions between these two plakin family members, with dystonin–MAP1B facilitating MT stability in sensory neurons and hypothetical MACF1b–MAP1B complex facilitating MT stability in brain, thus implicating differential expression patterns in the divergent susceptibility of various neuronal tissues to mutation of each respective protein.
Cytoskeletal cross-linker proteins as mediators of axon transport
Cytoskeletal cross-linker proteins have been the focus of much attention in disorders of the sensory motor system. Mutations in the cytoskeletal linker protein βIII spectrin cause severe cerebrospinal ataxia in murine and Drosophila models (Clarkson et al., 2010; Lorenzo et al., 2010; Perkins et al., 2010). The ataxic phenotype is enhanced by both dynein and dynactin loss-of-function mutations, implicating aberrant intracellular transport as a mediator of pathology (Lorenzo et al., 2010). Molecular interaction studies have implicated dystonin in regulation of the dynein motor complex through interaction with dynactin and the endosomal vesicle protein retrolinkin (Liu et al., 2003, 2007). The potential role for dystonin as a dynein motor complex component coupled with our findings of a role for dystonin-a2 as mediator of anterograde transport supports the notion that improper functioning of the secretory pathway causes degeneration of neurons in the sensory motor system. We have previously reported defective fast axonal transport in the sciatic nerves of phenotypic dt27J mice in both orthograde and retrograde directions (De Repentigny et al., 2003). The present study elucidates the mechanism underlying aberrant transport and attributes this defect to phenotypic onset. Indeed, cytoskeletal linkers may have a general role in mediating axonal transport by regulating organelle organization. As such, their dysfunction may contribute to numerous neurodegenerative conditions whose etiologies are as yet unknown.
Materials and methods
Reagents
All chemicals were purchased through Sigma-Aldrich, and all cell culture reagents were obtained from Invitrogen except where indicated.
Animals and cell culture
The dt27J mutant mice arose from a spontaneous recessive mutation in the Dst allele, first identified at The Jackson Laboratory. Characterization of the mutation revealed no large rearrangements or deletions in the alleles but a drastic reduction in neuronal transcript levels (Pool et al., 2005). dt27J and control littermates were sacrificed at prephenotype (P4) and phenotype (P15) stage. The onset of phenotype was generally assessed by the appearance of clasping of hind limbs after picking the mice up by the tails. dt27J mice were genotyped by PCR amplification of genomic tail DNA. All animal procedures were performed in accordance with institutional guidelines (Animal Care and Veterinary Services and Ethics at the University of Ottawa).
For the primary culture of sensory neurons, spinal columns were removed from P4 or P15 mice and transferred to a dissection microscope. Approximately 40 DRGs were isolated per mouse and subsequently digested for 15 min each with collagenase A (Roche) and papain (Worthington) solutions. DRG neurons were dissociated with flame-polished glass Pasteur pipettes and seeded onto 12-mm laminin 2 (Millipore)–coated coverslips at a density of 50,000 in DME with 10% FBS and 1% penicillin/streptomycin. Cells were placed in a 37°C tissue-culture incubator, under 8.5% CO2. The following day, the media were changed to neuronal maintenance media (DME base, 0.5% FBS, 2% B27, 1% GlutaMAX, 16 µg/ml putrescine, 400 µg/ml thyroxine, 400 µg/ml triiodothyronine, 6.2 ng/ml progesterone, 5 ng/ml sodium selenite, 100 µg/ml bovine albumin serum, 5 µg/ml bovine insulin, and 50 µg/ml holotransferrin) supplemented with 200 ng/ml nerve growth factor and 1 µM 5-fluoro-2′-deoxyuridine. A 3/4 media change was performed every other day, up until day 6 of culture, when neurons were analyzed. When TSA treatment was performed, cells were incubated with 100 nM TSA or 0.1% DMSO for 24 h before analysis.
Human embryonic kidney 293T cells were maintained in DME + 10% FBS and 1% penicillin/streptomycin at 37°C and 8.5% CO2. Cells were passaged at ∼70% confluency in 10-cm plastic Petri dishes and plated onto glass coverslips for use in immunofluorescence assays. Cell transfections were performed using either Lipofectamine 2000 (Invitrogen) or X-tremeGENE (Roche) according to the manufacturer’s directions. When TSA treatment was performed, cells were incubated with 100 nM TSA or 0.1% DMSO for 24 h before analysis. When nocodazole treatment was performed, 293T cells were treated with 10 µM nocodazole for 4 h at 37°C and 8.5% CO2. Cells were then either fixed immediately or placed on ice, and ice-cold nocodazole-free maintenance media were added for washout experiments. Cells were subsequently fixed in 4% PFA at various time points for antigenic analysis.
mRNA microarray analysis
RNA was harvested from P4 WT (n = 3) and dt27J (n = 3) DRGs using the RNeasy Mini kit (QIAGEN) according to manufacturer’s protocol. Each n represents an individual animal, sacrificed from at least two separate litters. Expression profiling was performed using the One-Color Microarray-Based Gene Expression Analysis platform and the 4 × 44K Whole Mouse Genome Oligo Microarray kit (design ID 014868) from Agilent Technologies as previously described and according to the manufacturer’s protocol (Liu et al., 2010). In brief, 300 ng RNA was labeled and used for each microarray. The slides were hybridized at 65°C for ≥17 h. The slides were subsequently washed and scanned with the DNA microarray scanner (Agilent Technologies). After scanning, the intensities of the spots were extracted using Feature Extraction (version 10.1.1; Agilent Technologies). For each sample, raw median probe intensity data were normalized using GeneSpring GX (version 10.0; Agilent Technologies), first by scaling probe signals within each microarray by the quantiles method, then by eliminating probes with no or marginal signal in all samples, and finally by averaging the normalized signal among replicate samples. Microarray data can be downloaded from the Gene Expression Omnibus under accession no. GSE30960. The k-means clustering of expression profiling microarray data were performed with the Cluster 3 program using Euclidean metrics (de Hoon et al., 2004). After clustering, only genes associated with transport were retained (561 genes), and fold changes were visualized using Java TreeView (Saldanha, 2004). For cluster enrichment, all genes with a fold change greater than onefold or less than minus onefold relative to WT DRGs were clustered for GO terms using DAVID (Database for Annotation, Visualization and Integrated Discovery) v6.7 (Dennis et al., 2003) and visualized using Cytoscape 2.8.1 (Cline et al., 2007). The significance cutoff for enrichment over background was P < 0.05 using Fisher’s exact test with correction for multiple hypothesis testing by the algorithm of Benjamini and Hochberg (1995). The background set of genes used was the entire mouse genome.
Sample preparation for electron microscopy
Samples were prepared as previously described (De Repentigny et al., 2011). In brief, dt27J (n = 4) and WT (n = 4) mice were anesthetized at P4 and P15 via intraperitoneal injection of tribromoethanol (Avertin). Mice were perfused transcardially with 3 ml PBS followed by 10 ml Karnovsky’s fixative (4% PFA, 2% glutaraldehyde, and 0.1 M cacodylate buffer in PBS, pH 7.4). The lumbar region of the spinal cord was dissected, and DRGs were collected under a stereomicroscope (MZ9.5; Leica). Ultrathin sections (70 nm) were placed on a 300 mesh copper specimen grid, counterstained in 5% uranyl acetate and Reynold’s lead citrate, and then observed by transmission electron microscopy. Area-calibrated electron micrographs from both P4 and P15 mice were then analyzed, and Golgi area was measured recorded using the advances measurements module of Photoshop (CS4 Extended version 11; Adobe). The number of dilated Golgi per DRG was then counted relative to total Golgi present using ImageJ (1.42q; National Institutes of Health) in P15 dt27J and WT ganglion.
Recombinant protein construct
Full-length MAP1B fused to the GFP at the N terminus (MAP1B-GFP) was produced by PCR amplification of mouse MAP1B cDNA cloned into the pSVsport vector and subcloned into pEGFP-C1 (P.G. Weeks, University of London, London, England, UK; Scales et al., 2009). Dystonin-a1–myc/his, dystonin-a2–myc/his, N-terminal dystonin-a2–myc/his, and FLAG-Bpag1a2ΔTM (from here on referred to as Plakin-FLAG) were developed by K. Young (National Research Council, Ottawa, Ontario, Canada). In brief, dystonin cDNA were amplified from mouse brain RNA and cloned into either the pCMV-TAG2 vector (Agilent Technologies) encoding an N-terminal FLAG tag or the pEF1-myc/his vector (Invitrogen) encoding a C-terminal myc/his tag (Young et al., 2006; Young and Kothary, 2008). The N-terminal region of dystonin-a1 was generated by RT-PCR and subcloned into the pEGFP-C1 vector (Takara Bio Inc.; Young et al., 2003). Full-length Daxx protein (Daxx-FLAG; D. Picketts, Ottawa Hospital Research Institute, Ottawa, Ontario, Canada) was developed by fusing Daxx cDNA to an N-terminal FLAG tag in the pRK5 vector (Tang et al., 2004). MAP1B-mCherry was produced by PCR amplification of mouse MAP1B from a pSVsport MAP1B plasmid (N. Cowan, New York University, New York, NY). The PCR product was ligated in frame into an mCherry-C1 vector (L. Trinkle-Mulcahy, University of Ottawa, Ottawa, Ontario, Canada).
Transfection and RT-PCR
Custom siRNAs were developed to target specific dystonin isoforms. To knockdown dystonin-a1 and dystonin-a2, isoform-specific nucleotides between 2,310 and 2,380 (available from GenBank/EMBL/DDBJ under accession no. AF396878) for dystonin-a1 and nucleotides between 1 and 661 (GenBank accession no. DQ023311.2) for dystonin-a2 were chosen for the development of siRNAs. These regions were chosen, as they are isoform specific and share 90% identity between mouse and human dystonin/BPAG1n targets. The following siRNA sequences were efficacious in knocking down dystonin-a1 and dystonin-a2 expression, respectively: group A sense, 5′-ACAUGUACGUGGAGGAGCA-3′; antisense, 5′-UGCUCCUCCACGUACAUGU-3′; sense, 5′-CAAGCAUGAGAGAUCCAAA-3′; and antisense, 5′-UUUGGAUCUCUCAUGCUUG-3′; and group B sense, 5′-CAAGCAUGAGAGAUCCAAA-3′; antisense, 5′-UUUGGAUCUCUCAUGCUUG-3′; sense, 5′-CUUCCUCUUGUUGCUCCUG-3′; and antisense, 5′-CAGGAGCAACAAGAGGAAG-3′. All siRNAs (Silencer Select Custom Designed siRNA) were obtained from Applied Biosystems and compared with the effects of scrambled controls matched for GC content (Invitrogen). For shRNA-RFP (pLKO.1-puro-CMV-TagRFP; MISSION shRNA; Sigma-Aldrich)–mediated knockdown, the following sequence was efficacious in knocking down dystonin expression: 5′-CCGGCCCTTGTCAAACTCTACGAAACTCGAGTTTCGTAGAGTTTGACAAGGGTTTTTG-3′. As a control, nontarget shRNA custom clones (pLKO.1-puro-CMV-TagRFP; Sigma-Aldrich) were used. Knockdown was assessed at the transcript and protein level after 48 h of treatment. Total RNA was collected from 293T cells using RNeasy Mini kit (QIAGEN) according to the manufacturer’s protocol. For RT-PCR, a reverse transcription kit (QuantiTect; QIAGEN) was used following the manufacturer’s protocol. cDNAs encoding MACF1, dystonin-a1, dystonin-a2, or total dystonin and glyceraldehyde 3-phosphate dehydrogenase (GAPDH) or actin (control) were PCR amplified as previously described (Bernier et al., 2000; Pool et al., 2005). For assessment of protein knockdown, 293T cells were cotransfected with siRNA and recombinant dystonin proteins (N-terminal dystonin-a2–myc/his described in Young and Kothary [2008] and N-terminal dystonin-a1-GFP described in Young et al. [2003]) using X-tremeGENE. Cells were then visualized with an epifluorescent microscope (Axiovert 200M; Carl Zeiss) under a 10× objective (Achroplan 0.25) equipped with a digital camera (AxioCam HRm; Carl Zeiss) and Axiovision 4.6 software (Carl Zeiss). Fluorescence intensity of recombinant dystonin proteins was used to assess siRNA knockdown efficiency. When the influence of MAP1B on dystonin-deficient systems was evaluated, MAP1B-GFP, MAP1B-mCherry, N1-GFP, or N1-mCherry empty vector was cotransfected with siRNA.
Viral infection and trafficking
293T cells were infected with an adenoviral vector expressing YFP–VSV-Gts0–45 (VSVG; X. Zha and R. Parks, Ottawa Hospital Research Institute, Ottawa, Ontario, Canada) and incubated at 40.5°C for 16–20 h to permit VSVG accumulation in the ER. When TSA treatment was performed, cells were incubated in the presence of either 100 nM TSA or 0.1% DMSO. Cells were then transferred to 32°C and incubated for time periods ranging from 10 min to 24 h to allow VSVG to move to the Golgi/PM and were fixed at the end of the 32°C incubation with 4% PFA. Cells were subsequently visualized and analyzed with a confocal microscope (LSM 510 meta; Carl Zeiss) equipped with an EC Plan-Neofluar 40×/1.30 NA oil differential interference contrast (DIC) M27 objective using Zen 8.0 software (Carl Zeiss). VSVG was considered ER associated if any residual VSVG could be visualized within ER compartments, whereas VSVG was considered Golgi associated once all VSVG was deposited within Golgi. Data were expressed as a percentage of total cell number in each condition. Lentiviral infection of RFP-FLuc (FLuc, control; X. Breakefield, Harvard Medical School, Boston, MA) and the secreted GLuc (B. Tannous, Harvard Medical School, Boston, MA) was conducted according to the method of Badr et al. (2007). In brief, primary sensory neurons from either P4 or P15 mice were coinfected with GLuc/FLuc lentivirus after 72 h in culture. Efficiency of infection was comparable between WT and dt27J neuronal cultures as established by counting YFP- and RFP- or mCherry-positive cells before subsequent treatment. 48 h after infection, media were changed, and 50-µl media samples were harvested at various time points for analyses for GLuc activity to determine the rate of secretion. At the end of the time course, cells were lysed, and FLuc activity was measured for standardization across samples. Luciferase activity was measured using the substrate (Stop and Glo; Promega), and luminescence was recoded using a luminometer (LUMIstar Optima) from DMG Labtech and analyzed using Optima (version 2.10 R2).
Calcium phosphate transfection
MAP1B-mCherry was transfected into WT or dt27J sensory neurons by calcium phosphate transfection after 72 h in culture. Maximal mCherry expression was observed 72 h after transfection. Control transfections were with N1-mCherry (L. Trinkle-Mulcahy, University of Ottawa, Ottawa, Ontario, Canada) empty vector plasmid. Cells were then visualized with an epifluorescent microscope (Axiovert 200M) under a 10× objective (Achroplan 0.25 NA) equipped with a digital camera (AxioCam HRm) and Axiovision 4.6 software. Efficiency of transfection was comparable between WT and dt27J neuronal cultures as established by counting mCherry-positive cells before subsequent treatment. For Gluc/Fluc analysis, cells were infected 24 h after calcium phosphate transfection.
Immunocytochemistry
Cultures were fixed in 4% PFA before antigenic labeling. Primary antibodies used were rabbit polyclonal α-tubulin (1:2,000; Sigma-Aldrich), MAP1B (1:500; Sigma-Aldrich), mouse monoclonal anti–α-tubulin (IgG1; 1:2,000; Oncogene), anti–Ac–α-tubulin (IgG2B; 1:2,000; Sigma-Aldrich), anti-GM130 (1:500; BD), antipericentrin (1:1,000; Abcam), anti–c-myc (1:800; Santa Cruz Biotechnology, Inc.), and anti-VSVG (1:100; gift from X. Zha). Secondary antibodies used were anti–mouse IgG1 DyLight 549 (1:2,000; Jackson ImmunoResearch Laboratories, Inc.), anti–mouse IgG2B DyLight 488 (1:2,000; Jackson ImmunoResearch Laboratories, Inc.) anti–mouse Alexa Fluor 555 (1:2,000; Invitrogen), anti–mouse Alexa Fluor 647 (1:2,000; Invitrogen), and anti–rabbit Alexa Fluor 488 (1:2,000; Invitrogen). Antibodies were diluted in antibody buffer (PBS, 0.3% Triton X-100, and 3% BSA). Where DAPI staining is indicated, samples were incubated in DAPI stain (0.2 µg/ml in PBS) for 10 min and washed three times in PBS for 5 min. Samples were mounted in fluorescent mounting media (Dako) and analyzed with a confocal microscope (LSM 510 meta) equipped with an EC Plan-Neofluar 40×/1.30 NA oil DIC M27 objective using Zen 8.0 software.
Protein interactions
For pull-down assays, the protein lysate from 293T cells expressing either MAP1B-GFP and Plakin-FLAG or MAP1B-GFP and Daxx-FLAG was precleared overnight. Samples were subsequently incubated with either Dynal protein G magnetic beads (Invitrogen) and 5 µg FLAG antibody (M2, mouse; Sigma-Aldrich) or GFP-conjugated magnetic beads (Abcam). IgG controls were performed by incubation of Dynal protein G magnetic beads, and 5 µg of rabbit or mouse IgG was used as appropriate. Samples were subsequently centrifuged or placed on a magnetic rack when appropriate. Proteins were eluted in elution buffer (60 mM Tris, pH 6.8, 2% SDS, and 10% glycerol) and subjected to SDS-PAGE. The proximity ligation assay was performed as previously described (Shafey et al., 2010). In brief, HEK 293 cells were cotransfected with dystonin-a2 and MAP1B-GFP fixed with 4% PFA and antigenically labeled for myc or MAP1B. Proximity ligation assay detection was performed according to the manufacturer’s specifications and analyzed with a confocal microscope (LSM 510 meta) equipped with an EC Plan-Neofluar 40×/1.30 NA oil DIC M27 objective using Zen 8.0 software.
Western blot analysis
Proteins were isolated in radioimmunoprecipitation assay buffer (10 mM PBS, 1% NP-40, 0.5% sodium deoxycholate, 0.1% SDS, 30 µl/ml aprotinin, 10 mM Na orthovanadate, and 100 µl/ml PMSF). Protein samples (30 µg) were separated by SDS-PAGE under reducing conditions. Western blot analyses were performed using primary rat anti–ty-α-tubulin (1:1,000; Abcam), mouse monoclonal anti–α-tubulin (IgG1; 1:2,000), anti–Ac–α-tubulin (IgG2B; 1:2,000), anti-KLC2 (1:1,000; Abcam), anti–βIII-tubulin (E7 clone; 1:2,000; Developmental Studies Hybridoma Bank), anti-MAP1B (1:5,000; Sigma-Aldrich), FLAG (1:15,000; Sigma-Aldrich), rabbit polyclonal anti-GAPDH (1:5,000; Abcam), and GFP (1:1,000; Invitrogen). Secondary antibodies used were biotin-conjugated anti–rat (1:2,000; Jackson ImmunoResearch Laboratories, Inc.), HRP-conjugated anti–mouse IgG (1:2,000; Bio-Rad Laboratories), or HRP-conjugated anti–rabbit IgG (1:2,000; Bio-Rad Laboratories). Tertiary amplification was performed using HRP-conjugated neutravidin (1:2,000; Thermo Fisher Scientific). Immunoreactive bands were visualized using enhanced chemiluminescent substrate (Thermo Fisher Scientific). Quantification of protein levels was performed using either the infrared fluorescence detection system (Odyssey; LI-COR Biosciences) or by densitometric analysis of individual bands using ImageJ analysis software. For infrared analysis, mouse anti–Ac–α-tubulin and anti-GAPDH were probed simultaneously in combination with rabbit anti–α-tubulin (total). Appropriate infrared secondary antibodies allowed for direct quantification of the ratio of Ac–α-tubulin to total α-tubulin normalized to GAPDH on each membrane. Four experiments were conducted, and the resulting blots and quantification are depicted.
Statistical analysis
Data were analyzed using Student’s t test or factorial analysis of variance (ANOVA) as applicable using InStat v3.0 (GraphPad Software). After detection of a statistically significant difference in a given series of treatments by ANOVA, posthoc Dunnett’s t tests or Tukey tests were performed when appropriate. P-values under 0.05 were considered statistically significant (shown as a single asterisk in the figures); p-values under 0.01 were considered highly statistically significant (shown as a double asterisk in the figures).
Online supplemental material
Fig. S1 shows that the defect in secretion and MT stability observed after isoform-specific dystonin-a2 depletion is consistently observed across multiple siRNA and shRNA sequences. Fig. S2 shows that the defect in transport is not caused by aberrant protein folding. Fig. S3 shows that dystonin-a2 silencing results in loss of MAP1B localization at the centrosome. Online supplemental material is available at http://www.jcb.org/cgi/content/full/jcb.201107096/DC1.
Acknowledgments
We thank Justin Boyer for comments on the manuscript and the rest of the Kothary laboratory for helpful discussions. We also thank Drs. Xandra Breakefield and Bakhos Tannous for donation of the Gluc/Fluc lentivirus, Xiaohui Zha and Robin Parks for the VSVG adenovirus, and David Picketts for the Daxx construct. MAP1B-GFP was kindly provided by Dr. Phillip Gordon Weeks, pSVsport-MAP1B was kindly provided by Dr. Nicholas Cowan, and mCherry-C1 was a gift from Dr. Laura Trinkle-Mulcahy.
This work was supported by a grant from the Canadian Institutes of Health Research (CIHR), a Multiple Sclerosis Society of Canada Research Fellowship, and a CIHR Fellowship to S.D. Ryan with the support of the Dystonia Medical Research Foundation of Canada. A. Ferrier is supported by an Ontario Graduate Scholarship. R. Kothary is a recipient of a University Health Research Chair from the University of Ottawa.
Footnotes
Abbreviations used in this paper:
- ANOVA
- analysis of variance
- DIC
- differential interference contrast
- DRG
- dorsal root ganglia
- dt
- dystonia musculorum
- FLuc
- firefly luciferase
- GAPDH
- glyceraldehyde 3-phosphate dehydrogenase
- GLuc
- Gaussia luciferase
- GO
- gene ontology
- MACF1
- MT–actin cross-linking factor 1
- MAP1B
- MT-associated protein 1B
- MT
- microtubule
- PM
- plasma membrane
- shRNA
- small hairpin RNA
- TSA
- trichostatin A
- ty
- tyrosination
- WT
- wild type
References
- Applewhite D.A., Grode K.D., Keller D., Zadeh A.D., Slep K.C., Rogers S.L. 2010. The spectraplakin Short stop is an actin-microtubule cross-linker that contributes to organization of the microtubule network. Mol. Biol. Cell. 21:1714–1724 10.1091/mbc.E10-01-0011 [DOI] [PMC free article] [PubMed] [Google Scholar]
- Badr C.E., Hewett J.W., Breakefield X.O., Tannous B.A. 2007. A highly sensitive assay for monitoring the secretory pathway and ER stress. PLoS ONE. 2:e571 10.1371/journal.pone.0000571 [DOI] [PMC free article] [PubMed] [Google Scholar]
- Barr F.A., Egerer J. 2005. Golgi positioning: are we looking at the right MAP? J. Cell Biol. 168:993–998 10.1083/jcb.200501088 [DOI] [PMC free article] [PubMed] [Google Scholar]
- Benjamini Y., Hochberg Y. 1995. Controlling the false discovery rate: a practical and powerful approach to multiple testing. J. R. Stat. Soc., B. 57:289–300 http://www.ams.org/mathscinet-getitem?mr=96d:62143 [Google Scholar]
- Bernier G., Kothary R. 1998. Prenatal onset of axonopathy in Dystonia musculorum mice. Dev. Genet. 22:160–168 [DOI] [PubMed] [Google Scholar]
- Bernier G., De Repentigny Y., Mathieu M., David S., Kothary R. 1998. Dystonin is an essential component of the Schwann cell cytoskeleton at the time of myelination. Development. 125:2135–2148 [DOI] [PubMed] [Google Scholar]
- Bernier G., Pool M., Kilcup M., Alfoldi J., De Repentigny Y., Kothary R. 2000. Acf7 (MACF) is an actin and microtubule linker protein whose expression predominates in neural, muscle, and lung development. Dev. Dyn. 219:216–225 [DOI] [PubMed] [Google Scholar]
- Bhanot K., Young K.G., Kothary R. 2011. MAP1B and clathrin are novel interacting partners of the giant cyto-linker dystonin. J. Proteome Res. 10:5118–5127 10.1021/pr200564g [DOI] [PubMed] [Google Scholar]
- Bisel B., Wang Y., Wei J.H., Xiang Y., Tang D., Miron-Mendoza M., Yoshimura S., Nakamura N., Seemann J. 2008. ERK regulates Golgi and centrosome orientation towards the leading edge through GRASP65. J. Cell Biol. 182:837–843 10.1083/jcb.200805045 [DOI] [PMC free article] [PubMed] [Google Scholar]
- Bola B., Allan V. 2009. How and why does the endoplasmic reticulum move? Biochem. Soc. Trans. 37:961–965 10.1042/BST0370961 [DOI] [PubMed] [Google Scholar]
- Bondallaz P., Barbier A., Soehrman S., Grenningloh G., Riederer B.M. 2006. The control of microtubule stability in vitro and in transfected cells by MAP1B and SCG10. Cell Motil. Cytoskeleton. 63:681–695 10.1002/cm.20154 [DOI] [PubMed] [Google Scholar]
- Bouquet C., Soares S., von Boxberg Y., Ravaille-Veron M., Propst F., Nothias F. 2004. Microtubule-associated protein 1B controls directionality of growth cone migration and axonal branching in regeneration of adult dorsal root ganglia neurons. J. Neurosci. 24:7204–7213 10.1523/JNEUROSCI.2254-04.2004 [DOI] [PMC free article] [PubMed] [Google Scholar]
- Brown A., Bernier G., Mathieu M., Rossant J., Kothary R. 1995. The mouse dystonia musculorum gene is a neural isoform of bullous pemphigoid antigen 1. Nat. Genet. 10:301–306 10.1038/ng0795-301 [DOI] [PubMed] [Google Scholar]
- Burkhardt J.K. 1998. The role of microtubule-based motor proteins in maintaining the structure and function of the Golgi complex. Biochim. Biophys. Acta. 1404:113–126 10.1016/S0167-4889(98)00052-4 [DOI] [PubMed] [Google Scholar]
- Chabin-Brion K., Marceiller J., Perez F., Settegrana C., Drechou A., Durand G., Poüs C. 2001. The Golgi complex is a microtubule-organizing organelle. Mol. Biol. Cell. 12:2047–2060 [DOI] [PMC free article] [PubMed] [Google Scholar]
- Clarkson Y.L., Gillespie T., Perkins E.M., Lyndon A.R., Jackson M. 2010. Beta-III spectrin mutation L253P associated with spinocerebellar ataxia type 5 interferes with binding to Arp1 and protein trafficking from the Golgi. Hum. Mol. Genet. 19:3634–3641 10.1093/hmg/ddq279 [DOI] [PMC free article] [PubMed] [Google Scholar]
- Cline M.S., Smoot M., Cerami E., Kuchinsky A., Landys N., Workman C., Christmas R., Avila-Campilo I., Creech M., Gross B., et al. 2007. Integration of biological networks and gene expression data using Cytoscape. Nat. Protoc. 2:2366–2382 10.1038/nprot.2007.324 [DOI] [PMC free article] [PubMed] [Google Scholar]
- Creppe C., Malinouskaya L., Volvert M.L., Gillard M., Close P., Malaise O., Laguesse S., Cornez I., Rahmouni S., Ormenese S., et al. 2009. Elongator controls the migration and differentiation of cortical neurons through acetylation of alpha-tubulin. Cell. 136:551–564 10.1016/j.cell.2008.11.043 [DOI] [PubMed] [Google Scholar]
- Dalpé G., Mathieu M., Comtois A., Zhu E., Wasiak S., De Repentigny Y., Leclerc N., Kothary R. 1999. Dystonin-deficient mice exhibit an intrinsic muscle weakness and an instability of skeletal muscle cytoarchitecture. Dev. Biol. 210:367–380 10.1006/dbio.1999.9263 [DOI] [PubMed] [Google Scholar]
- de Hoon M.J., Imoto S., Nolan J., Miyano S. 2004. Open source clustering software. Bioinformatics. 20:1453–1454 10.1093/bioinformatics/bth078 [DOI] [PubMed] [Google Scholar]
- Dennis G., Jr, Sherman B.T., Hosack D.A., Yang J., Gao W., Lane H.C., Lempicki R.A. 2003. DAVID: Database for Annotation, Visualization, and Integrated Discovery. Genome Biol. 4:P3 10.1186/gb-2003-4-5-p3 [DOI] [PubMed] [Google Scholar]
- De Repentigny Y., Deschênes-Furry J., Jasmin B.J., Kothary R. 2003. Impaired fast axonal transport in neurons of the sciatic nerves from dystonia musculorum mice. J. Neurochem. 86:564–571 10.1046/j.1471-4159.2003.01861.x [DOI] [PubMed] [Google Scholar]
- De Repentigny Y., Ferrier A., Ryan S.D., Sato T., Kothary R. 2011. Motor unit abnormalities in Dystonia musculorum mice. PLoS ONE. 6:e21093 10.1371/journal.pone.0021093 [DOI] [PMC free article] [PubMed] [Google Scholar]
- Domínguez J.E., Buendia B., López-Otín C., Antony C., Karsenti E., Avila J. 1994. A protein related to brain microtubule-associated protein MAP1B is a component of the mammalian centrosome. J. Cell Sci. 107:601–611 [PubMed] [Google Scholar]
- Dowling J., Yang Y., Wollmann R., Reichardt L.F., Fuchs E. 1997. Developmental expression of BPAG1-n: insights into the spastic ataxia and gross neurologic degeneration in dystonia musculorum mice. Dev. Biol. 187:131–142 10.1006/dbio.1997.8567 [DOI] [PubMed] [Google Scholar]
- Duchen L.W. 1976. Dystonia musculorum—an inherited disease of the nervous system in the mouse. Adv. Neurol. 14:353–365 [PubMed] [Google Scholar]
- Duchen L.W., Strich S.J., Falconer D.S. 1964. Clinical and pathological studies of an hereditary neuropathy in mice (dystonia musculorum). Brain. 87:367–378 10.1093/brain/87.2.367 [DOI] [PubMed] [Google Scholar]
- González-Billault C., Del Río J.A., Ureña J.M., Jiménez-Mateos E.M., Barallobre M.J., Pascual M., Pujadas L., Simó S., Torre A.L., Gavin R., et al. 2005. A role of MAP1B in Reelin-dependent neuronal migration. Cereb. Cortex. 15:1134–1145 10.1093/cercor/bhh213 [DOI] [PubMed] [Google Scholar]
- Goryunov D., He C.Z., Lin C.S., Leung C.L., Liem R.K. 2010. Nervous-tissue-specific elimination of microtubule-actin crosslinking factor 1a results in multiple developmental defects in the mouse brain. Mol. Cell. Neurosci. 44:1–14 10.1016/j.mcn.2010.01.010 [DOI] [PMC free article] [PubMed] [Google Scholar]
- Guo L., Degenstein L., Dowling J., Yu Q.C., Wollmann R., Perman B., Fuchs E. 1995. Gene targeting of BPAG1: abnormalities in mechanical strength and cell migration in stratified epithelia and neurologic degeneration. Cell. 81:233–243 10.1016/0092-8674(95)90333-X [DOI] [PubMed] [Google Scholar]
- Jefferson J.J., Leung C.L., Liem R.K. 2006. Dissecting the sequence specific functions of alternative N-terminal isoforms of mouse bullous pemphigoid antigen 1. Exp. Cell Res. 312:2712–2725 10.1016/j.yexcr.2006.04.025 [DOI] [PubMed] [Google Scholar]
- Kodama A., Karakesisoglou I., Wong E., Vaezi A., Fuchs E. 2003. ACF7: an essential integrator of microtubule dynamics. Cell. 115:343–354 10.1016/S0092-8674(03)00813-4 [DOI] [PubMed] [Google Scholar]
- Kothary R., Clapoff S., Brown A., Campbell R., Peterson A., Rossant J. 1988. A transgene containing lacZ inserted into the dystonia locus is expressed in neural tube. Nature. 335:435–437 10.1038/335435a0 [DOI] [PubMed] [Google Scholar]
- Kreitzer G., Liao G., Gundersen G.G. 1999. Detyrosination of tubulin regulates the interaction of intermediate filaments with microtubules in vivo via a kinesin-dependent mechanism. Mol. Biol. Cell. 10:1105–1118 [DOI] [PMC free article] [PubMed] [Google Scholar]
- Lee S., Kolodziej P.A. 2002. Short Stop provides an essential link between F-actin and microtubules during axon extension. Development. 129:1195–1204 [DOI] [PubMed] [Google Scholar]
- Leung C.L., Sun D., Zheng M., Knowles D.R., Liem R.K. 1999. Microtubule actin cross-linking factor (MACF): a hybrid of dystonin and dystrophin that can interact with the actin and microtubule cytoskeletons. J. Cell Biol. 147:1275–1286 10.1083/jcb.147.6.1275 [DOI] [PMC free article] [PubMed] [Google Scholar]
- Leung C.L., Zheng M., Prater S.M., Liem R.K. 2001. The BPAG1 locus: Alternative splicing produces multiple isoforms with distinct cytoskeletal linker domains, including predominant isoforms in neurons and muscles. J. Cell Biol. 154:691–697 10.1083/jcb.200012098 [DOI] [PMC free article] [PubMed] [Google Scholar]
- Lin C.M., Chen H.J., Leung C.L., Parry D.A., Liem R.K. 2005. Microtubule actin crosslinking factor 1b: a novel plakin that localizes to the Golgi complex. J. Cell Sci. 118:3727–3738 10.1242/jcs.02510 [DOI] [PubMed] [Google Scholar]
- Liu J.J., Ding J., Kowal A.S., Nardine T., Allen E., Delcroix J.D., Wu C., Mobley W., Fuchs E., Yang Y. 2003. BPAG1n4 is essential for retrograde axonal transport in sensory neurons. J. Cell Biol. 163:223–229 10.1083/jcb.200306075 [DOI] [PMC free article] [PubMed] [Google Scholar]
- Liu J.J., Ding J., Wu C., Bhagavatula P., Cui B., Chu S., Mobley W.C., Yang Y. 2007. Retrolinkin, a membrane protein, plays an important role in retrograde axonal transport. Proc. Natl. Acad. Sci. USA. 104:2223–2228 10.1073/pnas.0602222104 [DOI] [PMC free article] [PubMed] [Google Scholar]
- Liu L., Vo A., Liu G., McKeehan W.L. 2005. Distinct structural domains within C19ORF5 support association with stabilized microtubules and mitochondrial aggregation and genome destruction. Cancer Res. 65:4191–4201 10.1158/0008-5472.CAN-04-3865 [DOI] [PMC free article] [PubMed] [Google Scholar]
- Liu Y., Chu A., Chakroun I., Islam U., Blais A. 2010. Cooperation between myogenic regulatory factors and SIX family transcription factors is important for myoblast differentiation. Nucleic Acids Res. 38:6857–6871 10.1093/nar/gkq585 [DOI] [PMC free article] [PubMed] [Google Scholar]
- Lorenzo D.N., Li M.G., Mische S.E., Armbrust K.R., Ranum L.P., Hays T.S. 2010. Spectrin mutations that cause spinocerebellar ataxia type 5 impair axonal transport and induce neurodegeneration in Drosophila. J. Cell Biol. 189:143–158 10.1083/jcb.200905158 [DOI] [PMC free article] [PubMed] [Google Scholar]
- Lowe M. 2011. Structural organization of the Golgi apparatus. Curr. Opin. Cell Biol. 23:85–93 10.1016/j.ceb.2010.10.004 [DOI] [PubMed] [Google Scholar]
- Ma D., Nothias F., Boyne L.J., Fischer I. 1997. Differential regulation of microtubule-associated protein 1B (MAP1B) in rat CNS and PNS during development. J. Neurosci. Res. 49:319–332 [DOI] [PubMed] [Google Scholar]
- Matsuyama A., Shimazu T., Sumida Y., Saito A., Yoshimatsu Y., Seigneurin-Berny D., Osada H., Komatsu Y., Nishino N., Khochbin S., et al. 2002. In vivo destabilization of dynamic microtubules by HDAC6-mediated deacetylation. EMBO J. 21:6820–6831 10.1093/emboj/cdf682 [DOI] [PMC free article] [PubMed] [Google Scholar]
- Meixner A., Haverkamp S., Wässle H., Führer S., Thalhammer J., Kropf N., Bittner R.E., Lassmann H., Wiche G., Propst F. 2000. MAP1B is required for axon guidance and Is involved in the development of the central and peripheral nervous system. J. Cell Biol. 151:1169–1178 10.1083/jcb.151.6.1169 [DOI] [PMC free article] [PubMed] [Google Scholar]
- Miller P.M., Folkmann A.W., Maia A.R., Efimova N., Efimov A., Kaverina I. 2009. Golgi-derived CLASP-dependent microtubules control Golgi organization and polarized trafficking in motile cells. Nat. Cell Biol. 11:1069–1080 10.1038/ncb1920 [DOI] [PMC free article] [PubMed] [Google Scholar]
- Okumura M., Yamakawa H., Ohara O., Owaribe K. 2002. Novel alternative splicings of BPAG1 (bullous pemphigoid antigen 1) including the domain structure closely related to MACF (microtubule actin cross-linking factor). J. Biol. Chem. 277:6682–6687 10.1074/jbc.M109209200 [DOI] [PubMed] [Google Scholar]
- Perkins E.M., Clarkson Y.L., Sabatier N., Longhurst D.M., Millward C.P., Jack J., Toraiwa J., Watanabe M., Rothstein J.D., Lyndon A.R., et al. 2010. Loss of beta-III spectrin leads to Purkinje cell dysfunction recapitulating the behavior and neuropathology of spinocerebellar ataxia type 5 in humans. J. Neurosci. 30:4857–4867 10.1523/JNEUROSCI.6065-09.2010 [DOI] [PMC free article] [PubMed] [Google Scholar]
- Pool M., Boudreau Larivière C., Bernier G., Young K.G., Kothary R. 2005. Genetic alterations at the Bpag1 locus in dt mice and their impact on transcript expression. Mamm. Genome. 16:909–917 10.1007/s00335-005-0073-4 [DOI] [PubMed] [Google Scholar]
- Reed N.A., Cai D., Blasius T.L., Jih G.T., Meyhofer E., Gaertig J., Verhey K.J. 2006. Microtubule acetylation promotes kinesin-1 binding and transport. Curr. Biol. 16:2166–2172 10.1016/j.cub.2006.09.014 [DOI] [PubMed] [Google Scholar]
- Rios R.M., Bornens M. 2003. The Golgi apparatus at the cell centre. Curr. Opin. Cell Biol. 15:60–66 10.1016/S0955-0674(02)00013-3 [DOI] [PubMed] [Google Scholar]
- Rivero S., Cardenas J., Bornens M., Rios R.M. 2009. Microtubule nucleation at the cis-side of the Golgi apparatus requires AKAP450 and GM130. EMBO J. 28:1016–1028 10.1038/emboj.2009.47 [DOI] [PMC free article] [PubMed] [Google Scholar]
- Saldanha A.J. 2004. Java Treeview—extensible visualization of microarray data. Bioinformatics. 20:3246–3248 10.1093/bioinformatics/bth349 [DOI] [PubMed] [Google Scholar]
- Sawamura D., Li K., Chu M.L., Uitto J. 1991. Human bullous pemphigoid antigen (BPAG1). Amino acid sequences deduced from cloned cDNAs predict biologically important peptide segments and protein domains. J. Biol. Chem. 266:17784–17790 [PubMed] [Google Scholar]
- Scales T.M., Lin S., Kraus M., Goold R.G., Gordon-Weeks P.R. 2009. Nonprimed and DYRK1A-primed GSK3 beta-phosphorylation sites on MAP1B regulate microtubule dynamics in growing axons. J. Cell Sci. 122:2424–2435 10.1242/jcs.040162 [DOI] [PMC free article] [PubMed] [Google Scholar]
- Shafey D., Boyer J.G., Bhanot K., Kothary R. 2010. Identification of novel interacting protein partners of SMN using tandem affinity purification. J. Proteome Res. 9:1659–1669 10.1021/pr9006987 [DOI] [PubMed] [Google Scholar]
- Shaw G., Morse S., Ararat M., Graham F.L. 2002. Preferential transformation of human neuronal cells by human adenoviruses and the origin of HEK 293 cells. FASEB J. 16:869–871 [DOI] [PubMed] [Google Scholar]
- Skoufias D.A., Burgess T.L., Wilson L. 1990. Spatial and temporal colocalization of the Golgi apparatus and microtubules rich in detyrosinated tubulin. J. Cell Biol. 111:1929–1937 10.1083/jcb.111.5.1929 [DOI] [PMC free article] [PubMed] [Google Scholar]
- Slep K.C., Rogers S.L., Elliott S.L., Ohkura H., Kolodziej P.A., Vale R.D. 2005. Structural determinants for EB1-mediated recruitment of APC and spectraplakins to the microtubule plus end. J. Cell Biol. 168:587–598 10.1083/jcb.200410114 [DOI] [PMC free article] [PubMed] [Google Scholar]
- Starr D.A. 2007. Communication between the cytoskeleton and the nuclear envelope to position the nucleus. Mol. Biosyst. 3:583–589 10.1039/b703878j [DOI] [PMC free article] [PubMed] [Google Scholar]
- Sun D., Leung C.L., Liem R.K. 2001. Characterization of the microtubule binding domain of microtubule actin crosslinking factor (MACF): identification of a novel group of microtubule associated proteins. J. Cell Sci. 114:161–172 [DOI] [PubMed] [Google Scholar]
- Takemura R., Okabe S., Umeyama T., Kanai Y., Cowan N.J., Hirokawa N. 1992. Increased microtubule stability and alpha tubulin acetylation in cells transfected with microtubule-associated proteins MAP1B, MAP2 or tau. J. Cell Sci. 103:953–964 [DOI] [PubMed] [Google Scholar]
- Tang J., Wu S., Liu H., Stratt R., Barak O.G., Shiekhattar R., Picketts D.J., Yang X. 2004. A novel transcription regulatory complex containing death domain-associated protein and the ATR-X syndrome protein. J. Biol. Chem. 279:20369–20377 10.1074/jbc.M401321200 [DOI] [PubMed] [Google Scholar]
- Teng J., Takei Y., Harada A., Nakata T., Chen J., Hirokawa N. 2001. Synergistic effects of MAP2 and MAP1B knockout in neuronal migration, dendritic outgrowth, and microtubule organization. J. Cell Biol. 155:65–76 10.1083/jcb.200106025 [DOI] [PMC free article] [PubMed] [Google Scholar]
- Thyberg J., Moskalewski S. 1993. Relationship between the Golgi complex and microtubules enriched in detyrosinated or acetylated alpha-tubulin: studies on cells recovering from nocodazole and cells in the terminal phase of cytokinesis. Cell Tissue Res. 273:457–466 10.1007/BF00333700 [DOI] [PubMed] [Google Scholar]
- Thyberg J., Moskalewski S. 1999. Role of microtubules in the organization of the Golgi complex. Exp. Cell Res. 246:263–279 10.1006/excr.1998.4326 [DOI] [PubMed] [Google Scholar]
- Yang Y., Dowling J., Yu Q.C., Kouklis P., Cleveland D.W., Fuchs E. 1996. An essential cytoskeletal linker protein connecting actin microfilaments to intermediate filaments. Cell. 86:655–665 10.1016/S0092-8674(00)80138-5 [DOI] [PubMed] [Google Scholar]
- Yang Y., Bauer C., Strasser G., Wollman R., Julien J.P., Fuchs E. 1999. Integrators of the cytoskeleton that stabilize microtubules. Cell. 98:229–238 10.1016/S0092-8674(00)81017-X [DOI] [PubMed] [Google Scholar]
- Young K.G., Kothary R. 2007. Dystonin/Bpag1—a link to what? Cell Motil. Cytoskeleton. 64:897–905 10.1002/cm.20235 [DOI] [PubMed] [Google Scholar]
- Young K.G., Kothary R. 2008. Dystonin/Bpag1 is a necessary endoplasmic reticulum/nuclear envelope protein in sensory neurons. Exp. Cell Res. 314:2750–2761 10.1016/j.yexcr.2008.06.021 [DOI] [PubMed] [Google Scholar]
- Young K.G., Pool M., Kothary R. 2003. Bpag1 localization to actin filaments and to the nucleus is regulated by its N-terminus. J. Cell Sci. 116:4543–4555 10.1242/jcs.00764 [DOI] [PubMed] [Google Scholar]
- Young K.G., Pinheiro B., Kothary R. 2006. A Bpag1 isoform involved in cytoskeletal organization surrounding the nucleus. Exp. Cell Res. 312:121–134 10.1016/j.yexcr.2005.10.002 [DOI] [PubMed] [Google Scholar]