Background: A previous study indicates that activated astrocytes increased expression of aFGF. We investigated the significance of this phenomenon.
Results: We found that aFGF released by astrocytes potentiated microglial activation through FGFR2 IIIb receptors.
Conclusion: We concluded that astrocytes regulate microglial activation by the aFGF-FGFR2 IIIb signaling pathway.
Significance: This study suggests that astrocytes can control microglial-mediated neurodegeneration.
Keywords: Astrocytes, Fibroblast Growth Factor (FGF), Fibroblast Growth Factor Receptor (FGFR), Microglia, Neuroinflammation
Abstract
Previous studies indicate that astrocytes are the brain cells that express acidic fibroblast growth factor (aFGF) and that the expression is increased upon activation. However, there has been no study investigating the significance of this phenomenon. Here we report that aFGF treatment of IFNγ-stimulated human astrocytes, and LPS/IFNγ-stimulated human microglia, enhances their secretion of inflammatory cytokines and other materials toxic to human neuroblastoma SH-SY5Y cells. The mechanism of aFGF enhancement involves stimulation of the receptor FGFR2 IIIb. We show by RT-PCR that this receptor, but not other FGF receptors, is robustly expressed by astrocytes and microglia. We establish by Western blotting, and immunohistochemistry on postmortem human brain tissue that the FGFR2 IIIb protein is expressed by both of these glial cell types. We blocked the inflammatory stimulant action of aFGF by transfecting microglia and astrocytes with a small inhibitory RNA (siRNA) to FGFR2 IIIb as well as by removal of aFGF using an anti-aFGF antibody. Treatment with bFGF in combination with the stimulants was without effect, but together with aFGF, it partially counteracted the action of aFGF, indicating that it may be a weak antagonist of FGFR2 IIIb. The inflammatory effect was also attenuated by treatment with inhibitors of protein kinase C, Src tyrosine kinase, and MEK-1/2 indicating the involvement of these intracellular pathways. Our data suggest that inhibition of expression or release of aFGF could have therapeutic potential by inhibiting inflammation in neurodegenerative diseases such as Alzheimer disease where many neuroinflammatory molecules are prominently expressed.
Introduction
Fibroblast growth factors (FGFs) are a family of 18 peptides that are known to influence a wide variety of biological processes such as angiogenesis, embryogenesis, differentiation, and proliferation depending on the cell type (1–3). In the central nervous system FGFs induce neurogenesis and differentiation, axon growth and branching, neuroprotection, and lesion repair, through activation of their specific receptors on target cells (4).
FGF receptors (FGFRs)2 are cell surface-bound tyrosine kinase receptors that consist of a highly acidic intracellular domain, a transmembrane domain, immunoglobulin domains, and tyrosine kinase domains. There are four FGFR genes (FGFR1–FGFR4). They have extracellular immunoglobulin domains, which are variable in their expression and influence receptor binding. In particular, alternative splicing of the third immunoglobulin domain in FGFR1 and FGFR2 has led to the identification of the subtypes FGFR1 IIIb, FGFR1 IIIc, FGFR2 IIIb, and FGFR2 IIIc (1, 5).
Activation occurs by dimerization of the transmembrane receptors upon binding of the FGF ligand. This is followed by autophosphorylation of a number of tyrosine residues, some of which can act as recruitment sites for various effecter downstream molecules such as phospholipase Cγ1 and FGFR substrate 2α. Activation of these substrates is essential for activation of signaling pathways such as the Ras-MAP kinase signal relay and the phosphoinositide 3-kinase (PI3K)-Akt signaling pathway (6).
In a previous study of postmortem human brain, it was found that activated astrocytes have increased expression of acidic FGF (aFGF, FGF1) (7). To investigate the significance of this phenomenon, we studied the in vitro effects of aFGF on cultured human astrocytes and microglia, as well as on their surrogate U373 and THP-1 cell lines. We found that aFGF potentiates the inflammatory stimulant effects of LPS and IFNγ. This is due to activation of FGFR2 IIIb, the splicing variant of FGFR2, which is expressed on astrocytes, microglia, and their surrogate THP-1 and U373 cell lines.
EXPERIMENTAL PROCEDURES
Materials
All reagents were purchased from Sigma unless stated otherwise. The following substances were applied to the cell cultures: bacterial LPS (from Escherichia coli 055:B5) and human recombinant IFNγ (from Bachem California, Torrance, CA). The following substances were used in the assays: diaphorase (EC 1.8.1.4, from Clostridium kluyveri, 5.8 units/mg solid), p-iodonitrotetrazolium violet (INT), nicotinamide adenine dinucleotide (NAD+), and MTT (3-(4,5-dimethylthiazol-2-yl)-2,5-diphenyl tetrazolium bromide). Human aFGF and bFGF were purchased from Calbiochem (La Jolla, CA).
Cell Culture and Experimental Protocols
The human THP-1, U373, NT-2, and SK-N-MC cell lines were obtained from the American Type Culture Collection (ATCC). These are standard surrogate cell lines for human microglia, astrocytes, and neurons, respectively. The human neuroblastoma SH-SY5Y cell line was a gift from Dr. R. Ross, Fordham University, New York. All cells were grown in DMEM/F-12 medium containing 10% fetal bovine serum (FBS), 100 IU/ml of penicillin, and 100 μg/ml of streptomycin (Invitrogen) under humidified 5% CO2 and 95% air.
Human astroglia and microglia were isolated from surgically resected temporal lobe tissue. Protocols for culturing these cells have been described in detail previously (8). Tissues were first incubated in a trypsin solution, then pelleted, resuspended, and passed through a nylon filter. They were pelleted once more, resuspended in DMEM/F-12 medium with 10% FBS containing gentamicin, and added to tissue culture plates. Microglial cells adhered first. The nonadherent cells along with myelin debris were transferred into new culture plates. Astrocytes adhered next and were allowed to grow by replacing the medium once a week. New passages of cells were generated by harvesting confluent astrocyte cultures using a trypsin-EDTA solution. The purity of astrocytes and microglia was examined by immunostaining with specific antibodies. For astrocytes, GFAP (1/4000), and for microglia CR3/43 (1/2000) were utilized. The purity of microglia and astrocytes were 97 and 99%, respectively. Representative data are shown in supplemental Fig. S1. Human astrocytes up to the fifth passage were used in the study.
Human astrocytes, THP-1 cells, and U373 cells (5 × 10⁵ cells), as well as human microglia (5 × 10⁴ cells), were seeded into 24-well plates in 800 μl of DMEM/F-12 medium containing 5% FBS. The cells were treated with aFGF alone or with aFGF plus inflammatory stimulants. The cells were also treated with bFGF alone or in combination with aFGF. For microglia and THP-1 cells, the stimulants were LPS at 1 μg/ml and IFNγ at 333 units/ml. For astrocytes and U373 cells, the stimulant was IFNγ alone at 150 units/ml. Cells incubated in medium without the inflammatory stimulants served as controls. After incubation for 2 days, the supernatants (400 μl) were transferred to undifferentiated human neuroblastoma SH-SY5Y cells (2 × 10⁵ cells/well). The cells were incubated for a further 48 h and MTT and LDH assays were performed as described below. For comparative experiments with differentiated SH-SY5Y cells, the cells were first treated with retinoic acid at 5 μm for 4 days (9).
For some experiments, microglia and astrocytes were treated with aFGF and the stimulants plus an inhibitor of Src tyrosine kinase, PP2 (10 μm, Calbiochem, La Jolla, CA) (10), a PKC inhibitor, bisindolylmaleimide (1 μm, Calbiochem) (10) or the MEK-1/2 kinase inhibitor, U0126 (10 μm, Calbiochem) (10). The mixtures were incubated for 6 h before the cell supernatants were transferred to SH-SY5Y cells. After a 72-h incubation, SH-SY5Y cell viability assays were carried out. As controls, microglia and astrocytes were treated with the above stimulants plus the three inhibitors for 6 h before the cell supernatants were transferred to SH-SY5Y cells. After a 72-h incubation, SH-SY5Y cell viability assays were carried out.
To investigate the effects of aFGF on glial-mediated toxicity toward SH-SY5Y cells, anti-aFGF antibody (100 μg/ml, Abnova, Walnut, CA) was added together with aFGF plus stimulants. After 2 days incubation, cell-free supernatants were collected and released cytokine levels were measured. SH-SY5Y cell viability was also examined using the MTT and LDH assays after these cells were exposed to the conditioned medium.
Cell Viability Assays
The viability of SH-SY5Y cells following incubation with glial cell supernatants was evaluated by the lactate dehydrogenase (LDH) release and MTT assays as previously described in detail (11). The amount of LDH released was expressed as a percentage of the value obtained in comparative wells where cells were 100% lysed by 1% Triton X-100. For the MTT assay, data are presented as a percentage of the value obtained from cells incubated in fresh medium only.
Reverse Transcriptase-Polymerase Chain Reaction (RT-PCR)
Total RNA was isolated from human microglia, astrocytes, THP-1, U373, and SH-SY5Y neurons using TRIzol (Invitrogen). Cells (106 cells) were lysed with TRIzol solution and incubated at room temperature for 1 h. The lysates were centrifuged at 10,000 × g for 10 min and supernatants were transferred to new tubes. The purity and amount of the RNA was measured spectrophotometrically. Total RNA (20 μg) was used to synthesize the first strand cDNA using Moloney murine leukemia virus reverse transcriptase (Invitrogen). The cDNA products were then amplified by PCR using a GeneAmp thermal cycler (Applied Biosystems, Foster City, CA). Specific sense and antisense primers for the experiments (12, 13) are listed in Table 1. PCR conditions were as follows: initial denaturation at 95 °C for 6 min followed by a 30-cycle amplification program consisting of denaturation at 95 °C for 45 s, annealing at 55–60 °C for 1 min, and extension at 72 °C for 1 min. A final extension was carried out at 72 °C for 10 min. The amplified PCR products were identified using 1.5% agarose gels containing ethidium bromide (final concentration 0.5 μg/ml) and visualized under ultraviolet light.
TABLE 1.
Primer sequences and amplicon sizes of aFGF, FGFR1–4, FGFR1 IIIb, FGFR1 IIIc, FGFR2 IIIb, and FGFR2 IIIc
| Genes | Primer sequences | Amplicon size |
|---|---|---|
| bp | ||
| aFGF | Forward, 5′-CCAGCACATTCAGCTGCAGCTCAG-3′ | 268 |
| Reverse, 5′-CTTTCTGGCCATAGTGAGTC-3′ | ||
| bFGF | Forward, 5′-GAGGAGTTGTGTCTATCAAAG-3′ | 183 |
| Reverse, 5′-GTTCGTTTCAGTGCCACATACC-3′ | ||
| FGFR1 | Forward, 5′-CTGGGTAGCAACGTGGAGTT-3′ | 368 |
| Reverse, 5′-ACCATGCAGGAGATGAGGAA-3′ | ||
| FGFR2 | Forward, 5′-CTTCCTCTCGTTCCCCAAAT-3′ | 412 |
| Reverse, 5′-GACCAGGCAGATGAAACGAC-3′ | ||
| FGFR3 | Forward, 5′-AGCAGGAGCAGTTGGTCTTC-3′ | 311 |
| Reverse, 5′-TGTGTCCACACCTGTGTCCT-3′ | ||
| FGFR4 | Forward, 5′-CCTGAGGAGCTGTGAGAAGG-3′ | 303 |
| Reverse, 5′-TCAGGTAGGAAGCTGGCAAT-3′ | ||
| FGFR1 IIIb | Forward, 5′-TCTGGTGACAGTGAGCCA-3′ | 396 |
| Reverse, 5′-CTCTTCAGAGGAGAAAGAAACAGATA-3′ | ||
| FGFR1 IIIc | Forward, 5′-CATCTCTTTGTCGGTGGTATTAACTCCA-3′ | 517 |
| Reverse, 5′-GACAAAGAGATGGAGGTGCT-3′ | ||
| FGFR2 IIIb | Forward, 5′-CGGGGATAAATAGTTCCAAT-3′ | 140 |
| Reverse, 5′-CTTGCTGTTTTGGCAGGACAGTGA-3′ | ||
| FGFR2 IIIc | Forward, 5′-ACGGACAAAGAGATTGAGGT-3′ | 127 |
| Reverse, 5′-CTGGCAGAACTGTCAACCATGCAGAGT-3′ | ||
| GAPDH | Forward, 5′-CCATGTTCGTCATGGGTGTGAACCA-3′ | 251 |
| Reverse, 5′-GCCAGTAGAGGCAGGGATGATGTTC-3′ |
Measurement of TNFα and IL-6 Release
Cytokine levels were measured in cell-free supernatants following 6 or 48 h incubation of THP-1 cells, U373 cells, microglial cells, and astrocytes. The cell stimulation protocols were the same as described above for measuring cell viability. Quantitation was performed with ELISA detection kits (Peprotech, NJ) following protocols described by the manufacturer.
Measurement of Released aFGF Levels
Released aFGF levels were measured in cell-free supernatants following 2 days incubation of THP-1 cells, U373 cells, microglial cells, and astrocytes, as well as NT-2, SK-N-MC, and SH-SY5Y cells. Quantitation was performed with ELISA detection kits (R&D Systems Inc., Montgomery, TX) following protocols described by the manufacturer.
Small Interfering RNA (siRNA) Studies
Human microglia and astrocyters were transfected with FGFR2 IIIb siRNA-1 or siRNA-2 and scramble siRNA (sc-siRNA) (shown in Table 2) using LipofectamineTM RNAiMAX (Invitrogen). The RNAs were designed and supplied by Qiagen (Valencia, CA). The protocols were performed according to the manufacturer's recommendations. Two days after siRNA transfection, cells were lysed for determining the expression of FGFR2 IIIb and IIIc proteins (see “Western Blotting”). The transfected cells were treated with aFGF or bFGF plus LPS/IFNγ for microglia or IFNγ for astrocytes for 2 days and their conditioned media were collected to measure TNFα and IL-6 levels. SH-SY5Y cell viability after 2 days incubation with their conditioned media was examined with MTT assays. For some experiments, siRNA-transfected cells were treated with aFGF and the stimulants plus an inhibitor of Src tyrosine kinase, PP2 (10 μm, Calbiochem) (10), a PKC inhibitor, bisindolylmaleimide (1 μm, Calbiochem) (10), or the MEK-1/2 kinase inhibitor, U0126 (10 μm, Calbiochem) (10). The mixtures were incubated for 6 h before the cell supernatants were transferred to SH-SY5Y cells. After a 72-h incubation, SH-SY5Y cell viability assays were carried out. Measurements of TNFα and IL-6 were also performed.
TABLE 2.
Scramble and siRNA sequences for FGFR2 IIIb
| Sequences | |
|---|---|
| Scramble RNA | 5′-AAUGUGGUGUACCCUCCUGGAUU-3′ |
| FGFR2 IIIb siRNA-1 | 5′-AAGUGCUGGCUCUGUUCAAUGUU-3′ |
| FGFR2 IIIb siRNA-2 | 5′-AAUUAUAUAGGGCAGGCCAACUU-3′ |
Western Blotting
Western blotting on cell lysates was performed as described by Lee et al. (8). Briefly, after exposure to stimulants plus aFGF or bFGF, human microglia and astrocytes were treated with a lysis buffer (150 mm NaCl, 12 mm deoxycholic acid, 0.1% Nonidet P-40, 0.1% Triton X-100, and 5 mm Tris-EDTA, pH 7.4). The protein concentration of the cell lysates was then determined using a BCA protein assay reagent kit (Pierce). Proteins in each sample were loaded onto gels and separated by 10% SDS-PAGE (150 V, 1.5 h). The loading quantities of lysate proteins were 100 μg. Following SDS-PAGE, proteins were transferred to a PVDF membrane (Bio-Rad) at 30 mA for 2 h. The membranes were blocked with 5% milk in PBS-T (80 mm Na2HPO4, 20 mm NaH2PO4, 100 mm NaCl, 0.1% Tween 20, pH 7.4) for 1 h and incubated overnight at 4 °C with a polyclonal anti-phospho-p38 MAP kinase antibody (9211, Cell Signaling, Beverly, MA, 1/2000), anti-phospho-p65 NFκB antibody (3031, Cell Signaling, 1/1000), or the monoclonal anti-FGFR2 IIIb antibody (R&D Systems, 1/1,000). The membranes were then treated with a horseradish peroxidase-conjugated anti-IgG (P0448, DAKO, Mississauga, Ontario, CA, 1:2000) or the secondary antibody anti-mouse IgG (A3682, Sigma, 1/3000) for 3 h at room temperature and the bands were visualized with an enhanced chemiluminescence system and exposure to photographic film (Hyperfilm ECLTM, Amersham Biosciences). Equalization of protein loading was assessed independently using α-tubulin as the housekeeping protein. The primary antibody was anti-α-tubulin (T6074, Sigma, 1/2000) and the secondary antibody anti-mouse IgG (A3682, Sigma, 1:3000). Primary antibody incubation was overnight at 4 °C and the secondary antibody incubation was for 3 h at room temperature. For expression of aFGF and bFGF, monoclonal anti-aFGF antibody (Abnova, Walnut, CA, 1/2000) or monoclonal anti-bFGF antibody (Abnova, 1/2000) was used. For the secondary antibody, anti-mouse IgG antibody (A3682, Sigma, 1/3000) was utilized. For protein expression of FGFR1 IIIb, FGFR1 IIIc, FGFR2 IIIb, and FGFR2 IIIc, the following antibodies were utilized: monoclonal anti-FGFR1 antibody (MAB658, R&D Systems, 1/2,000), monoclonal anti-FGFR2 (MAB6843, R&D Systems, 1/2,000) and, as the secondary antibody, anti-mouse IgG (A3682, Sigma, 1:3000).
To investigate the effects of standard inflammatory stimulants (LPS/IFNγ for microglia and THP-1 cells and IFNγ for astrocytes and U373 cells), as well as aFGF and bFGF on expression of FGFR isoforms, further Western blotting experiments were carried out. Microglia and THP-1 cells were treated with LPS/IFNγ and astrocytes and U373 cells with IFNγ, aFGF (100 pg/ml), or bFGF (100 ng/ml) for 2 days. The cells were extracted for Western blotting as previously described. For STAT-1 activation studies, polyclonal anti-phospho-STAT-1 (9177, Cell Signaling, 1/2000) and a horseradish peroxidase-conjugated anti-IgG (P0448, DAKO, 1:2000) were employed.
Immunohistochemistry
Three elderly control cases without known neurological symptoms (age 71–78 years) and five cases with Alzheimer disease (age 71–87 years, Braak stage IV and V) were selected for study from our brain bank at the University of British Columbia. Immunohistochemistry was carried out as previously described in detail (14). Briefly, brain tissues were fixed in 4% paraformaldehyde, and, after 3 to 4 days, transferred to a 15% buffered sucrose maintenance solution. Other tissues were fixed in formalin and embedded in paraffin. For single immunostaining, 30-μm sections were pretreated with 0.5% H2O2, blocked with 5% skim milk, and incubated in primary antibodies anti-FGFR2 IIIb (R&D Systems, MAB665, 1:1000) or anti-aFGF (source, 1/100) in PBS-T for 72 h at 4 °C or overnight at room temperature. Sections were next treated with the appropriate biotinylated secondary antibody (DAKO, 1/2000) for 2 h at room temperature, followed by incubation in a avidin-biotinylated horseradish peroxidase complex (DAKO) for 1 h at room temperature. Peroxidase labeling was visualized by incubation in 0.01% 3,3′-diaminobenzidine containing 1% nickel ammonium sulfate, 5 mm imidazole, and 0.001% H2O2 in 0.05 m Tris-HCl buffer, pH 7.6. When a dark purple color developed, sections were mounted on glass slides. In some sections, antigen retrieval was carried out by incubating the sections in boiling PBS for 5 min prior to all other steps.
For double immunofluorescence staining, sections were incubated for 72 h at 4 °C or overnight at room temperature with a combination of the anti-FGFR2 IIIb antibody (1:500) with either a specific marker for astrocytes (anti-GFAP DAKO polyclonal, 1:1000), or a specific marker for microglia (IBA-1 Wako Chemicals, Richmond, VA, 1:500). Sections were next incubated with a mixture of fluorophore-labeled secondary antibodies (Alexa Fluor 488 goat anti-mouse, green; and Alexa Fluor 546 goat anti-rabbit, red, Invitrogen; 1:500) in the dark, counterstained with the nuclear dye Hoechst 33258 (Invitrogen), and mounted on glass slides. To reduce lipofuscin autofluorescence, sections were next treated with a solution of 0.3% Sudan Black B (Gurr Ltd., London, UK) in 70% ethanol for 7 min and washed repeatedly in PBS. Subsequently sections were air-dried and coverslipped with Prolong Gold (Invitrogen).
Controls for immunostaining were performed by omitting the primary antibodies. No staining was observed in these controls. Images were acquired using an Olympus BX51 microscope and a digital camera (Olympus DP71, Center Valley, PA).
For estimating the purity of astrocytic and microglial cell cultures, aliquots of the cultures were placed on glass slides for 12 h. The attached cells were then fixed with 4% paraformaldehyde for 1 h at 4 °C, and permeablized with 0.1% Triton X-100 for 1 h at room temperature. After washing twice with PBS, the astrocytic culture slides were treated with a monoclonal anti-GFAP antibody (1/4,000, DAKO), and the microglial slides with the monoclonal anti-CR3/43 antibody (1/2,000, DAKO) for 3 h at room temperature. The slides were then incubated with Alexa Fluor 546 goat anti-mouse (Invitrogen, 1:500) in the dark for 3 h at room temperature to yield a positive red fluorescence. To visualize all cells, the slides were washed twice with PBS and counterstained with the nuclear dye DAPI (100 μg/ml, Sigma) to give a blue fluorescent color. Images were acquired using an Olympus BX51 microscope and a digital camera (Olympus DP71). Fluorescent images were colocalized with ImagePro software (Improvision Inc., Waltham, MA).
Data Analysis
The significance of differences in data sets was analyzed by Student's t test and one-way or two-way ANOVA tests. Multiple group comparisons were followed where appropriate by a post hoc Bonferroni test.
RESULTS
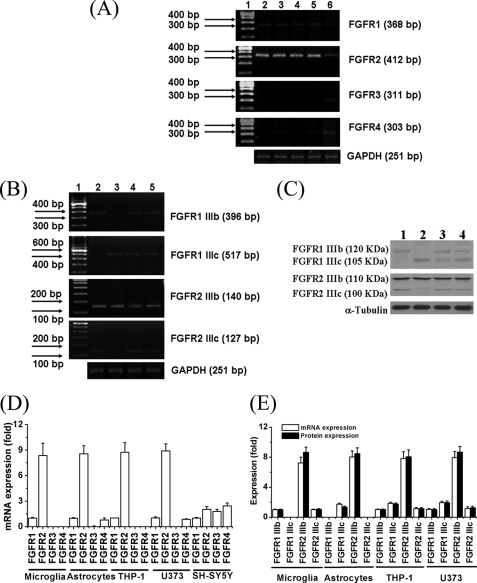
We examined by RT-PCR all the cultured cell types for expression of the four different FGF receptors, and, in addition, the IIIb and IIIc subtypes of FGFR1 and FGFR2. The primers utilized are shown in Table 1. Fig. 1 illustrates the results. Microglia, THP-1 cells, astrocytes, and U373 cells strongly expressed FGFR2 (Fig. 1A), which turned out to be the FGFR2 IIIb subtype (Fig. 1, B for mRNAs and C for proteins). SH-SY5Y cells expressed relatively low amounts of FGFR2, FGFR3, and FGFR4. Trace amounts of other receptors were detected in all cell types. Quantitative results for the seven receptor mRNAs studied are shown in Fig. 1, D and E. They show that only FGFR2, and its IIIb subtype, were prominently expressed on astrocytes, microglia, U373 cells, and THP-1 cells. Equal loading of each lane was demonstrated by equal intensity of the housekeeping GAPDH band.
FIGURE 1.
A, expression of mRNAs of the four FGF receptor genes (FGFR1–4) in various cells. The lanes are: 1, 100-bp ladder; 2, microglia; 3, astrocytes; 4, THP-1 cells; 5, U373 cells; and 6, SH-SY5Y cells. GAPDH loading controls are shown in the lower panel. Expression of mRNAs (B) and proteins (C) for the two spliced variants of FGFR1 and -2 (FGFR1 IIIb, FGFR1 IIIc, FGFR2 IIIb, FGFR2 IIIc), in glial cells are indicated. B, lane 1, 100-bp ladder; 2, microglia; 3, astrocytes; 4, THP-1 cells; and 5, U373 cells. GAPDH loading controls are shown in the lower panel. Equalization of sample loading was assessed independently using GAPDH as the housekeeping protein. Three independent experiments were performed and these were representatives. C, 1, microglia; 2, astrocytes; 3, THP-1 cells; and 4, U373 cells. Equalization of sample loading was assessed independently using α-tubulin as the housekeeping protein. Three independent experiments were performed and these were representatives. D and E, quantitative results. Values are mean ± S.E., n = 3. D, notice that FGFR2 is the major FGFR in glial cells, but SH-SY5Y cells express small amounts of all four FGFR genes. E, FGFR2 IIIb is the major receptor in all the glial cells examined.
An earlier study indicated that Toll-like receptor 4 and interferon-γ receptors (IFNγRs) are functionally expressed on THP-1 cells. Simultaneous treatment with specific agonists of these receptors (LPS and IFNγ, respectively) potentiated stimulation of these cells (15). Later it was reported that astrocytes and their surrogate U373 cells could be stimulated by IFNγ, but not by LPS. In addition, LPS could not potentiate IFNγ-mediated astrocytic activation (16). Therefore we stimulated microgia and THP-1 cells with LPS/IFNγ and astrocytes and U373 cells with IFNγ only to investigate the expression of aFGF and bFGF in stimulated and unstimulated cells.
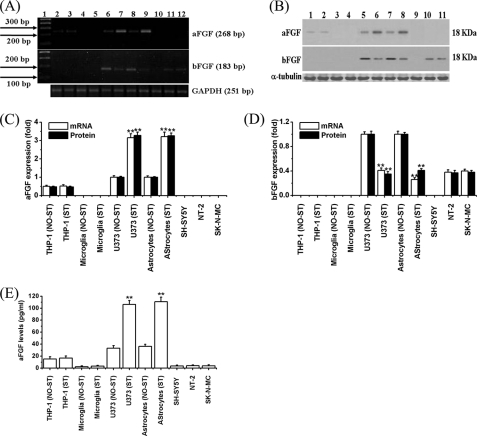
Fig. 2, A–D, demonstrates the mRNA and protein expression of aFGF in unstimulated, compared with stimulated cells. The cells included astrocytes, U373 cells, microglia, and THP-1 cells, as well as the three neuronally committed cell lines SH-SY5Y, NT-2, and SK-N-MC. Unstimulated astrocytes and their surrogate U373 cells expressed detectable aFGF mRNA and proteins, and the expression was increased by ∼3-fold when they were stimulated with IFNγ for 2 days (lanes 6–9 in Fig. 2, A, upper panel for mRNA and lanes 5–8 in B, upper panel for protein). THP-1 cells also expressed aFGF, with the amount being about half that of astrocytes or U373 cells, but stimulation with LPS/IFNγ did not change the levels of its expression (Fig. 2, lanes 2 and 3 in A, upper panel for mRNA, and lanes 1 and 2 in B, upper panel for protein). Microglia did not express aFGF under any conditions (Fig. 2, lanes 4 and 5 in A, upper panel for mRNA, and lanes 3 and 4 in B, upper panel for protein). NT-2, SK-N-MC, and SH-SY5Y cells also failed to express aFGF (Fig. 2, lanes 10–12 in A, upper panel for mRNA, and lanes 9–11 in B, upper panel for protein).
FIGURE 2.
Expression of aFGF and bFGF in stimulated or unstimulated cells. A, mRNAs by RT-PCR and B, proteins by Western blot analyses. A, lane 1, 100-bp ladder; 2, unstimulated THP-1 cells; 3, LPS/IFNγ-stimulated THP-1 cells; 4, unstimulated microglia; 5, LPS/IFNγ-stimulated microglia; 6, unstimulated U373 cells; 7, IFNγ-stimulated U373 cells; 8, unstimulated astrocytes; 9, IFNγ-stimulated astrocytes; 10, SH-SY5Y cells; 11, NT-2 cells; and 12, SK-N-MC cells. B, 1, unstimulated THP-1 cells; 2, LPS/IFNγ-stimulated THP-1 cells; 3, unstimulated microglia; 4, LPS/IFNγ-stimulated microglia; 5, unstimulated U373 cells; 6, IFNγ-stimulated U373 cells; 7, unstimulated astrocytes; 8, IFNγ-stimulated astrocytes; 9, SH-SY5Y cells; 10, NT-2 cells; and 11, SK-N-MC cells. GAPDH loading controls for mRNA, and α-tubulin loading controls for protein are shown in the lower panels. THP-1 cells, U373 cells, and astrocytes, but not microglia, SH-SY5Y cells, NT-2 cells, or SK-N-MC cells, express aFGF. U373 cells, astrocytes, NT-2 cells, and SK-N-MC cells, but not THP-1 cells, microglia, or SH-SY5Y cells, express bFGF. The levels were increased upon IFNγ stimulation of U373 cells and astrocytes. C and D, quantitative results. The densitometry values of each band were normalized to GAPDH or α-tubulin, respectively. For mRNA and protein data, the densities of bands were compared with those of unstimulated U373 cells or unstimulated astrocytes. Values are mean ± S.E., n = 3. Significance of differences was tested by t test. **, p < 0.01 for stimulated (ST) U373 cells and astrocytes compared with the unstimulated (NO-ST) cells. E, levels of released aFGF in unstimulated and stimulated cells. After the four different cell types were activated with stimulants for 2 days, cell-free supernatants were collected to measure the levels of aFGF using a specific ELISA kit. Values are mean ± S.E., n = 3. Significance of differences was tested by t test. **, p < 0.01 for stimulated U373 cells and astrocytes compared with the unstimulated cells.
Astrocytes and their surrogate U373 cells also expressed mRNA and proteins for bFGF. The expression was decreased when they were stimulated with IFNγ for 2 days (60–70% decrease, Fig. 2, lanes 2 and 3 in A, lower panel for mRNA, and lanes 1 and 2 in B, lower panel for protein). However, microglia and THP-1 cells did not express bFGF in any of the conditions examined (Fig. 2, lanes 2–5 in A, lower panel for mRNA, and lanes 1–4 in B, lower panel for protein). NT-2 and SK-N-MC cells, but not SH-SY5Y cells, expressed bFGF. The amount was ∼40% of that expressed by unstimulated astrocytes or U373 cells (Fig. 2, lanes 10–12 in A, lower panel for mRNA, and lanes 9–11 in B, lower panel for protein). Quantitative results are shown in Fig. 2, C and D.
Expression of aFGF was confirmed by ELISA results. It was released into the medium by astrocytes or U373 cells (35 pg/ml) and the levels increased ∼3-fold upon stimulation with LPS/IFNγ (105–110 pg/ml, p < 0.01) (Fig. 2E). THP-1 cells released 15 pg/ml of aFGF under normal conditions and the levels were not altered if these cells were stimulated with LPS/IFNγ. Microglia and the three neuronal cells lines did not express or release aFGF under any of the conditions examined (Fig. 2E).
Because previous studies indicate that the affinity of bFGF for the FGFR2 IIIb isoform is less than 10% that of aFGF (4, 17), we hypothesized that there would be functional differences between aFGF and bFGF in inducing glial cell toxicity toward SH-SY5Y cells. To determine the most appropriate concentrations to utilize as the standard for these experiments, we did a preliminary study in which THP-1 and U373 cells were exposed to varying concentrations of aFGF plus stimulants (LPS/IFNγ for THP-1 cells and IFNγ for U373 cells) for 2 days. Their cell-free supernatants were then incubated with SH-SY5Y cells for 48 h. The resultant viability of the SH-SY5Y cells was measured by the MTT assay. The results are shown in supplemental Fig. S2, A and B. aFGF at concentrations of 0.001 to 0.01 pg/ml did not induce significant toxicity. However, toxicity commenced at 0.1 pg/ml and reached a maximum at 100 pg/ml of aFGF, which is close to the value shown in Fig. 2E. Direct treatment with aFGF, bFGF, LPS/IFNγ, or IFNγ was not toxic to SH-SY5Y cells even at a concentration as high as 1 μg/ml (see supplemental Fig. S2C).
Based on these pilot experiments, we used 100 pg/ml as the standard aFGF concentration for further experiments. THP-1 cells, U373 cells, microglia, and astrocytes were exposed to 100 pg/ml of aFGF and/or bFGF plus the standard stimulants for 48 h. The stimulants were LPS/IFNγ for microglia and THP-1 cells and IFNγ for astrocytes and U373 cells. The toxic supernatants were transferred to SH-SY5Y cells for a further 48-h incubation. MTT and LDH release assays were then performed on the SH-SY5Y cells.
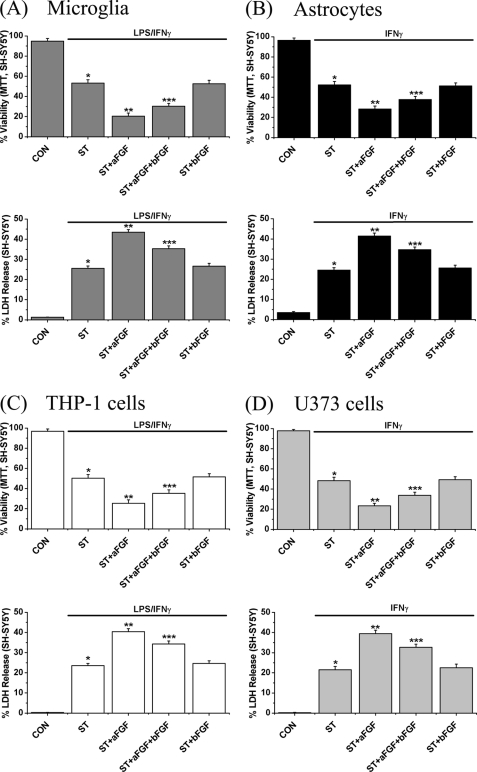
Fig. 3 demonstrates the results. MTT data are shown in the upper panel and LDH release in the lower panel. Exposure to stimulated microglial or astrocytic supernatants for 48 h reduced SH-SY5Y cell viability by 50% (p < 0.01). Treatment with aFGF potentiated this glial-mediated neurotoxicity by 75% (p < 0.01, Fig. 3, A, microglia, and B, astrocytes). Treatment with 100 pg/ml of bFGF was not effective by itself, but, when combined with aFGF, it reduced the effects of aFGF-mediated neurotoxicity by about 10% (p < 0.01). Effects of aFGF and bFGF on stimulated THP-1 or U373 toxicity toward SH-SY5Y cells replicated the microglial and astrocytic data (Fig. 3, C, THP-1 cells, and D, U373 cells). When aFGF and bFGF (100 pg/ml each) were added to stimulated supernatants after the supernatants had been separated, they were without effect, indicating that they had no direct toxic activity toward SH-SY5Y cells (see supplemental Fig. S3, A–D).
FIGURE 3.
Effects of treatment with aFGF or bFGF on SH-SY5Y viability changes induced by supernatants from (A) stimulated human microglia, (B) stimulated human astrocytes, (C) stimulated THP-1 cells, and (D) stimulated U373 cells. Stimulants were LPS/IFNγ for microglia and THP-1 cells and, IFNγ for astrocytes and U373 cells. After glial cells were treated with stimulants plus aFGF and/or bFGF (100 pg/ml each) for 2 days, their cell-free supernatants were transferred to SH-SY5Y cells. Reductions in the numbers of live cells are indicated by the MTT assay (upper panels), and increases in the numbers of dead cells by LDH release (lower panels). Notice that stimulation increased the toxicity of aFGF in all cell types, whereas bFGF was without effect by itself. It weakly, but significantly, counteracted the effect of aFGF when added in combination. Values are mean ± S.E., n = 4. One-way ANOVA was carried out to test significance. Multiple comparisons were followed with post hoc Bonferroni tests where appropriate. *, p < 0.01 for stimulated cells (ST group) compared with unstimulated cells (CON group), **, p < 0.01 for the ST + aFGF group compared with ST group, and ***, p < 0.01 for the ST + aFGF + bFGF group compared with the ST + aFGF group.
Further experiments were performed to investigate whether there were differences in viability change between differentiated and undifferentiated SH-SY5Y cells. For this investigation, SH-SY5Y cells were first differentiated with retinoic acid at 5 μm for 4 days (9). THP-1 cells, U373 cells, astrocytes, and microglia were exposed to aFGF or bFGF plus stimulants for 48 h. Differentiated or undifferentiated SH-SY5Y cells were exposed to the conditioned media for 2 days. The MTT assay was employed to examine viability changes. Supplemental Fig. S4 shows the results. The data indicate that viability loss of differentiated and undifferentiated SH-SY5Y cells induced by the conditioned medium were similar in the presence of aFGF and/or bFGF. Therefore we performed further experiments with undifferentiated SH-SY5Y cells.
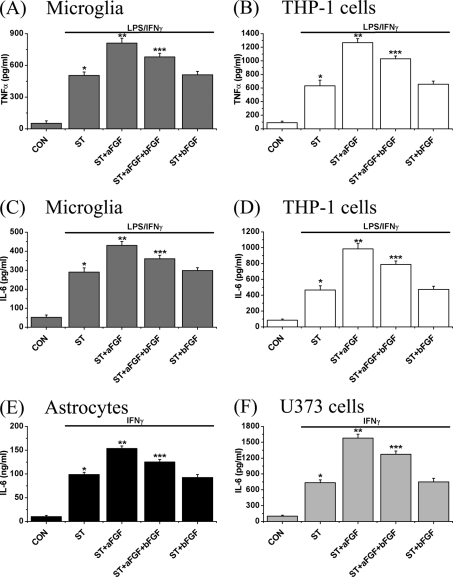
To determine whether the aFGF/bFGF effects were correlated with the release of inflammatory factors, the levels of TNFα and IL-6 were measured in the microglia and THP-1 cell supernatants (Fig. 4). In microglia, there was an almost 10-fold increase in TNFα in the presence of LPS/IFNγ for 2 days (p < 0.01) and there was a further increase when there was an additional exposure to aFGF (16-fold, p < 0.01). This aFGF increase was attenuated when it was added together with bFGF (12% decrease, p < 0.01), whereas bFGF alone did not change the levels of these cytokines (Fig. 4A).
FIGURE 4.
Effect of treatment with aFGF or bFGF on release of the inflammatory cytokines TNFα from microglia (A), THP-1 cells (B), as well as IL-6 from microglia (C), THP-1 cells (D), astrocytes (E), and U373 cells (F). Microglia and THP-1 cells were stimulated (ST) with LPS/IFNγ, whereas astrocytes and U373 cells were stimulated only with IFNγ. Control (CON) incubates were cells without stimulation or other treatment. Incubations plus aFGF and/or bFGF (100 pg/ml each) were carried out for 2 days and the released cytokine levels were measured using ELISA kits. Values are mean ± S.E., n = 4. Notice that aFGF treatment enhanced the release of both TNFα and IL-6, whereas bFGF was without effect by itself but partially inhibited the effects of aFGF when added in combination. One-way ANOVA was carried out to test the significance of differences. Multiple comparisons were followed with post hoc Bonferroni tests where appropriate. *, p < 0.01 for stimulated cells (ST group) compared with unstimulated cells (CON group); **, p < 0.01 for the ST + aFGF group compared with the ST group; and ***, p < 0.01 for the ST + aFGF + bFGF group compared with the ST + aFGF group.
In THP-1 cells, there was a 6-fold increase in IL-6 (p < 0.01) and this was also enhanced by aFGF (13-fold, p < 0.01). This increase was attenuated by bFGF treatment (20% attenuation, p < 0.01, Fig. 4B). Levels of secreted IL-6 from LPS/IFNγ-stimulated microglia were also increased (4.6-fold, p < 0.01) and this was further increased in the presence of aFGF (6-fold, p < 0.01). Treatment with bFGF inhibited the aFGF increase (13% attenuation, p < 0.01, Fig. 4C). This same trend was observed in levels of IL-6 released from LPS/IFNγ-activated THP-1 cells (Fig. 4D).
As far as astrocytes are concerned, IL-6 is the main inflammatory mediator that is generated (18). There was an approximate 9.5-fold increase in the supernatant concentration of IL-6 from astrocytes (Fig. 4E), and a 7.3-fold increase from U373 cells (Fig. 4F). The increase was potentiated by aFGF (15-fold in both types of cells, p < 0.01). Again, bFGF attenuated the increase (10–15% decrease, p < 0.01), but it was without effect when added alone. Treatment with aFGF and/or bFGF after stimulation did not change the levels of released TNFα and IL-6 in microglia, astrocytes, THP-1 cells, and U373 cells (see supplemental Fig. S5).
Further experiments indicate that treatment of nonstimulated THP-1 or U373 cells with aFGF or bFGF (0.001–1000 pg/ml each) did not induce an increase in levels of TNFα or IL-6 in the conditioned medium (see supplemental Fig. S6, C–E). Moreover, such treatment did not result in SH-SY5Y cell viability changes mediated by the conditioned medium after 2 days incubation (supplemental Fig. S6, A and B). This indicates that aFGF, but not bFGF, is acting only to enhance the effects of the inflammatory stimulators.
The effects of treatment with the standard stimulants (LPS/IFNγ for microglia and THP-1 cells and IFNγ for astrocytes and U373 cells), as well as aFGF or bFGF, on expression of the four FGFR isoforms shown in Fig. 1C are demonstrated in supplemental Fig. S7. Western blotting results indicate that there were no alterations in expression of FGFR1 IIIb, FGFR1 IIIc, FGFR2 IIIb, or FGFR2 IIIc by any of the treatments.
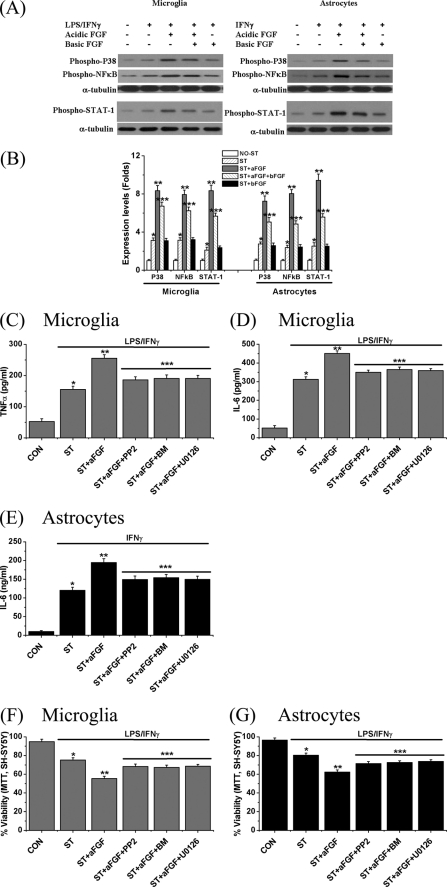
To investigate the mechanisms by which aFGF and bFGF influence the neuroinflammatory response, we examined extracts of microglial and astrocytic cells for evidence of activation of known intracellular inflammatory pathways. Cells were treated with stimulants plus aFGF and/or bFGF for 2 h at 37 °C. Western blotting results are detailed in Fig. 5A (left panel for microglial extracts, and right panel for astrocytic extracts). Fig. 5B summarizes the quantitative results. Treatment with LPS/IFNγ for microglia and IFNγ for astrocytes produced an induction of phospho-NFκB (3.2-fold for microglia and 2.5-fold for astrocytes), phospho-p38 MAPK (3.2-fold for microglia and 2.7-fold for astrocytes), and phospho-STAT-1 (2.1-fold for microglia and 2.5-fold for astrocytes). In accordance with the cytokine release data, addition of aFGF to the culture medium further increased the response (7.2–9-fold, p < 0.01). However, co-administration of bFGF attenuated this action (25–40% decreases, p < 0.01). bFGF alone was ineffective in stimulating this activation.
FIGURE 5.
Effect of treatment with aFGF or bFGF on levels of phospho-p38 and, phospho-p65-NFκB and phospho-STAT-1 proteins in human microglia (A, left panel) and astrocytes (A, right panel). Cell extracts were prepared and the proteins were separated by SDS-PAGE. Representative blots are shown in A and quantitative results in B. To ensure equal loading, the densitometric value of each band was normalized to the corresponding band for α-tubulin. Notice the sharp increase in the inflammatory markers phospho-p38 MAPK, phospho-p65-NFκB, and phospho-STAT-1 by stimulants. These were enhanced by aFGF treatment, but reduced by co-treatment with bFGF. Values are mean ± S.E., n = 3. One-way ANOVA was carried out to examine the significance of differences. *, p < 0.01 for stimulated cells (ST group) compared with unstimulated cells (CON group); **, p < 0.01 for the ST + aFGF group compared with the ST group; and ***, p < 0.01 for the ST + aFGF + bFGF group compared with the ST + aFGF group. C-G, effect of treatment with PP2 (an inhibitor of Src tyrosine kinase family, 10 μm), bisindolylmaleimide (BM, a PKC inhibitor, 1 μm), or U0126 (a MEK-1/2 kinase inhibitor, 10 μm) on aFGF-mediated cytokine release and glial neurotoxicity. Released levels of TNFα (C) and IL-6 (D) from microglia, and IL-6 (E) from astrocytes following treatment with LPS/IFNγ for microglia or IFNγ for astrocytes for 6 h are shown. MTT results on SH-SY5Y cell viability changes were induced by stimulated microglia (F) and astrocytes (G). Values are mean ± S.E., n = 4. Significance by one-way ANOVA. Notice that each inhibitor significantly reduced the effect of aFGF stimulation. *, p < 0.01 for stimulated cells (ST group) compared with unstimulated cells (CON group); **, p < 0.01 for the ST + aFGF group compared with ST group; and ***, p < 0.01 for the ST + aFGF + PP2, ST + aFGF + BM, and ST + aFGF + U0126 groups compared with the ST + aFGF group.
A further set of experiments was conducted to investigate the possible involvement of intracellular protein kinase C (PKC), Src tyrosine kinase, and MEK-1/2 kinase, as links between FGFR2 IIIb activation and p38 MAP kinase/NFκB induction. These proteins are known to be involved in the functioning of FGFs in cell types other than astrocytes and microglia (1, 10). We incubated astrocytes and microglia with inhibitors of these proteins (bisindolylmaleimide for PKC, 1 μm; PP2 for Src tyrosine kinase, 10 μm; and U0126 for MEK-1/2, 10 μm) with aFGF plus stimulants for 6 h. We then measured the levels of cytokines and examined their effects on glial toxicity toward SH-SY5Y cells.
These inhibitors reduced levels of TNFα (Fig. 5C) and IL-6 (Fig. 5D) in microglia by 60–70% with a similar reduction of IL-6 in astrocytes (Fig. 5E). They also attenuated aFGF-mediated glial toxicity toward SH-SY5Y cells by 60–75% by the MTT assay (Fig. 5, F for microglia and G for astrocytes). These results indicate the involvement of PKC, Src tyrosine kinase, and MEK-1/2 in aFGF-FGFR2 IIIb stimulation of inflammatory pathways in both astrocytes and microglia.
To investigate whether FGFR2 IIIb signaling is specifically abrogated by these three inhibitors, experiments on stimulated microglia and astrocytes using these inhibitors were performed. The protocol was exactly the same except that aFGF and bFGF were omitted. The data are shown in supplemental Fig. S8. The data indicate that the three inhibitors were without affect on LPS/IFNγ- or IFNγ-mediated microglial or astrocytic neurotoxicity, and were without effect on levels of released TNFα and IL-6.
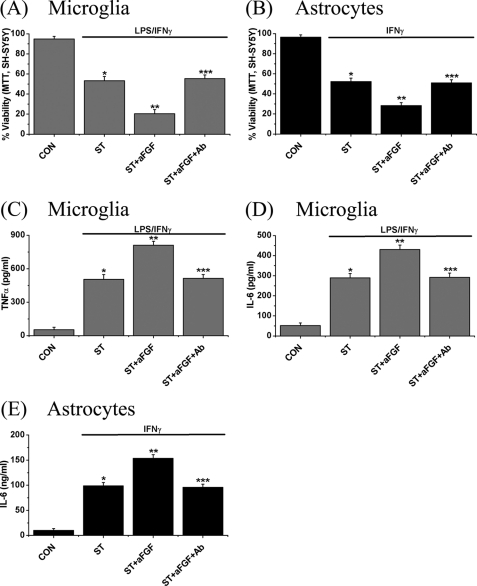
To confirm the effects of aFGF on toxicity of conditioned medium from stimulated microglia or astrocytes toward SH-SY5Y cells, the microglia and astrocytes were treated with the standard stimulants plus aFGF (100 pg/ml) along with anti-aFGF antibody (100 μg/ml) for 2 days. Their cell-free supernatants were then transferred to SH-SY5Y cells. After 2 days the MTT assay was employed to measure SH-SY5Y cell viability. Levels of cytokines such as TNFα and IL-6 in the presence of the antibody in conditioned medium were also measured. Fig. 6 shows the results. Addition of the anti-aFGF antibody completely blocked the effects of aFGF on toxicity of the stimulated glial-conditioned medium (Fig. 6, A and B). It also reduced the levels of released cytokines from the stimulated microglia and astrocytes (Fig. 6, C–E). The antibody itself did not affect SH-SY5Y cell viability when applied directly (supplemental Fig. S2C).
FIGURE 6.
Effects of treatment with anti-aFGF antibody (100 μg/ml) on aFGF-mediated neurotoxicity and cytokine release. Microglia (A) and astrocytes (B) were activated in the presence of aFGF (100 pg/ml) plus anti-aFGF antibody (100 μg/ml) for 2 days and their conditioned medium was transferred to SH-SY5Y cells. The MTT assay was performed on SH-SY5Y after 2 days showing that the aFGF toxicity enhancement was blocked by the aFGF antibody. A similar blockade was shown for release of TNFα (C) and IL-6 (D) from microglia, and IL-6 (E) from astrocytes following stimulation of the cells for 48 h. Values are mean ± S.E., n = 4. Significance by one-way ANOVA. Notice that in each case, treatment with the anti-aFGF antibody eliminated the effect of treatment with aFGF alone. *, p < 0.01 for stimulated cells (ST group) compared with unstimulated cells (CON group); **, p < 0.01 for the ST + aFGF group compared with ST group; and ***, p < 0.01 for the ST + aFGF + Ab group compared with ST + aFGF group.
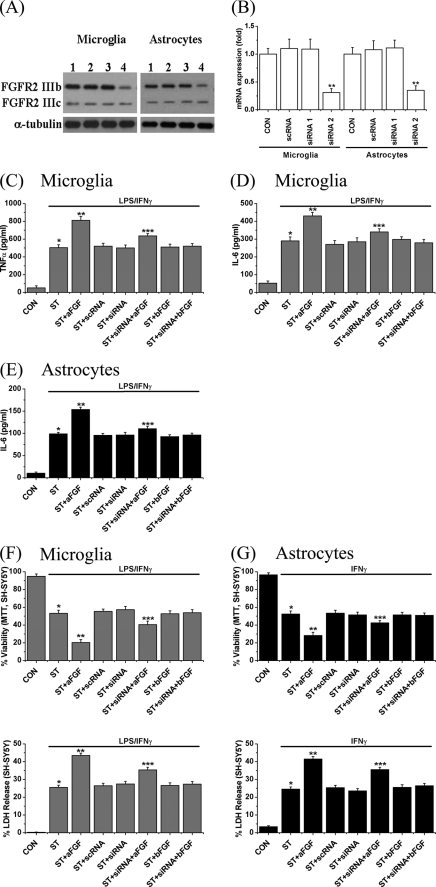
To confirm further that the effects were due to interaction of aFGF with the FGFR2 IIIb receptor, we employed two small inhibitory RNA candidates (siRNA-1 and siRNA-2, Table 2) for FGFR2 IIIb to suppress its protein expression in glial cells. As a known control, we employed a scrambled RNA sequence that does not occur in humans. We transfected astrocytes and microglia with these small RNAs and then measured the effects on FGFR2 IIIb protein expression. Fig. 7, A—G demonstrate the results. Fig. 7, A and B, show Western blots illustrating a 75% decrease in FGFR2 IIIb protein expression (upper band, 110 kDa) 2 days after introduction of FGFR2 IIIb siRNA-2. As anticipated, the FGFR2 IIIc protein expression (lower bands, 100 kDa) was not changed. In addition, there was no effect of scrambled siRNA or FGFR2 IIIb siRNA-1.
FIGURE 7.
A and B, expression of FGFR2 IIIb and FGFR2 IIIc proteins and the effects of candidate siRNA transfection, on cytokine release, and C-E, glial-mediated neurotoxicity toward SH-SY5Y cells (F and G). See “Experimental Procedures” for details. A, lane 1, nontransfected cells; 2, scramble RNA transfected cells; 3, siRNA-1-transfected cells; and 4, siRNA-2-transfected cells. Left side, microglia; right side, astrocytes. Note that FGFR2 IIIb protein expression (upper bands, 110 kDa) is significantly reduced in both microglia and astrocytes by 75%, but FGFR2 IIIc protein expression (lower bands, 100 kDa) was not. B, quantitative results. The values of each band in densitometry were normalized to α-tubulin. Values are mean ± S.E., n = 3. Significance of differences was tested by one-way ANOVA. Notice that only siRNA-2 was effective. **, p < 0.01 for siRNA-2 transfected cells (lane 4) compared with the nontransfected cells (lane 1). C-E, release levels of TNFα (C) and IL-6 (D) from microglia, and IL-6 (E) from astrocytes following treatment with LPS/IFNγ for microglia or IFNγ for astrocytes for 2 days. Notice the reductions in cells transfected with FGFR2 IIIb siRNA-2 but not scrambled siRNA. Values are mean ± S.E., n = 4. Significance was determined by one-way ANOVA. *, p < 0.01 for stimulated cells (ST group) compared with unstimulated cells (CON group); **, p < 0.01 for the ST + aFGF group compared with the ST group; and ***, p < 0.01 for the ST + siRNA (siRNA-2) + aFGF group compared with the ST + aFGF group. F and G, effects of transfection of FGFR2 IIIb siRNA on stimulated glial-mediated SH-SY5Y cell viability changes. MTT results, upper panels, and LDH release data, lower panels. Values are mean ± S.E., n = 4. Significance was determined by one-way ANOVA. *, p < 0.01 for stimulated cells (ST group) compared with unstimulated cells (CON group); **, p < 0.01 for the ST + aFGF group compared with the ST group; and ***, p < 0.01 for the ST + siRNA (siRNA-2) + aFGF group compared with the ST + aFGF group.
Transfection efficiency was measured to confirm the reduction in protein expression. For this experiment, the same amount of EGFP-C2 (1 nm, BD Bioscience, MD) was transfected to microglia and astrocytes and assessment of the percent of green cells was undertaken using fluorescent microscopy. We found that 68.59 ± 3.65% in microglia and 65.31 ± 4.73% in astrocytes were green (n = 6 independent experiments). The data were closely related to the reduction in protein expression.
The siRNA-2 also produced a 50–60% reduction of aFGF enhancement of stimulated microglial release of TNFα (Fig. 7C) and IL-6 (Fig. 7D) as well as aFGF-stimulated astrocytic release of IL-6 (Fig. 7E). The toxicity of stimulated glial-conditioned medium to SY-SY5Y cells was also reduced. Treatment with FGFR2 IIIb siRNA-2 reduced this by 50–70% in the presence of aFGF. As in previous experiments, bFGF was without effect. This is shown in Fig. 7, F for microglia and G for astrocytes. The MTT data (upper panel) were confirmed by LDH release data (lower panel). These results provide further evidence that aFGF acts by stimulating FGFR2 IIIb.
We examined the number of viable microglia and astrocytes during siRNA transfection. The data indicate that during the procedure astrocytes, but not microglia, grow. It was found that the transfection agent, Lipofectamine was not toxic to either cell type and did not affect the cell growth rate. This was also found for the anti-aFGF antibody treatment shown in Fig. 6 (supplemental Table S1).
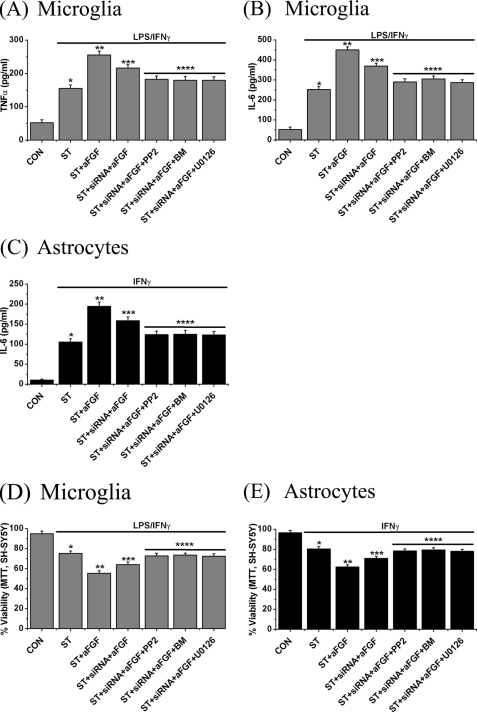
We investigated whether Src tyrosine kinase, PKC, and MEK-1/2 kinase are downstream molecules activated by aFGF-FGFR2 IIIb coupling. For this experiment, FGFR2 IIIb siRNA-transfected microglia and astrocytes were treated with stimulants, aFGF, and the inhibitors of the kinases (PP2 (10 μm), bisindolylmaleimide (1 μm) or U0126 (10 μm)) for 6 h and their supernatants were transferred to SH-SY5Y cells. The levels of TNFα and IL-6 were also measured. The data are shown in Fig. 8. Treatment with the three inhibitors not only reduced microglial and astrocytic neurotoxicity toward SH-SY5Y cells (Fig. 8, D and E), but also decreased release of the cytokines (Fig. 8, A–C).
FIGURE 8.
Effect of treatment with PP2 (an inhibitor of Src tyrosine kinase family, 10 μm), bisindolylmaleimide (BM, a PKC inhibitor, 1 μm), or U0126 (a MEK-1/2 kinase inhibitor, 10 μm) on aFGF-mediated cytokine release and glial neurotoxicity induced by stimulated microglia and astrocytes transfected with FGFR2 IIIb siRNA. A–C, release levels of TNFα (A) and IL-6 (B) from microglia, and IL-6 (C) from astrocytes following treatment with aFGF plus LPS/IFNγ for siRNA-transfected microglia or aFGF plus IFNγ for siRNA-transfected astrocytes for 2 days. D and E, MTT results on SH-SY5Y cell viability changes induced by stimulated microglia (D) and astrocytes (E). Values are mean ± S.E., n = 4. Significance was determined by one-way ANOVA. Notice that each inhibitor significantly reduced the effect of the aFGF-FGFR2 IIIb-mediated signaling pathway. *, p < 0.01 for stimulated cells (ST group) compared with unstimulated cells (CON group); **, p < 0.01 for the ST + aFGF group compared with the ST group; ***, p < 0.01 for the ST + aFGF + siRNA group compared with the ST + aFGF group and p < 0.01 for ST + aFGF + siRNA + PP2, ST + aFGF + siRNA + BM, and ST + aFGF + siRNA + U0126 groups compared with the ST + aFGF + siRNA group.
Finally, we explored for the expression of FGFR2 IIIb and aFGF in postmortem human brain tissue from 3 control and 5 Alzheimer disease cases using the aFGF and FGFR2 IIIb antibodies described previously. All cases showed positive staining with both antibodies.
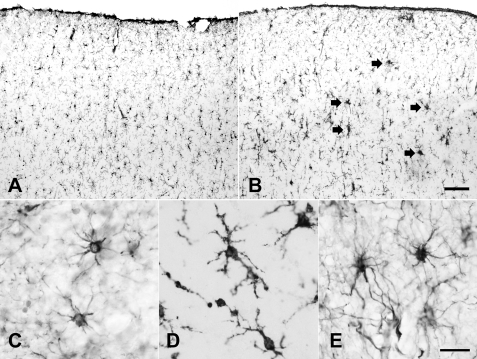
Typical results are shown in Fig. 9. Fig. 9A is a low power photomicrograph of the temporal cortex of a control case demonstrating robust immunostaining of glial cells for FGFR2 IIIb. Fig. 9B shows a comparable low power photomicrograph of the temporal cortex of an Alzheimer disease case. FGFR2 IIIb immunostaining of glial cells is more intense. There is up-regulation (arrows) in the presumed region of amyloid plaques. Fig. 9C is a high power photomicrograph demonstrating FGFR2 IIIb immunostaining of cells with typical morphology of astrocytes, whereas Fig. 9D shows immunostaining of cells with typical morphology of microglia. Fig. 9C shows immunostaining of astrocytes for aFGF. No microglia were positive for aFGF. Double immunofluorescence was utilized to confirm that both astrocytes and microglia are immunostained for FGFR2 IIIb. This is shown in supplemental Fig. S9 where GFAP was used as the definitive marker for astrocytes and IBA-1 was used as the definitive marker for microglia. The merged images confirmed that both cell types expressed FGFR2 IIIb.
FIGURE 9.
Typical photomicrographs of immunostaining of human brain tissue for FGFR2 IIIb (A–D) and aFGF (E). A and B, paraformaldehyde-fixed tissue from the cerebral cortex of a control (A) and an Alzheimer disease case (B) showing low power views of temporal cortex immunostaining for FGFR2 IIIb. Arrows point to areas of glial activation. C, paraformaldehyde-fixed tissue from the cerebral cortex of an Alzheimer disease case showing astrocytic immunostaining for FGFR2 IIIb. Antigen retrieval was utilized. D, another section from the same case showing microglia immunostained for FGFR2 IIIb (no antigen retrieval). E, immunostaining for aFGF of a paraffin-embedded section of the hippocampus of an Alzheimer disease case demonstrating astrocytes positive for aFGF. Calibration bar in B (for A and B), 100 μm, in E (for C-E), 20 μm.
DISCUSSION
In the present study we demonstrated that aFGF enhanced the activity of inflammatory stimulation of astrocytes, microglia, and their surrogate cell lines. The stimulants were IFNγ for astrocytes and U373 cells and IFNγ plus LPS for microglia and THP-1 cells. We showed that these cell types robustly expressed the mRNA and protein for FGFR2 IIIb but not other FGF receptors. Activation of this receptor enhanced phosphorylation of p38 MAPK and NFκB proteins. It resulted in an increased release of the proinflammatory cytokines TNFα and IL-6, and other materials toxic to SH-SY5Y cells. The mechanism was confirmed by showing that reducing the expression of FGFR2 IIIb with siRNA-2, or by removal of aFGF with an anti-aFGF antibody, attenuated the effect. We also found that inhibitors of PKC, Src tyrosine kinase, and MEK-1/2 also attenuated the effect, indicating the involvement of these proteins in the intracellular signaling cascade. Finally, we demonstrated the physiological relevance by showing that FGFR2 IIIb is strongly expressed by microglia, and less robustly by astrocytes, in postmortem human brain.
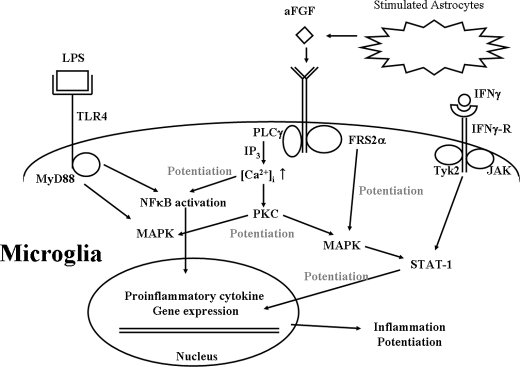
It can be postulated that aFGF-FGFR2 IIIb coupling activates Src kinase, PLCγ1, and FGFR substrate 2α, and then increases the release of Ca2+ from the IP3 receptor-embedded intracellular Ca2+-stores. This could subsequently activate PKC and then potentiate activation of MAP kinase and, NFκB and STAT-1 proteins resulting in an increased expression and release of proinflammatory factors, as well as other materials that are toxic to SH-SY5Y cells, from both microglia and astrocytes. These pathways are shown in Fig. 10.
FIGURE 10.
Putative mechanisms for aFGF potentiation of LPS/IFNγ-mediated neuroinflammation by binding of aFGF to FGFR2 IIIb in microglia. The coupling activates Src kinase, PLCγ1, and FGFR substrate 2α, which increases release of Ca2+ from IP3 receptor-embedded intracellular Ca2+ strores. This could subsequently activate PKC and then potentiate activation of MAP kinase, NFκB, and STAT-1 proteins. This results in an increased expression and release of proinflammatory factors, as well as other materials that are toxic to nearby neurons. Notice that activation results from LPS interacting with TLR4 and IFNγ with the IFNγR.
It has been reported that the FGFR2 IIIb splice variant is exclusive to epithelial cells, whereas FGFR2 IIIc is expressed by mesenchymal cells (19). Our data do not support this distinction because microglia and THP-1 cells, which are of mesodermal origin, strongly express FGFR2 IIIb but not FGFR2 IIIc. The expression is the same as in astrocytes, which are of epithelial origin.
We also found that bFGF did not affect glial-mediated neuroinflammation in our experimental model. However, it did partially inhibit the activity of aFGF indicating that it may be a weak blocker of FGFR2 IIIb. Previous studies indicate that bFGF is a trophic factor for hippocampal (20) and dopaminergic (21) neurons in culture, so it has protective effects on some types of neurons.
Our data indicate an opposite role for aFGF. That is to potentiate microglial and astrocyte-mediated neuroinflammation. Therefore, inhibition of the expression and release of aFGF in activated astrocytes could be a therapeutic avenue in neurodegenerative diseases such as Alzheimer disease, where neuroinflammation is one of the main components of disease progression. The possibilities could be explored, for example, in transgenic mouse models of Alzheimer disease where prominent astrocytic and microglial reactions occur surrounding Aβ deposits. The effect of altering the specific aFGF-FGFR2 IIIb with the inhibitors described above could be tested.
This work was supported by the Pacific Alzheimer Research Foundation.

The on-line version of this article (available at http://www.jbc.org) contains supplemental Figs. S1–S9 and Table S1.
- FGFR
- fibroblast growth factor receptor
- aFGF
- acidic fibroblast growth factor
- bFGF
- basic fibroblast growth factor
- MTT
- 3-(4,5-dimethylthiazol-2-yl)-2,5-diphenyl tetrazolium
- ANOVA
- analysis of variance.
REFERENCES
- 1. Beenken A., Mohammadi M. (2009) Nat. Rev. Drug Discov. 8, 235–253 [DOI] [PMC free article] [PubMed] [Google Scholar]
- 2. Basilico C., Moscatelli D. (1992) Adv. Cancer Res. 59, 115–165 [DOI] [PubMed] [Google Scholar]
- 3. Galzie Z., Kinsella A. R., Smith J. A. (1997) Biochem. Cell Biol. 75, 669–685 [PubMed] [Google Scholar]
- 4. Reuss B., von Bohlen und Halbach O. (2003) Cell Tissue Res. 313, 139–157 [DOI] [PubMed] [Google Scholar]
- 5. Johnson D. E., Lu J., Chen H., Werner S., Williams L. T. (1991) Mol. Cell. Biol. 11, 4627–4634 [DOI] [PMC free article] [PubMed] [Google Scholar]
- 6. Dailey L., Ambrosetti D., Mansukhani A., Basilico C. (2005) Cytokine Growth Factor Rev. 16, 233–247 [DOI] [PubMed] [Google Scholar]
- 7. Kimura H., Tooyama I., McGeer P. L. (1994) Tohoku J. Exp. Med. 174, 279–293 [DOI] [PubMed] [Google Scholar]
- 8. Lee M., Schwab C., Yu S., McGeer E., McGeer P. L. (2009) Neurobiol. Aging 30, 1523–1534 [DOI] [PubMed] [Google Scholar]
- 9. Singh U. S., Pan J., Kao Y. L., Joshi S., Young K. L., Baker K. M. (2003) J. Biol. Chem. 278, 391–399 [DOI] [PubMed] [Google Scholar]
- 10. Ridyard M. S., Robbins S. M. (2003) J. Biol. Chem. 278, 13803–13809 [DOI] [PubMed] [Google Scholar]
- 11. Lee M., Cho T., Jantaratnotai N., Wang Y. T., McGeer E., McGeer P. L. (2010) FASEB J. 24, 2533–2545 [DOI] [PubMed] [Google Scholar]
- 12. Kim H. J., Jung H. H., Lee S. H. (2006) Acta Oto-Laryngologica 126, 600–605 [DOI] [PubMed] [Google Scholar]
- 13. Zhao X. M., Frist W. H., Yeoh T. K., Miller G. G. (1994) J. Clin. Invest. 94, 992–1003 [DOI] [PMC free article] [PubMed] [Google Scholar]
- 14. Lee M., Schwab C., McGeer P. L. (2011) GLIA 59, 152–165 [DOI] [PubMed] [Google Scholar]
- 15. Klegeris A., McGeer P. L. (2000) J. Leukocyte Biol. 67, 127–133 [DOI] [PubMed] [Google Scholar]
- 16. Hashioka S., Klegeris A., Schwab C., McGeer P. L. (2009) Neurobiol. Aging 30, 1924–1935 [DOI] [PubMed] [Google Scholar]
- 17. Ornitz D. M., Xu J., Colvin J. S., McEwen D. G., MacArthur C. A., Coulier F., Gao G., Goldfarb M. (1996) J. Biol. Chem. 271, 15292–15297 [DOI] [PubMed] [Google Scholar]
- 18. Van Wagoner N. J., Benveniste E. N. (1999) J. Neuroimmunol. 100, 124–139 [DOI] [PubMed] [Google Scholar]
- 19. Warzecha C. C., Sato T. K., Nabet B., Hogenesch J. B., Carstens R. P. (2009) Mol. Cell 33, 591–601 [DOI] [PMC free article] [PubMed] [Google Scholar]
- 20. Mattson M. P., Kumar K. N., Wang H., Cheng B., Michaelis E. K. (1993) J. Neurosci. 13, 4575–4588 [DOI] [PMC free article] [PubMed] [Google Scholar]
- 21. Casper D., Roboz G. J., Blum M. (1994) J. Neurochem. 62, 2166–2177 [DOI] [PubMed] [Google Scholar]


