Abstract
Inhibition of acetyl-CoA carboxylases (ACCs), a crucial enzyme for fatty acid metabolism, has been shown to promote fatty acid oxidation and reduce body fat in animal models. Therefore, ACCs are attractive targets for structure-based inhibitor design, particularly the carboxyltransferase (CT) domain, which is the primary site for inhibitor interaction. We have cloned, expressed, and purified the CT domain of human ACC2 using baculovirus-mediated insect cell expression system. However, attempts to crystallize the human ACC2 CT domain have not been successful in our hands. Hence, we have been using the available crystal structure of yeast CT domain to design human ACC inhibitors. Unfortunately, as the selectivity of the lead series has increased against the full-length human enzyme, the potency against the yeast enzyme has decreased significantly. This loss of potency against the yeast enzyme correlated with a complete lack of binding of the human-specific compounds to crystals of the yeast CT domain. Here, we address this problem by converting nine key active site residues of the yeast CT domain to the corresponding human residues. The resulting humanized yeast ACC-CT (yCT-H9) protein exhibits biochemical and biophysical properties closer to the human CT domain and binding to human specific compounds. We report high resolution crystal structures of yCT-H9 complexed with inhibitors that show a preference for the human CT domain. These structures offer insights that explain the species selectivity of ACC inhibitors and may guide future drug design programs.
Keywords: Acetyl Coenzyme A, Diabetes, Drug Discovery, Obesity, Site-directed Mutagenesis, Structural Biology
Introduction
Acetyl-CoA carboxylase (ACC)3 is a biotin-dependent enzyme that catalyzes the carboxylation of acetyl CoA to produce malonyl CoA through its two catalytic activities, biotin carboxylase and carboxyltransferase (1–3). The prokaryotic ACC is composed of three independent functional proteins: biotin carboxylase (BC), biotin carboxyl carrier protein, and carboxyltransferase (CT) (3). In yeast and mammals, the enzyme is one polypeptide with distinct BC, biotin carboxyl carrier protein, and CT domains (4). The BC domain catalyzes the first step of the reaction, carboxylation of the biotin group that is covalently attached to biotin carboxyl carrier protein, and the CT domain catalyzes the transfer of this activated carboxyl group to the acetyl CoA to form malonyl CoA (5). Two isoforms of mammalian ACC are known, ACC1 and ACC2 (6, 7). ACC1 is a cytosolic enzyme expressed mostly in liver and adipose tissue that catalyzes the first committed step in fatty acid synthesis. ACC2 is associated with the mitochondrial outer membrane, found mostly in cardiac and skeletal muscle, and is involved in regulating fatty acid oxidation via allosteric inhibition of carnitine palmitoyltransferase (8).
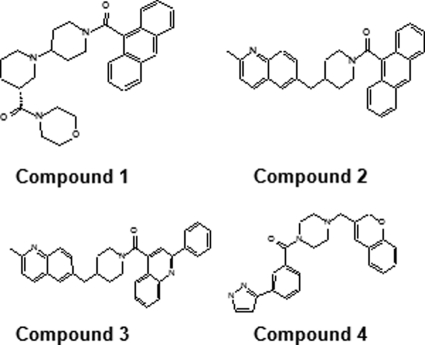
Human ACCs are promising targets for the development of pharmaceutical treatments of obesity and diabetes. Two of every three adults in America are overweight or obese (9). Moreover, obesity can also lead to secondary health conditions such as type 2 diabetes, cardiovascular disease, and atherosclerosis (10). It has been shown that genetically modified mice lacking ACC2 have elevated levels of fatty acid oxidation, reduced body fat, and body weight (5, 11, 12), whereas genetic ablation of the ACC1 gene (ACC1 knock-out mice) is embryonically lethal (13). Because of the dual effects of malonyl CoA on de novo lipogenesis and β oxidation of fatty acids, an ACC inhibitor is likely to reduce fatty acid synthesis in liver and adipose tissue while increasing fatty acid oxidation in liver and muscle tissues resulting in increased energy expenditure, weight loss, and improved insulin sensitivity (14). Recently, a small molecule (Compound 1, see Fig. 1) has been shown to be a potent isozyme-nonselective inhibitor of mammalian ACCs (15). In cell cultures as well as in experimental animal models, compound 1 was shown to reduce tissue malonyl CoA levels, inhibit fatty acid biosynthesis, and stimulate fatty acid oxidation. Therefore, ACCs are attractive targets for antiobesity and antidiabetes drug discovery (15).
FIGURE 1.
Structures of ACC-CT domain inhibitors used in this study.
Recently, the x-ray crystal structures of yeast CT domain and free enzyme as well as its complex with CoA and the inhibitors haloxyfop or diclofop have been reported (16, 17). The structures reveal that the active site of the CT domain is located at the interface of a dimer of the enzyme. The inhibitors are located at the dimer interface and inhibit the enzymatic activity by disrupting the binding or the conformation of the acetyl CoA or malonyl CoA substrate. Efforts to date to achieve structural information on the human ACC1 and ACC2 CT domain have been hampered by unknown reasons although the recombinant protein yields and biochemical properties (i.e. stability, phosphorylation, and homogeneity) are very encouraging. Recently, Madauss et al. (18) reported the low resolution crystal structure of the human ACC2 CT domain. As expected, the human ACC2 CT domain resembles the yeast CT domain in all respects but includes a novel extension of the CT dimer interface via three intertwined helices that were not observed in the yeast structure (16, 17, 19). The C-terminal 39 residues of the human enzyme that form this intertwined helical structure were shown to confer binding activity of known ACC inhibitors to the human CT domain (18). Despite the availability of the authentic human ACC2 CT domain, the resolution of the resulting crystal structures suggests that the higher resolution yeast ACC CT domain structure may yet be a better surrogate for structure-based drug design efforts.
Here, we describe an alternative strategy that involves the mutagenic interconversion of the key active site residues of yeast CT domain with corresponding human residues. Specifically, we engineered a “humanized” yeast CT domain in which nine active site residues of the yeast CT domain (Pro-1760, Ile-1762, Met-1765, Glu-1919, Pro-1920, His-1925, Gln-2028, Met-2030, and Gly-2032) were replaced with the corresponding human ACC2 residues (Ser-1760, Leu-1762, Val-1765, Gln-1919, Ala-1920, Phe-1925, Glu-2028, Thr-2030, and Glu-2032). This humanized yeast CT domain (yCT-H9) exhibits an inhibitor sensitivity profile similar to that of human ACC while maintaining high recombinant expression yields and robust crystallizability. We also exploit these unique features to solve the crystal structure of yCT-H9 in complex with a human ACC2-selective small molecule inhibitor that failed to yield a crystal structure with wild-type yeast CT domain, thus offering key insights to guide future drug design efforts.
EXPERIMENTAL PROCEDURES
Cloning and Expression of Yeast ACC-CT Domain
The CT domain (residues 1476–2233) of yeast (Saccharomyces cerevisiae) ACC was subcloned into the pET24d vector (Novagen) as before (17). This construct, yCT, was transformed into Escherichia coli BL21-CodonPlus™ (DE3)-RIL, and transformants were selected on LB (Luria-Bertani) agar plates containing kanamycin (50 μg/ml). For large scale expression and purification, an Erlenmeyer flask containing 1 liter of LB broth supplemented with 50 μg/ml kanamycin was inoculated with 25 ml of the overnight culture and grown at 37 °C to an A600 of 0.8, at which time isopropyl 1-thio-β-d-galactopyranoside was added (100 μm, final concentration) to induce expression, and the growth temperature was reduced to 20 °C and grown for 18 h. The cells were harvested and stored at −80 °C until further use.
Cloning and Expression of Human ACC2-CT Domain
The CT domain (residues 1665–2458, 794 amino acids) of human ACC2 (GenBankTM accession number U89344) was custom-synthesized at DNA 2.0 (Menlo Park, CA) that contained a BamHI site at the 5′ end and a XhoI site at the C′ end. The resulting product was subcloned into pFastBac baculovirus expression vector (Invitrogen), predigested with same enzymes to generate a C-terminal His-tagged protein. This recombinant construct, hCT, containing the gene for hACC2-CT domain was then transformed into DH10Bac™ E. coli competent cells to form an expression bacmid, which was then used for transfection into Spodoptera frugiperda (Sf-9) insect cells following the manufacturer's (Invitrogen) instructions. In vivo homologous recombination between the recombinant bacmid DNA and the viral DNA transferred the recombinant gene to the viral genome and generated recombinant virus harboring the gene for hACC2-CT domain (hCT). The recombinant viruses were purified by plaque assay and amplified following the manufacturer's (Invitrogen) instructions. Expression of hCT was performed by infecting 1 liter of Sf-21 cells at a cell density of 2 × 10⁶ viable cells/ml and an multiplicity of infection of 0.5 in a serum-free insect cell medium (SF-900 III SFM, Invitrogen). Maximum expression of the recombinant protein was observed 48–72 h after infection, and the cells were harvested when their viability was 80–85%. Harvested cells were stored at −80 °C until further use.
Generation of Humanized Yeast CT Domain
The humanized mutant of yeast CT domain was generated by replacing nine active site residues of yeast CT domain with corresponding human ACC2 CT domain residues (P1760S, I1762L, M1765V, E1919Q, P1920A, H1925F, Q2028E, M2030T, G2032E). This construct, yCT-H9, was custom-synthesized with codon optimization for E. coli expression at DNA 2.0 and cloned into the pET24d vector (Novagen) at NheI and XhoI sites. Construct yCT-H9 was expressed in E. coli following the same protocol as that for the wild-type yeast CT domain.
Protein Purification
Cells were harvested and resuspended in an appropriate volume of lysis buffer (50 mm Tris, (pH 8.0), 150 mm NaCl, 5% glycerol, 2 mm Tris-2-carboxyethyl phosphine, and 0.05% Triton X-100). The cell suspension was incubated for 30 min at 37 °C with gentle shaking and then sonicated with a Branson ultrasonic disintegrator (VWR Scientific Products, Chicago, IL) for 2–4 min at 50% duty cycle. Cell lysate was centrifuged at 15,000 rpm for 50 min at 4 °C, and the supernatant was separated from the pellet. The soluble protein was purified by Ni2+-Sepharose 6 Fast Flow affinity (GE Healthcare) and anion exchange chromatography as described before (16). The protein was concentrated to 8.0 mg/ml in a buffer containing 20 mm Tris (pH 7.5), 100 mm NaCl, 5% (v/v) glycerol, and 1.0 mm Tris-2-carboxyethyl phosphine. The sample was flash-frozen in liquid nitrogen and stored at −80 °C. The His6 tag was not removed for crystallization. Protein concentrations were determined using either the BCA assay system (Pierce) with bovine serum albumin as a standard or using absorbance at 280 nm.
Liquid Chromatography-Mass Spectrometry (LC-MS)
Direct analysis of protein intact mass measurements was conducted by LC-MS using a 0.3 × 100-mm Vydac C4 column (type 214MSS.310) and an Applied Biosystems QSTAR XL mass spectrometer as described elsewhere (20)
Crystallization and Data Collection
Crystals of the yeast CT domain were obtained at 22 °C by the vapor diffusion method as previously described (17). The reservoir solution contained 100 mm sodium citrate (pH 5.5), 12% (w/v) PEG8000, 150 mm LiSO4, and 7.5% (v/v) glycerol. The protein was at 8.0 mg/ml and mixed 1:1 with reservoir solution. Structures with compounds were obtained by soaking apo crystals with 1.0 mm compound overnight in reservoir solution. The crystals were cryo-protected with the introduction of 25% (v/v) ethylene glycol and flash-frozen in liquid propane. The humanized mutant, yCT-H9, crystallizes isomorphously to the wild-type structure. Data were collected at 17ID at the Advanced Photon Source (yCT-H9, compound 1) at beamline X29A at the National Synchrotron Light Source (yCT-H9, compound 2; yCT-H9, compound 3) and at 17BM at the Advanced Photon Source (yCT-H9, compound 4) (Fig. 1). Data were processed using D*Trek (21) or HKL-2000 (22). Structure factor generation, test set assignment, and various other reflection file manipulations were carried out using the programs available in the CCP4 suite of programs (23). All test set reflections were assigned to be identical to those in Research Collaboratory for Structural Bioinformatics (RCSB) entry 1W2X.
Structure Determination and Refinement
Because all of the structures reported here are isomorphous to PDB code 1W2X, the structures were determined by rigid body refinement of the A, B, and C monomers of PDB code 1W2X followed by restrained refinement using the program REFMAC (24) using all available data. Final refinement was performed using the program autobuster (BUSTER, Version 2.8.0, Global Phasing Ltd., Cambridge, UK) interspersed with rounds of manual model building in the graphic program COOT (25). Compounds were fit manually into the initial electron density maps before the application of Non-crystallographic symmetry restraints. Coordinates and structure factors have been deposited with the RCSB (26) with entry codes, 3TV5, 3TZ3, 3TVU, and 3TVW, for the yCT-H9 complexes with compounds 1, 2, 3, and 4, respectively. Data and refinement statistics are reported in Table 1.
TABLE 1.
Crystallographic data and refinement statistics
r.m.s.d., root mean square deviation.
| Compound | 1 | 2 | 3 | 4 |
|---|---|---|---|---|
| Data collection | ||||
| Space group | C2 | C2 | C2 | C2 |
| Unit cell | a = 246.50, b = 123.11, c = 146.44, β = 94.24 | a = 246.85, b = 123.38, c = 145.10, β = 94.41 | a = 246.99, b = 123.18, c = 146.16, β = 94.20 | a = 246.96, b = 122.85, c = 146.07, β = 94.16 |
| Resolution (Å) | 50-2.80 (2.90-2.80) | 50-2.7 (2.80-2.70) | 50-2.40 (2.50-2.40) | 50-2.70 (2.90-2.80) |
| Completeness (%) | 99.4 (97.2) | 92.4 (91.6) | 96.5 (93.8) | 99.9 (99.9) |
| Rsyma | 0.089 (0.386) | 0.132 (0.473) | 0.06 (0.417) | 0.079 (0.357) |
| χ2 | 1.58 (1.00) | 0.99 (0.99) | 0.97 (1.47) | 1.06 (0.68) |
| Redundancy | 3.4 (3.0) | 3.4 (3.2) | 3.6 (3.6) | 3.5 (3.3) |
| I/σ(I) | 10.3 | 4.9 (1.7) | 8.9 (1.9) | 15.7 (2.8) |
| Refinement | ||||
| Rworkb | 0.171 | 0.206 | 0.202 | 0.176 |
| Rfreeb | 0.204 | 0.234 | 0.223 | 0.205 |
| Amino acid Residues (no.) | 2070 | 2062 | 2067 | 2116 |
| Waters (no.) | 965 | 858 | 1042 | 878 |
| r.m.s.d. bond length (Å) | 0.01 | 0.01 | 0.01 | 0.01 |
| r.m.s.d. angles (°) | 1.17 | 1.18 | 1.17 | 1.18 |
| Ramachandran | ||||
| % Favored | 91.1 | 90.8 | 91.7 | 90.8 |
| % Allowed | 8.7 | 9.0 | 8.0 | 8.9 |
| % Outliers | 0.2 | 0.3 | 0.3 | 0.3 |
a Rsym = Σhkl(|Ihkl − 〈Ihkl〉|)/ΣhklIhkl〈Ihkl〉, where Ihkl is the intensity of reflection hkl, and 〈Ihkl〉 is the average intensity of multiple observations.
b Rwork = Σ|Fo − Fc|/ΣFo, where Fo and Fc are the observed and calculated structure factor amplitudes, respectively. Rfree is the R-factor for a randomly selected 5% of reflections that were not used in the refinement.
Carboxyltransferase Assays
ACC-CT domain activity was assessed using a coupled-two phase system (organic/aqueous) measuring selective partition of [14C]acetylchloramphenicol into an organic layer. The conversion of radiolabeled malonyl CoA to acetyl CoA by the ACC-CT domain was coupled with acetylation of chloramphenicol by chloramphenicol acetyltransferase (Sigma C8413). The acetylchloramphenicol product was selectively partitioned into the organic phase scintillation fluid, with the radiolabeled malonyl CoA partitioning into the aqueous phase. The assay was run at room temperature in a final volume of 40 μl (384-well microtiter plate density) in buffer containing 25 mm Hepes (pH 7.4), 0.5 mm DTT. The reaction contained 50 μm chloramphenicol, 0.3 units of chloramphenicol acetyltransferase, and 0.002 μCi of [malonyl-2-14C]malonyl coenzyme A (PerkinElmer Life Sciences NEC612025UC) at a final concentration of 1 μm (predetermined Km value for yeast ACC-CT). The reaction was initiated by the addition of the recombinant proteins in the presence of 1 mm biotin and then allowed to proceed for the indicated time. The assay was then terminated with 3 μl of 1 n HCL followed by 40 μl of MicroScintTM-E/butanol (1:1). Radioactivity of the upper organic phase was determined by top counting using a MicroBeta scintillation counter (PerkinElmer). The kinetic parameters for each protein were obtained by non-linear least-squares fitting to the initial velocity data.
Fluorescence Antisotropy Binding Assay
These experiments were performed using a photon technology international fluorimeter as described previously (17). In brief, increasing concentrations of protein (yCT, yCT-H9, hCT) were titrated into a solution that initially contained 100 mm NaCl, 100 mm Tris·HCl (pH 8.0), and 1 μm compound 1. The excitation wavelength was 350 nm, and the fluorescence emission was monitored between 390 and 430 nm. The observed fluorescence anisotropy of the compound as a function of protein concentration is fitted to a 1:1 binding model to extract the binding constant (Kd). For the competitive binding assay, increasing concentrations of compound 4 were titrated into a solution that contained 100 mm Tris·HCl (pH 8.0), 100 mm NaCl, 0.5 μm compound 1, and 8.0 μm concentrations of corresponding protein.
Fluorescence-based Protein Thermal Stability Assay
The changes in intensity of fluorescence emission from protein-bound SYPRO orange dye as a function of temperature was monitored using iCycler iQ Real-time detection system (Bio-Rad). The system contains a heating/cooling device for accurate temperature control and a charge-coupled device (CCD) detector for simultaneous imaging of the fluorescence changes in the wells of the microplate. Briefly, 20 μl of each protein at 5 μm concentration with or without test compound (50 μm in DMSO) was mixed with 0.5 μl of 200× SYPRO orange solution (Molecular Probes, Eugene, OR), pipetted into separate wells of a 96-well PCR plate, and loaded into PCR machine. The temperature was ramped from 20 to 99 °C in 1 °C increments with a dwell time of 6 s. Excitation and emission wavelengths of SYPRO orange are 490 and 530 nm, respectively. The melting temperature (Tm), the point where the concentration of folded and unfolded protein are equal, was calculated by taking the first derivative of the change in fluorescence versus temperature. The negative first derivative of the fluorescence change (−dRFU/dT, where RFU is relative fluorescence units) for each protein was plotted against temperature, and the melting temperature was defined as the minimum in the −dRFU/dT curve.
RESULTS AND DISCUSSION
When accurate structures of protein-ligand complexes are available, Structure Based Drug Design has proven itself to be a valuable tool for lead discovery and optimization. However, because of difficulties with protein expression, purification, or post-translational modifications, crystallization of some authentic, native targets is quite challenging or impossible. Therefore, it is sometimes necessary to utilize “surrogate” systems that closely resemble the native target. Examples include crystallization of target molecule from closely related species, single domains of multidomain proteins, or point mutants that enhance expression, purification, or crystallizability. We report here the development of an optimized surrogate Structure Based Drug Design system for human ACC2-CT domain.
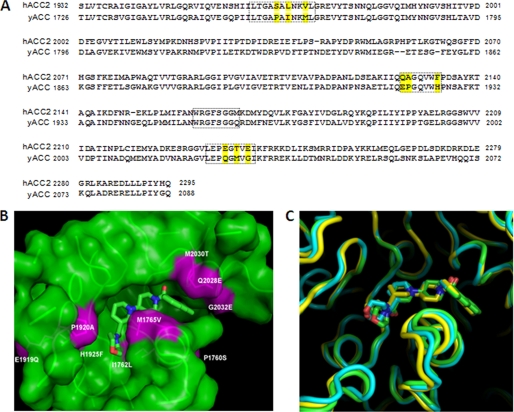
The yeast CT domain (yCT) has proven useful for the initial Structure Based Drug Design efforts against this target. However, as the selectivity of the lead series increased against the primary (human) enzyme, we observed a corresponding significant decrease in potency against the yeast enzyme. This loss of potency against the yeast enzyme eventually resulted in a complete loss of binding of the human specific compounds to the yeast CT domain crystal system. A biologically active recombinant CT domain (residues 1665–2458, 794 amino acids) of human ACC2 protein (hCT) bearing a His6 tag at the C-terminal end was expressed and purified (>10 mg of purified protein/liter of culture) using a baculovirus-insect cell system. Despite sharing 56% sequence identity with yCT (Fig. 2A), hCT has not yielded diffraction-quality crystals under several experimental crystallization conditions. To create an alternative, meaningful crystallization system for human-selective compounds, we sought to develop an optimized surrogate system in which the relevant amino acid residues at the active site of the yeast enzyme were mutated to match the corresponding residues of human enzyme ACC2.
FIGURE 2.
Comparison of yeast (yCT), human (hCT), and humanized (yCT-H9) CT domain active site residues. A, sequence alignment of human ACC2 and yeast ACC-CT domain residues was performed using ClustalW (30). Residues in the boxed area are those within 6 Å of the inhibitor (Compound 1) (17). The yellow-highlighted residues are the ones that differ between human and yeast at the ligand binding interface. B, shown is molecular surface of the binding site for compound 1 in the yeast CT domain. The yeast active site residues that were mutated to mimic the human ACC-CT domain (nine point mutants as reported in “Experimental Procedures”) are colored in magenta. The structure of Compound 1 (PDB code 1W2X) is depicted as green sticks. C, the active site region of yCT structure (green ribbon) was superimposed on the corresponding structures of hCT (yellow ribbon) and yCT-H9 (cyan ribbon). The binding mode of Compound 1 to yCT (green stick), yCT-H9 (cyan stick), and hCT (yellow stick) was superimposed to show the relative positions.
Engineering a Humanized Form of Yeast CT Domain
The active-site residues were identified based on the crystal structure of yeast ACC-CT domain (PDB code 1W2X) (16). The CT domain is a homodimer; each molecule is made up of two sub domains (N and C domains) that are intimately associated with each other. The catalytic site is located at the dimer interface. We used each individual chain as the template to build the corresponding human CT domain homology model in MOE 2007 (Chemical Computing Group, Montreal, Quebec, Canada). The CT domains of human ACC2 and yeast ACC share a sequence identity of 55.9%, and the binding site identity is 79% (Fig. 2A). The coarse homology model from MOE was further optimized in MAESTRO 8 (Schrodinger Inc., New York) and checked with Protein Report without any steric clash and other improbable structure features. Sequence comparison of the 35 residues within 6 Å of compound 1 in the yeast CT domain structure (Fig. 2B) identified only nine of these amino acids that differ between yACC-CT domain (Pro-1760, Ile-1762, Met-1765, Glu-1919, Pro-1920, His-1925, Gln-2028, Met-2030, and Gly-2032) and hACC2-CT domain (Ser-1760, Leu-1762, Val-1765, Gln-1919, Ala-1920, Phe-1925, Glu-2028, Thr-2030, and Glu-2032).
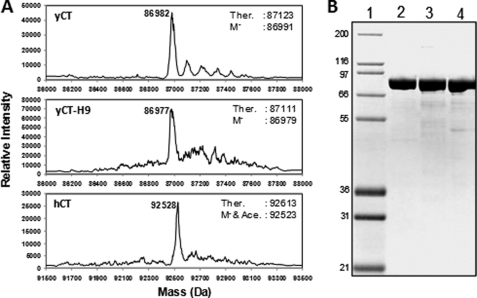
We have mutated each of these nine amino acids in yCT to the corresponding residues in hCT, generating a humanized yeast CT domain (yCT-H9). We have used the E. coli expression system to produce wild-type yCT and the mutant yCT-H9 proteins as described under “Experimental Procedures.” The expected masses of purified proteins were in agreement with the theoretical mass for the demethylated (M−) or M− and singly acetylated proteins based on mass spectrometry (Fig. 3A). The final yields (>20 mg of purified protein per liter of culture) of yCT and yCT-H9 proteins were comparable (Fig. 3B). These recombinant proteins were used to determine the crystal structure in complex with ACC inhibitors 1, 2, 3, and 4 (Fig. 1).
FIGURE 3.
Analysis of recombinant protein reagents. A, shown are mass spectra of HPLC-purified recombinant proteins. Labels at the peak indicate the observed mass of the protein in daltons. Ther. indicates the theoretical mass of the protein in daltons. M− indicates the theoretical mass of the demethylated protein. M− & Ace. indicates the theoretical mass of demethylated and singly acetylated protein. B, Coomassie-stained SDS-10% PAGE analysis of the purified CT-domain proteins. Lane 1, molecular weight protein markers (Marker12, Invitrogen); lane 2, yCT purified; Lane 3, hCT purified; lane 4, yCT-H9 purified. Mass of the protein markers (in kDa) shown on the left. Each lane contained 2 μg of recombinant protein.
Kinetic Analysis of Humanized and Wild-type CT Domain Proteins
The enzymatic activities (specific activities) of these proteins were measured using a coupled-two phase (organic/aqueous) system. The radiolabeled malonyl CoA was converted into acetyl CoA by the CT domain and subsequently acetylated chloramphenicol by chloramphenicol acetyltransferase. The final product, [14C]acetylated chloramphenicol, which selectively partitioned into the organic layer, was measured as an indirect indication of CT domain activity. As shown in Table 2, all the CT domain variants were active, and the specific activities of yCT, hCT, and yCT-H9 were 2.31 ± 0.06, 4.07 ± 0.59, and 1.32 ± 0.10 pmol/min/mg, respectively. By comparison, hCT was slightly more active than yCT or yCT-H9.
TABLE 2.
Activity and kinetic parameters of the variant proteins
| Protein | Specific activitya | Kdb compound 1 | Kdc compound 4 |
|---|---|---|---|
| pmol/min/mg | μm | μm | |
| yCT | 2.31 ± 0.06 | 7.8 ± 2.0 | 50.0 ± 15.0 |
| hCT | 4.07 ± 0.59 | 1.0 ± 0.2 | 28.0 ± 5.0 |
| yCT-H9 | 1.32 ± 0.10 | 4.8 ± 2.0 | 37.0 ± 6.0 |
a Values were determined from carboxyltransferase assays.
b Estimated Kd values were determined from fluorescence antisotropy binding assay using the intrinsic fluorescent property of this compound (Fig. 4A).
c Kd values were estimated using compound 4 as a competitor for the binding of compound 1 (Fig. 4B).
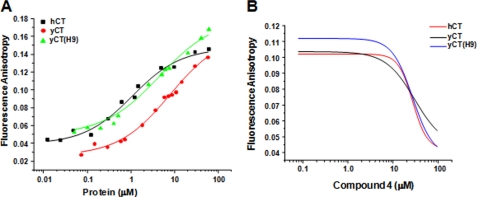
To evaluate the binding affinity of the inhibitors to the isolated CT domain, we carried out kinetic and fluorescence binding studies as described under “Experimental Procedures.” Despite their comparable catalytic activity, yeast and human CT domain proteins displayed substantial differences in their inhibitor sensitivity profile. For instance, compound 1, a known inhibitor of yeast CT domain (15, 17), has a Kd value of 7.8 μm for yCT domain and 1.0 μm for the hCT domain (Table 2, Fig. 4A). Interestingly, the Kd value of humanized yeast domain (4.8 μm) is between the values of yCT and hCT domains (Table 2, Fig. 4A), suggesting that the humanized yeast CT domain (yCT-H9) has gained significant affinity for human specific inhibitors as expected. This pattern of inhibition is also consistent with a relatively less potent inhibitor, compound 4, with Kd values 50, 37, and 28 μm for yCT, yCT-H9, and hCT, respectively (Table 2, Fig. 4B).
FIGURE 4.
The inhibition of the CT domain variants. A, shown is a plot of the fluorescence anisotropy of compound 1 as a function of protein concentration. B, the fluorescence anisotropy of compound 1 as a function of the concentration of compound 4 is shown. The data from one representative of several duplicate runs are shown. The kd values calculated from these curves (A and B) were given in Table 2.
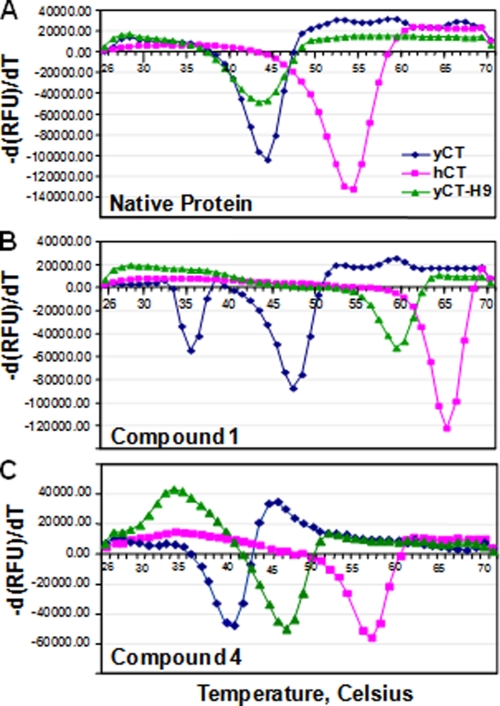
We have also analyzed the thermal stability profile of these CT domain variants using a fluorescence-based (SYPRO) thermal stability assay, which distinguishes folded and unfolded proteins through recognition of exposed hydrophobic areas (27, 28). Consequently, the unfolding process is monitored as a function of temperature, with the Tm value being defined as the midpoint of the folded protein-unfolded protein transition. The yCT and yCT-H9 undergoes a major unfolding stage at 44 and 43 °C, respectively, whereas the observed Tm value for hCT is 54 °C (Table 3, Fig. 5A). These results suggest that in solution the stability of yCT and yCT-H9 is comparable, whereas the hCT domain is significantly more stable than others.
TABLE 3.
Thermal stability of the variant proteins upon treatment with compounds
Tm values were determined from a protein thermal stability assay using SYPRO orange as the reporter dye.
| Sample | yCT |
hCT |
yCT-H9 |
|||
|---|---|---|---|---|---|---|
| Tm | ΔTm | Tm | ΔTm | Tm | ΔTm | |
| ° C | ° C | ° C | ° C | ° C | ° C | |
| Apo | 44 | 54 | 43 | |||
| Apo + compound 1 | 35/47 | −9/3 | 65 | 11 | 59 | 16 |
| Apo + compound 4 | 40 | −4 | 56 | 2 | 47 | 4 |
FIGURE 5.
The thermal unfolding profile of CT domain variants by ligand binding. A, unfolding transition of CT domain variants in the absence of compounds is shown. B, unfolding transition of CT domain variants in the presence of compound 1 is shown. C, unfolding transition of CT domain variants in the presence of compound 4 is shown. RFU, relative fluorescence units.
Thermodynamically, the binding of ligand/small molecule to a protein increases the stability of the native state. This can be observed experimentally as an increase in the Tm. Our data showed that the addition of compound 1, a potent inhibitor for human ACC-CT domain, significantly shifted the thermal transition (ΔTm) of hCT and yCT-H9 (Table 3, Fig. 5B) but only marginally (3-fold) for the yCT, whereas compound 4, a less potent inhibitor, showed a moderate increase in Tm value (Table 3, Fig. 5C) for these proteins. The Tm values were not significantly altered by the addition of these compounds to yCT protein (Table 3). These results suggest that a reciprocal exchange of the core nine active site residues from yeast to human has significantly improved the binding affinity compared with the wild-type yeast CT domain for these compounds. It is possible that residues outside the immediate binding site may also contribute to the specificity of human enzyme for these compounds. Therefore, conversion of the nine yeast active side residues that are in direct contact with compound 1 is not sufficient to yield the same binding affinity (Kd) as human enzyme for yCT-H9.
Crystal Structure of yCT-H9
Unlike the human ACC2-CT domain, the humanized yCT domain (yCT-H9) crystallized readily as wild-type yeast CT. The yCT-H9 domain structures reported here adopt the same fold as reported previously, forming a dimer through a crystallographic (A/A′) or a noncrystallographic (B/C) symmetry operation. The domain is composed of two subdomains (N and C) that share a similar topology despite low sequence similarity (16). The inhibitor binding site, which has been suggested to be equivalent to the binding site for the substrate carboxybiotin, is a hydrophobic cleft surrounded by residues 1919–1925, 2026–2032, and 1954–1959 of one monomer and 1757–1764 of the other monomer. There is excellent agreement between the ligand conformation and active site residues among the three distinct active sites in the asymmetric unit of each crystal structure. The polypeptide chain of each monomer is well resolved, with only short stretches in the region 2050–2060 being disordered in the various structures. This region, which is poorly ordered with very high B values, was not modeled in the previously reported structures (PDB codes 1OD2 and 1W2X). In our structures, however, a clear periodic nature to the observed electron density indicated the presence of two anti-parallel α helices comprising residues 2047–2082.
Crystal Structure of yCT-H9 Complexed with Compound 1
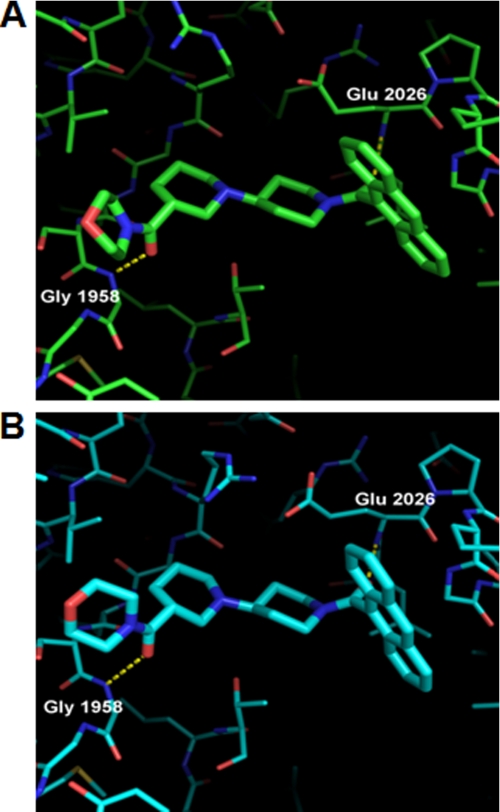
The structure of compound 1 in both yCT (PDB code 1W2X) and yCT-H9 is nearly identical (Fig. 6, A and B). As reported previously (19), the two carbonyl oxygens of compound 1 form hydrogen bonding interactions with backbone nitrogens of residues Glu-2026 and Gly-1958. The anthracene moiety of the compound is positioned in the “canyon” flanked by α helices α6 and α6′ from each of the two CT monomers making up the dimer. The remainder of the compound lies within the putative carboxy-biotin binding site, as suggested previously (19). A structural overlay of the yCT, hCT, (18) and yCT-H9 domains did not show substantial change at the binding site (Fig. 2C). However, a key difference is observed in the conformation of the second piperidine ring and the terminal morpholine ring, with the morpholine carbonyl O atom shifting upwards and out of the active site in both yCT-H9 and 3FFX (0.8 and 1.4 Å, respectively) relative to its position in 1W2X. The deeper positioning of this end of the compound in 1W2X is due primarily to Ile-1762, which is a Leu residue in both yCT-H9 and in PDB code 3FFX. The additional Cδ2 methyl group in the Leu prohibits the compound from binding in the same position in the yeast protein as in the human or yCT-H9 variant. It is noteworthy that the intermediate positioning of the compound in the yCT-H9 variant is consistent with the enhanced affinity on Kd value and thermal stability as compared with yCT. Although such shifts in binding mode might be considered minor, the accuracy required for structure-based drug design highlights this as a major shift, especially as the change in binding mode propagates through the morpholine ring, resulting in a shift in positioning of the terminal morpholine O atom of 2.0 Å.
FIGURE 6.
Crystal structure of yCT and yCT-H9 complexed with compound 1. A, binding mode of compound 1 in yCT (green) crystal structure (RCSB entry code 1W2X) shows interactions of the two amide oxygens with the backbone NH of Glu-2026 and Gly-1958 as dashed lines. B, binding mode of compound 1 in the yCT-H9 (cyan) crystal structure, illustrating nearly identical interactions with the active site is shown. Note the shift in position of the terminal morpholine ring (foreground) by nearly 1 Å relative to its position in 1W2X. The structure of compound 1 (PDB code 1W2X) is depicted as green or cyan sticks.
Crystal Structures of yCT-H9 Complexed with Compounds 2 and 3
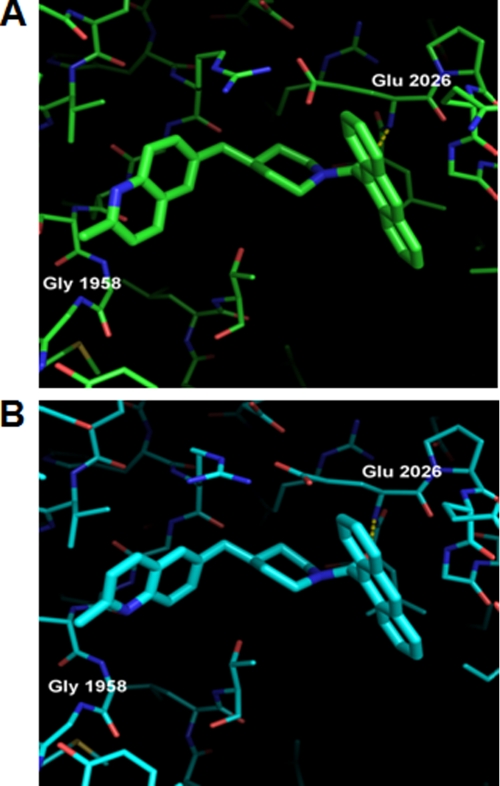
Compound 2, like compound 1, contains an anthracene group but replaces the bipiperidylcarboxamide “head piece” with a methylquinoline moiety (Fig. 1). In a previous publication (29), we reported the crystal structure of compound 2 in complex with yCT (Fig. 7A, PDB code 3H0J). We now report a crystal structure of compound 2 in complex with the yCT-H9 variant (Fig. 7B). The anthracene of compound 2 lies between helices α6 and α6′, forming identical interactions as the anthracene of compound 1. The methylquinoline structure lies in the putative biotin pocket of the CT domain and is flanked by residues Thr-1757, Leu-1762, Val-1765, Leu-1766, Arg-1954, Gly-1955, Phe-1956, Ser-1957, Gly-1958, Gly-1959, Ala-1920, Val-1923, and Phe-1925, similar to the bipiperidylcarboxamide group of compound 1. In the yCT structure the methylquinoline is oriented such that the methyl group and quinoline nitrogen are exposed to solvent, whereas the quinoline C4 carbon occupies almost the same location as the terminal amide oxygen of compound 1 (29). In the yCT-H9 structure (Fig. 6B), however, the methylquinoline moiety undergoes a dramatic rotation of 180 degrees, forcing the methylquinoline head piece out of the binding pocket. As discussed previously, the primary reason for this change in binding mode appears to be the mutation I1762L. The Leu side chain at this position in the yCT-H9 structure adopts a rotamer that places the CD1 methyl group 2.9 Å away from the methylquinoline C3 atom. To relieve the resulting steric clash in these mutants, the methylquinoline rotates by 180°.
FIGURE 7.
Crystal structure of yCT and yCT-H9 complexed with compound 2. A, Compound 2 bound to yCT (green) crystal structure (RCSB entry code 3H0J) showing interactions of the two amide oxygens with the backbone NH of Glu-2026 and Gly-1958 as dashed lines. B, binding mode of compound 2 to yCT-H9 (cyan) crystal structure is shown. Note the altered orientation of the methylquinoline moiety, which has shifted by ∼180° relative to that seen in 3H0J. The structure of Compound 2 is depicted as green or cyan sticks.
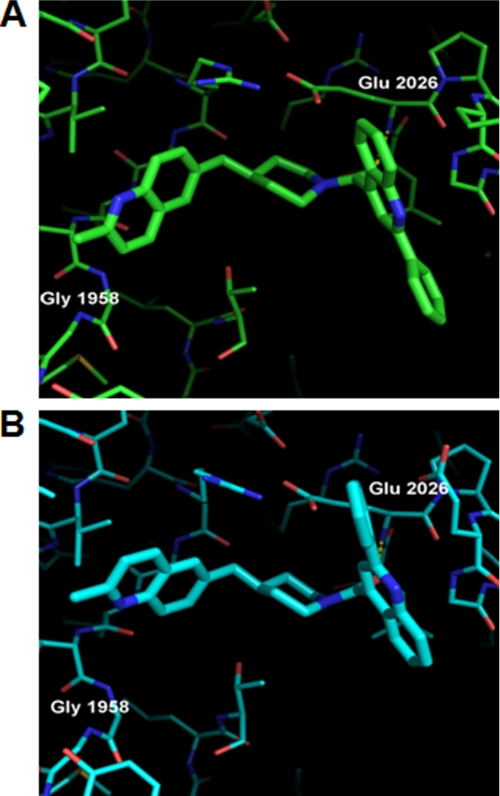
Compound 3 resembles compound 2 in that it too contains a methylquinoline head piece. However, instead of an anthracene moiety, compound 3 contains a 2-benzylquinoline tail piece that makes similar interactions with Ala-1761, Lys-1764, Val-1765, Glu-2028, and Gly-2029. The amide O atom, like that in both compounds 1 and 2, forms a key H-bond with the backbone NH of residue Glu-2026. Strikingly, the 2-benzylquinoline moiety adopts an alternate orientation compared with that seen in the yCT structure (Fig. 8A, RCSB entry code 3H0Q) (29). Although it is tempting to speculate on the functional significance of this change, this region of the binding pocket often accommodates alternate binding conformations, often within the same crystal (data not shown), and we feel that it would be premature to assign any biological relevance to this change. As seen in compound 2, the methylquinoline head piece undergoes a 180° rotation to relieve a steric clash between the methylquinoline 3 position and the CD1 methyl group of Leu-1762 in the yCT-H9 mutant (Fig. 8B).
FIGURE 8.
Crystal structure of yCT and yCT-H9 complexed with compound 3. A, compound 3 bound to yCT (green) crystal structure (RCSB entry code 3H0Q). Interactions of the two amide oxygens with the backbone NH of Glu-2026 and Gly-1958 are shown as dashed lines. B, compound 3 bound to yCT-H9 (cyan) crystal structure. As in the case of compound 2, the methylquinoline is rotated by ∼180° between the yCT and yCT-H9 structures. The structure of compound 3 is depicted as green or cyan sticks.
Crystal Structure of yCT-H9 Complexed with Compound 4
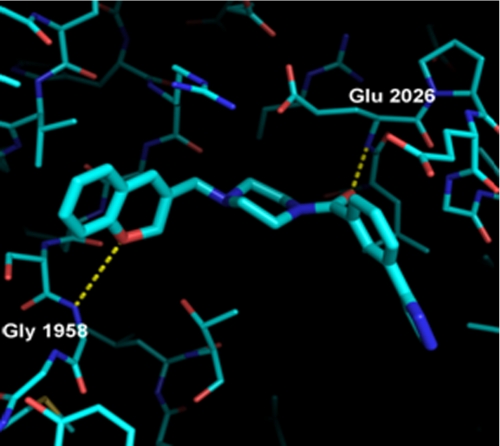
Before the availability of the yCT-H9 variant, we had unsuccessfully attempted to determine the structure of compound 4 in complex with yCT or hCT. As shown in Table 2, the affinity of compound 4 for the isolated yCT protein is on the order of 50 μm, which presumably must be too weak for productive binding to occur under the soaking conditions utilized. However, the modest improvement in potency afforded by yCT-H9 mutant protein (1.4 fold) allowed us to finally determine a co-crystal structure of this compound (Fig. 9). As shown in Fig. 9, compound 4 differs from compound 1 in several respects, including a chromane head group in place of the piperidinyl-morpholine, a piperazine replacement for the second piperidine, and a meta-pyrazolo phenyl “tail piece” as a replacement for the anthracene tail of compound 1. We speculate that the reduced potency of this compound may stem from the unsatisfactory H-bonding distance between the chromane O atom and the backbone NH of Gly-1958. As detailed previously (29), when this chromane is replaced with a spirochromanone, the chromane group undergoes a 180 degree rotation, placing the ketone O atom within ideal H-bonding distance of Gly-1958 NH, accompanied by a dramatic increase in potency. Modeling of this compound into the yCT structure does not indicate any steric clashes that are relieved upon mutation to the yCT-H9 sequence. Therefore, we are unable at this time to explain why this compound shows modestly improved binding to the yCT-H9 construct, as shown by its Kd value, which is intermediate between the yCT and hCT values (Table 2).
FIGURE 9.
Crystal structure of yCT-H9 complexed with compound 4. Compound 4 bound to yCT-H9 (cyan) crystal structure. The structure of Compound 4 is depicted as cyan sticks. Despite multiple attempts, no binding of this compound was ever observed in crystals of yCT.
Conclusion
Because of its central role in lipid metabolism, ACC is an attractive target for diabetes. The crystal structure of the yeast ACC CT domain has proven invaluable as a surrogate system for structure-based drug design efforts but remains by definition an imperfect model of the human CT structure because of sequence differences between the yeast and human ACC proteins. To more closely model the human CT domain, we have engineered a humanized variant of the yeast ACC CT domain and demonstrated that it possesses intermediate activity and binding properties relative to the yeast and human CT domains. Furthermore, we have crystallized this humanized yCT domain in complex with various inhibitors. The differences between the crystal structures of these inhibitors in the yCT and yCT-H9 proteins range from relatively modest shifts in position, as in compound 1, to more dramatic changes in binding pose, as seen in the case of compounds 2 and 3. Intriguingly, we were successful in determining the crystal structure of a new inhibitor series, compound 4, only with the yCT-H9 protein. Each of these crystal structures has shed light on important interactions for further structure-based drug design that were not evident in the original yCT structure. Furthermore, although a crystal structure of the hCT protein has recently been disclosed, the superior resolution of the yCT-H9 system makes this a crystal system of choice for further Structure Based Drug Design efforts.
The atomic coordinates and structure factors (codes 3TV5, 3TZ3, 3TVU, and 3TVW) have been deposited in the Protein Data Bank, Research Collaboratory for Structural Bioinformatics, Rutgers University, New Brunswick, NJ (http://www.rcsb.org/).
- ACC
- acetyl-CoA carboxylase
- BC
- biotin carboxylase
- CT
- carboxyltransferase
- hCT
- hACC2-CT
- yCT
- yeast CT
- RCSB
- Research Collaboratory for Structural Bioinformatics.
REFERENCES
- 1. Wakil S. J., Stoops J. K., Joshi V. C. (1983) Annu. Rev. Biochem. 52, 537–579 [DOI] [PubMed] [Google Scholar]
- 2. Kim K. H. (1997) Annu. Rev. Nutr. 17, 77–99 [DOI] [PubMed] [Google Scholar]
- 3. Cronan J. E., Jr., Waldrop G. L. (2002) Prog. Lipid. Res. 41, 407–435 [DOI] [PubMed] [Google Scholar]
- 4. Tanabe T., Wada K., Okazaki T., Numa S. (1975) Eur. J. Biochem. 57, 15–24 [DOI] [PubMed] [Google Scholar]
- 5. Abu-Elheiga L., Matzuk M. M., Abo-Hashema K. A., Wakil S. J. (2001) Science 291, 2613–2616 [DOI] [PubMed] [Google Scholar]
- 6. Abu-Elheiga L., Almarza-Ortega D. B., Baldini A., Wakil S. J. (1997) J. Biol. Chem. 272, 10669–10677 [DOI] [PubMed] [Google Scholar]
- 7. Abu-Elheiga L., Jayakumar A., Baldini A., Chirala S. S., Wakil S. J. (1995) Proc. Natl. Acad. Sci. U.S.A. 92, 4011–4015 [DOI] [PMC free article] [PubMed] [Google Scholar]
- 8. Tong L. (2005) Cell. Mol. Life Sci. 62, 1784–1803 [DOI] [PMC free article] [PubMed] [Google Scholar]
- 9. Hill J. O., Wyatt H. R., Reed G. W., Peters J. C. (2003) Science 299, 853–855 [DOI] [PubMed] [Google Scholar]
- 10. Friedman J. M. (2003) Science 299, 856–858 [DOI] [PubMed] [Google Scholar]
- 11. Abu-Elheiga L., Oh W., Kordari P., Wakil S. J. (2003) Proc. Natl. Acad. Sci. U.S.A. 100, 10207–10212 [DOI] [PMC free article] [PubMed] [Google Scholar]
- 12. Lenhard J. M., Gottschalk W. K. (2002) Adv. Drug. Deliv. Rev. 54, 1199–1212 [DOI] [PubMed] [Google Scholar]
- 13. Abu-Elheiga L., Matzuk M. M., Kordari P., Oh W., Shaikenov T., Gu Z., Wakil S. J. (2005) Proc. Natl. Acad. Sci. U.S.A. 102, 12011–12016 [DOI] [PMC free article] [PubMed] [Google Scholar]
- 14. Harwood H. J., Jr. (2005) Expert Opin. Ther. Targets 9, 267–281 [DOI] [PubMed] [Google Scholar]
- 15. Harwood H. J., Jr., Petras S. F., Shelly L. D., Zaccaro L. M., Perry D. A., Makowski M. R., Hargrove D. M., Martin K. A., Tracey W. R., Chapman J. G., Magee W. P., Dalvie D. K., Soliman V. F., Martin W. H., Mularski C. J., Eisenbeis S. A. (2003) J. Biol. Chem. 278, 37099–37111 [DOI] [PubMed] [Google Scholar]
- 16. Zhang H., Yang Z., Shen Y., Tong L. (2003) Science 299, 2064–2067 [DOI] [PubMed] [Google Scholar]
- 17. Zhang H., Tweel B., Li J., Tong L. (2004) Structure 12, 1683–1691 [DOI] [PubMed] [Google Scholar]
- 18. Madauss K. P., Burkhart W. A., Consler T. G., Cowan D. J., Gottschalk W. K., Miller A. B., Short S. A., Tran T. B., Williams S. P. (2009) Acta Crystallogr. D Biol. Crystallogr. 65, 449–461 [DOI] [PMC free article] [PubMed] [Google Scholar]
- 19. Zhang H., Tweel B., Tong L. (2004) Proc. Natl. Acad. Sci. U.S.A. 101, 5910–5915 [DOI] [PMC free article] [PubMed] [Google Scholar]
- 20. Rajamohan F., Harris M. S., Frisbie R. K., Hoth L. R., Geoghegan K. F., Valentine J. J., Reyes A. R., Landro J. A., Qiu X., Kurumbail R. G. (2010) Protein Expr. Purif. 73, 189–197 [DOI] [PubMed] [Google Scholar]
- 21. Pflugrath J. W. (1999) Acta Crystallogr. D Biol. Crystallogr 55, 1718–1725 [DOI] [PubMed] [Google Scholar]
- 22. Otwinowski Z., Minor W. (1997) Methods Enzymology, Macromolecular Crystallography, Part A, Vol. 276, pp. 307–326, Academic Press, Inc., New York: [DOI] [PubMed] [Google Scholar]
- 23. Collaborative Computational Project Number 4 (1994) Acta Crystallogr. D Biol. Crystallogr. 50, 760–763 15299374 [Google Scholar]
- 24. Murshudov G. N., Vagin A. A., Dodson E. J. (1997) Acta Crystallogr. D Biol. Crystallogr. 53, 240–255 [DOI] [PubMed] [Google Scholar]
- 25. Emsley P., Lohkamp B., Scott W. G., Cowtan K. (2010) Acta Crystallogr. D Biol. Crystallogr 66, 486–501 [DOI] [PMC free article] [PubMed] [Google Scholar]
- 26. Berman H. M., Westbrook J., Feng Z., Gilliland G., Bhat T. N., Weissig H., Shindyalov I. N., Bourne P. E. (2000) Nucleic Acids Res. 28, 235–242 [DOI] [PMC free article] [PubMed] [Google Scholar]
- 27. Ericsson U. B., Hallberg B. M., Detitta G. T., Dekker N., Nordlund P. (2006) Anal. Biochem. 357, 289–298 [DOI] [PubMed] [Google Scholar]
- 28. Pantoliano M. W., Petrella E. C., Kwasnoski J. D., Lobanov V. S., Myslik J., Graf E., Carver T., Asel E., Springer B. A., Lane P., Salemme F. R. (2001) J. Biomol. Screen 6, 429–440 [DOI] [PubMed] [Google Scholar]
- 29. Corbett J. W., Freeman-Cook K. D., Elliott R., Vajdos F., Rajamohan F., Kohls D., Marr E., Zhang H., Tong L., Tu M., Murdande S., Doran S. D., Houser J. A., Song W., Jones C. J., Coffey S. B., Buzon L., Minich M. L., Dirico K. J., Tapley S., McPherson R. K., Sugarman E., Harwood H. J., Jr., Esler W. (2010) Bioorg. Med. Chem. Lett. 20, 2383–2388 [DOI] [PubMed] [Google Scholar]
- 30. Thompson J. D., Higgins D. G., Gibson T. J. (1994) Nucleic Acids Res. 22, 4673–4680 [DOI] [PMC free article] [PubMed] [Google Scholar]


