Background: The adaptive unfolded protein response (UPR) promotes endoplasmic reticulum (ER) expansion and reduces ER load.
Results: UPR-activated XBP1 induces miR-346 expression that targets TAP1.
Conclusion: We identify a novel function for XBP1 and an miRNA-mediated pathway for ER load reduction through TAP1.
Significance: Novel interventions for protein folding disorders will require an understanding of how microRNAs regulate gene expression during ER stress.
Keywords: ABC Transporter, Endoplasmic Reticulum Stress, Major Histocompatibility Complex (MHC), MicroRNA, Unfolded Protein Response, TAP1, XBP1
Abstract
To identify endoplasmic reticulum (ER) stress-induced microRNAs (miRNA) that govern ER protein influx during the adaptive phase of unfolded protein response, we performed miRNA microarray profiling and analysis in human airway epithelial cells following ER stress induction using proteasome inhibition or tunicamycin treatment. We identified miR-346 as the most significantly induced miRNA by both classic stressors. miR-346 is encoded within an intron of the glutamate receptor ionotropic delta-1 gene (GRID1), but its ER stress-associated expression is independent of GRID1. We demonstrated that the spliced X-box-binding protein-1 (sXBP1) is necessary and sufficient for ER stress-associated miR-346 induction, revealing a novel role for this unfolded protein response-activated transcription factor. In mRNA profiling arrays, we identified 21 mRNAs that were reduced by both ER stress and miR-346. The target genes of miR-346 regulate immune responses and include the major histocompatibility complex (MHC) class I gene products, interferon-induced genes, and the ER antigen peptide transporter 1 (TAP1). Although most of the repressed mRNAs appear to be indirect targets because they lack specific seeding sites for miR-346, we demonstrate that the human TAP1 mRNA is a direct target of miR-346. The human TAP1 mRNA 3′-UTR contains a 6-mer canonical seeding site for miR-346. Importantly, the ER stress-associated reduction in human TAP1 mRNA and protein levels could be reversed with an miR-346 antagomir. Because TAP function is necessary for proper MHC class I-associated antigen presentation, our results provide a novel mechanistic explanation for reduced MHC class I-associated antigen presentation that was observed during ER stress.
Introduction
The ER3 is the central organelle for the synthesis, folding, and post-translational modification of secretory and membrane proteins. Increased synthesis of secretory pathway proteins and cellular insults that disturb ER homeostasis activate the UPR (1, 2). The UPR is primarily a cellular adaptive mechanism that alleviates ER stress by increasing the protein folding capacity and simultaneously reducing the influx of nascent polypeptides into the ER. When stress persists or the recovery mechanisms are ineffective, apoptotic cascades are activated (3–5). UPR-associated cell death contributes to the pathomechanism of a number of human diseases including diabetes mellitus (5, 6) and neurodegenerative disorders (7, 8). Therefore, delineation of the pathways that govern the adaptive UPR may facilitate development of novel therapies for such diseases.
The mammalian UPR is initiated by three ER transmembrane sensors, inositol-requiring enzyme 1 (IRE1), activating transcription factor 6 (ATF6,) and protein kinase RNA-like ER kinase (PERK) (3). To increase the protein folding capacity of the ER, the transcription factors, IRE1-spliced XBP1 (sXBP1) and ATF6, enhance the expression of ER-resident chaperones and foldases and promote ER expansion (9, 10). To reduce ER protein load during ER stress, the UPR acts at multiple levels. For example, the UPR reduces expression of the cystic fibrosis transmembrane conductance regulator (CFTR) via transcriptional, translational, and post-translational mechanisms (11, 12). Protein synthesis during the UPR is inhibited through protein kinase RNA-like ER kinase-induced phosphorylation of eIF2α, a modification that leads to a loss of translation initiation complexes (13, 14). Additional pathways that reduce ER protein load include IRE1-mediated mRNA cleavage and degradation (15, 16) and ER-associated degradation of proteins that fail to fold properly (1, 17).
Because it is clear that the UPR utilizes multiple mechanisms to resolve ER stress, we reasoned that UPR-induced miRNAs may contribute to ER protein and peptide load reduction by decreasing the stability of certain mRNAs (18). miRNAs are small, ∼22-nucleotide, endogenous RNAs that govern mRNA stability by recruiting the RNA-induced silencing complex to the specific sequences at the 3′-UTR of target mRNAs, resulting in mRNA degradation (18, 19). Because the information is limited regarding ER stress-induced miRNAs and their biological significance, the studies presented herein were designed to select ER stress-induced miRNAs, identify their UPR-associated activators, and characterize their targets.
MATERIALS AND METHODS
Cell Lines and Culture Conditions
Calu-3 and HeLa cells were obtained from the ATCC. Cells were cultured in DMEM (Invitrogen) with 10% FBS at 37 °C in a humidified incubator at 5% CO2. Glioblastoma multiforme cells and human primary astrocytes were maintained in Dulbecco's modified Eagle's medium plus F12 medium (Invitrogen) supplemented with 10% FBS (HyClone). Cells were split into 6-well plates and allowed to grow until 70–80% confluency prior to experiments. Xbp1+/+ and Xbp1−/− mouse embryonic fibroblasts were provided by Dr. Randal Kaufman, University of Michigan, and were cultured as described previously (9).
Isolation of Cellular RNA
Total cellular RNA was isolated using RNeasy (Qiagen). RNA concentration was calculated based on the absorbance at 260 nm. RNA samples were stored at −20 °C.
Isolation of Cellular microRNA
Total cellular RNA + microRNA was isolated using the RNeasy mini kit (Qiagen). RNA samples were stored at −20 °C.
Microarray U133 Plus 2.0 Processing and Hybridization
The Affymetrix human genome array (HG-U133 Plus 2.0) was used to analyze the mRNA expression pattern of the human airway epithelial cell line Calu-3 (11). Details about the microarray are available in the supplemental Materials and Methods.
Microarray miRNA Processing and Hybridization
The Affymetrix miRNA array was used to analyze the expression pattern of Calu-3 cells. Details about the microarray are available in the supplemental Materials and Methods.
Measurement of mRNA Levels Using Quantitative Real Time PCR (qRT-PCR)
We used TaqMan® one-step RT-PCR master mix reagents (Applied Biosystems) as described previously (11, 12, 20) using the manufacturer's protocol (57). Details about the microarray are available in the supplemental Materials and Methods.
Measurement of Relative MicroRNA Levels Using Real Time PCR
Real time RT-PCR was performed according to the TaqMan® microRNA and small RNA assays protocol using the TaqMan® microRNA reverse transcription kit (Applied Biosystems). Details about the microarray are available in the supplemental Materials and Methods.
Transfection with miR-346 Mimic and Antagomir
To test the impact of hsa-miR-346 on gene expression, we used the miR-346 mimic and miR-346 inhibitor/antagomir (Qiagen). As a control, we used cel-miR-67 (C67, Qiagen), which has no homology to any known mammalian microRNA. HeLa cells grown on 6-well plates were transfected with Lipofectamine 2000 (Invitrogen) according to the manufacturer's protocol.
Antibodies and Fluorescent Probes
ER-TrackerTM Red (glibenclamide BODIPY® TR), anti mouse IgG Alexa Fluor-488, and anti-rabbit IgG AlexaFluor-596 (Molecular Probes) were used according to the manufacturer's protocols. Anti-XBP1 N-terminal polyclonal (rabbit) antibody (Millipore) recognizing both spliced and unspliced XBP1 was used at 1:200 dilution. Anti-TAP1 monoclonal (mouse) antibody (Proteintech Group), anti-KDEL polyclonal (rabbit) antibody (Sigma), and anti-actin polyclonal (rabbit) antibody (Sigma) were used at 1:1000 dilutions.
Immunocytochemistry
Cells were grown on glass coverslips, washed three times in PBS, and fixed in 4% paraformaldehyde/PBS for 10 min. All incubations were at room temperature unless stated otherwise. Cells were permeabilized with 0.1% Triton X-100/PBS for 5 min, washed three times for 2 min each with PBS, and then blocked with 2.5% goat serum/PBS. Cells were incubated with primary antibody diluted in blocking solution for 2 h. Coverslips were washed five times for 5 min each with PBS. Secondary antibodies were diluted in blocking solution (1:500), and coverslips were incubated for 45 min followed by washing steps and mounted with VECTASHIELD/DAPI (Vector Laboratories). Microscopy was performed using a Leitz epifluorescence microscope equipped with a step motor and a filter wheel assembly (Ludl Electronic Products) and an 83,000-filter set (Chroma Technology). Images were obtained with a SenSys cooled, charge-coupled high-resolution camera (Photometrics). IPLab Spectrum software (Signal Analytics) was used for image acquisition.
Western Blots
Cells were lysed in radioimmune precipitation buffer (150 mm NaCl, 1% Nonidet P-40, 0.5% sodium deoxycholate, 0.1% SDS, 50 mm Tris-HCl, pH 8.0), supplemented with Complete Mini protease inhibitor (Roche Applied Science) on ice for 15 min. The cell lysates were rotated at 4 °C for 30 min, and the insoluble material was removed by centrifugation at 14,000 rpm for 15 min. Protein concentrations were determined by BCATM protein assay (Pierce) using bovine serum albumin (BSA) as a standard. Following normalization of protein concentrations, lysates were mixed with equal volumes of 2× Laemmli sample buffer and incubated for 30–45 min at 37 °C prior to separation by SDS-PAGE. Following SDS-PAGE, the proteins from the gel were transferred to polyvinylidene difluoride membranes (300 mA for 90 min at 4 °C). The membranes were then blocked with milk proteins dissolved in PBS/Tween-20 (5% milk, 0.5% Tween 20 for 1–2 h) followed by immunoblotting with the primary antibody specified for each experiment. After the washing steps, the membranes were incubated with HRP-conjugated secondary antibodies (Pierce) and detected using ECL (Pierce). Densitometry was performed using ImageJ (National Institutes of Health).
Induction of ER Stress and Activation of the UPR
Pharmacological induction of ER stress and activation of the UPR was performed according to previously described methods (11, 12). Briefly, cells were treated with the compounds for the time periods specified: proteasome inhibition with ALLN (calpain inhibitor I; 100 μm); brefeldin A (0.4 μg/ml, Sigma); 300 nm thapsigargin (Sigma); tunicamycin (5 μg/ml, Sigma); or 4 mm DTT (Sigma) for the time periods specified in each experiment. For the time course experiment, tunicamycin (TM) was added to samples for the time periods specified at 5 μg/ml final concentration (21).
Statistical Analysis
Results were expressed as means ± S.D. Statistical significance among means was determined using the Student's t test (two samples, paired and unpaired).
RESULTS
Selection of UPR-induced miRNAs
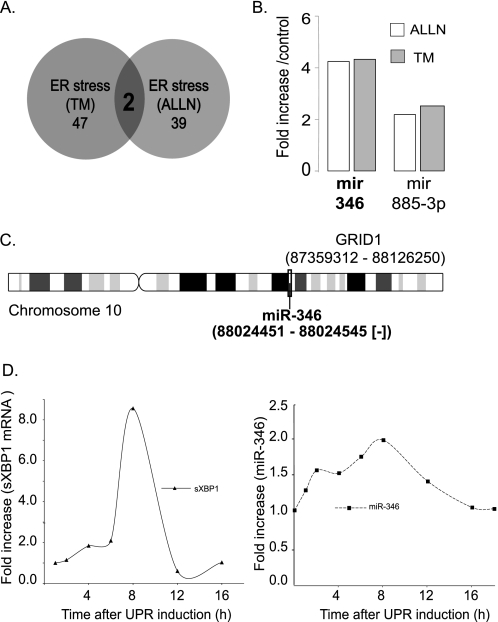
To identify ER stress-induced miRNAs, we utilized human airway epithelial cells, Calu-3, as our primary model. We used two classic compounds, a proteasome inhibitor, ALLN (calpain inhibitor I), and a glycosylation inhibitor, tunicamycin, to induce ER stress (11, 20, 22). Isolated RNA samples were first subjected to qRT-PCR to measure the levels of UPR reporters (BiP and spliced XBP1 (sXBP1) mRNA) (12) to confirm UPR activation. BiP mRNA levels were increased >14-fold and sXBP1 mRNA levels were increased >3-fold, confirming that the UPR was activated. Next, the samples were subjected to genome-wide miRNA expression arrays followed by bioinformatics analysis. We only selected miRNAs that were increased more than 2-fold by both ER stressors (Fig. 1A). Two miRNAs, miR-346 and miR-885-3p, fit the selection criteria. Based on the most significant increase, we selected miR-346 for further analysis.
FIGURE 1.
miR-346 levels increase during ER stress. A, results of the miRNA profiling arrays. Calu-3 cells were treated with two different ER stressors, TM (5 μg/ml) and proteasome inhibition (ALLN, 100 μg/ml), for 12 h prior to isolation of RNA + miRNA and Affymetrix miRNA array hybridization. The Venn diagram illustrates that the number of miRNAs enhanced was 47 and 39 by TM and ALLN, respectively. Two miRNAs were induced by both mechanisms. B, relative increase in miR-346 and miR-885-3p levels. Two miRNAs, miR-346 and miR-885-3p, were enhanced by both ER stressors. miR-346 was selected for further studies based on the ∼4-fold increase by both ER stressors. C, chromosomal location of the miR-346 gene. The miR-346 gene is localized to human chromosome 10, in intron 2 of the GRID1 gene. The locations of GRID1 and miR-346 are indicated on the model of chromosome 10. D, time course studies on the elevation of sXBP1 mRNA and miR-346 levels following ER stress induction. Calu-3 cells were treated with TM (5 μg/ml) for the time periods indicated, and RNA + miRNA were isolated at the time points specified followed by qRT-PCR quantification of sXBP1 mRNA as reporter of UPR activation (left). miR-346 levels were measured at the time points indicated (right). Results are plotted as -fold increase in sXBP1 mRNA or miR-346 over control, prior to the addition of TM (n = 4).
Mir-346 Expression Is Induced during ER Stress in Multiple Cell Types
mir-346 is encoded within the intron 2 of GRID1, also considered a schizophrenia susceptibility gene, on chromosome 10. miR-346 levels are lower in schizophrenic patients, but there is no strong correlation between GRID1 and miR-346 expression, suggesting that miR-346 expression is regulated independently from its host gene (23). Subsequent studies demonstrated miR-346 expression in lymphatic (24) and adipose tissues (25). Our analysis of GRID1 mRNA levels in the genome-wide mRNA expression arrays and by qRT-PCR indicated that GRID1 mRNA levels did not change during ER stress in Calu-3 or HeLa cells, whereas miR-346 levels were increased under the same conditions (Fig. 1B). Therefore, these results support the view that GRID1 and miR-346 expression are independently regulated. The chromosomal locations of mir-346 and GRID1 are shown in Fig. 1C (based on the GRID1 entry in the GeneCards database).
To confirm the predicted increase in miR-346 levels during ER stress and to determine the time period for the induction of miR-346, we performed time course qRT-PCR experiments following ER stress induction with TM. In these experiments, we monitored sXBP1 mRNA as a reporter of UPR activation (12) and measured miR-346 levels from the same samples. The results demonstrate that both sXBP1 mRNA and miR-346 levels increase following TM treatment, reaching a maximum at 8 h after ER stress induction (Fig. 1D). These results are consistent with UPR activation (sXBP1 mRNA increase) and simultaneous miR-346 induction, suggesting a UPR-associated transcriptional activation of miR-346 in human airway epithelial cells.
To determine whether miR-346 expression can be induced by the UPR in other cell types, we performed studies to measure miR-346 levels in Calu-3, HeLa, primary glioblastoma, and primary astrocytoma cells using a panel of classic ER stressors (supplemental Fig. S1). The results of these studies indicate that miR-346 expression is induced by a common UPR mechanism independent of the ER stressor. Importantly, miR-346 expression increased in response to UPR activation in all cells tested. However, the magnitude of miR-346 induction in response to ER stress varied among cell types, and this may reflect differences in basal expression of miR-346.
miR-346 Expression Is Induced by sXBP1
Because miR-346 expression is enhanced during ER stress without any significant change in GRID1 mRNA, we investigated whether UPR-activated transcription factors can activate miR-346 expression. To determine which transcriptional activator to test, we analyzed the putative regulatory region of the miR-346 gene upstream of the transcription start site using the miRGen 2.0 database (26, 27). This analysis indicated a binding site for the UPR-activated transcription factor sXBP1 in addition to binding sites for a number of non-UPR specific transcription factors (supplemental Fig. S2). The location of the sXBP-binding site is −1736 upstream of the transcription start site (26–28).
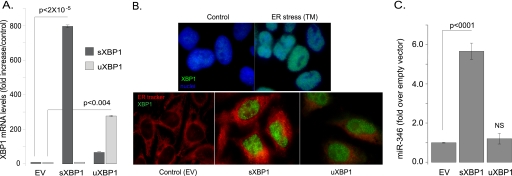
Next, we tested whether the overexpression of the transcriptionally active sXBP1 alone would enhance miR-346 expression. Because miR-346 is expressed in HeLa cells (supplemental Fig. S1), these cells were transfected with plasmids expressing sXBP1, unspliced XBP1 (uXBP1), or an empty vector. To ensure the efficiency of the transfection, we measured sXBP1 and uXBP1 mRNA levels and visualized the nuclear localization of sXBP1 and uXBP1 proteins by immunocytochemistry (Fig. 2, A and B). Although uXBP1 is translated and enters the nucleus, it lacks the ability to promote transcription (29); therefore, overexpression of this construct served as a specificity control. The results indicate that overexpression of sXBP1 increased miR-346 levels, whereas uXBP1 had no effect (Fig. 2C). Therefore, these studies indicate that sXBP1 overexpression is sufficient for miR-346 transcription.
FIGURE 2.
Overexpression of sXBP1 enhances miR-346 levels in HeLa cells. A, overexpression of sXBP1 and uXBP1 constructs in HeLa cells. HeLa cells were transfected with empty vector (EV), sXBP1, and uXBP1 constructs. To assess transfection efficiency, XBP1 mRNA levels were measured by qRT-PCR (n = 3). B, immunofluorescence of XBP1 protein expression. These experiments were performed to confirm that functional sXBP1 is translated following transfection with the sXBP1 construct. In control cells, XBP1 expression cannot be seen (top left panel, nuclei are stained with DAPI). Induction of ER stress (TM) results in XBP1 mRNA splicing, sXBP1 translation, and nuclear targeting (top right panel, DAPI and anti-XBP1 antibody staining). Transfected cells (EV, sXBP1, or uXBP1) were stained with ER-Tracker (red), and XBP1 protein was detected with an anti-XBP1 antibody that recognizes both the sXBP1 and the uXBP1 proteins. Both sXBP1 and uXBP1 proteins enter the nucleus (green). In cells expressing sXBP1, the ER is expanded (red, middle panel) as expected. C, measurement of miR-346 levels. Using the same samples as in A, miR-346 levels were also determined. Results are plotted as -fold increase over EV-transfected, control samples (n = 4). A significant increase in miR-346 levels was observed in cells transfected with sXBP1.
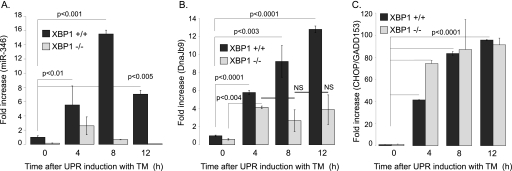
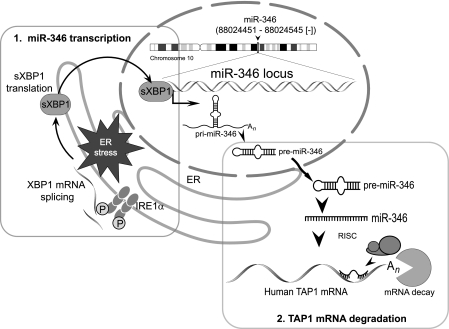
To confirm the role of sXBP1 as transcriptional activator of miR-346 during ER stress, we utilized wild-type (Xbp1+/+) and XBP1 knock-out (Xbp1−/−) mouse embryonic fibroblasts (9). We induced ER stress with TM for different time periods and then assessed miR-346 expression using mouse-specific primers and qRT-PCR. Although miR-346 expression increased in Xbp1+/+ cells, reaching maximal levels by 8 h, miR-346 levels did not change in Xbp1−/− cells, confirming the role of sXBP1 in miR-346 induction (Fig. 3A). To ensure that the XBP1-independent UPR pathways were intact in the Xbp1−/− cells, we assessed the expression of a known XBP1-dependent and an XBP1-independent gene as controls. ERdj4 is encoded by the XBP1-dependent UPR target gene Dnajb9 (30, 31), and the transcription factor C/EBP homologous protein (CHOP, also known as growth arrest and DNA damage gene 153) is encoded by the XBP1-independent UPR target gene Ddit3 (14, 32). As expected, ER stress-associated induction of Dnajb9 was markedly compromised in Xbp1−/− cells (Fig. 3B), whereas CHOP expression was strongly induced in Xbp1−/− cells (Fig. 3C). Therefore, these data demonstrate that sXBP1 is essential for induction of miR-346 during ER stress. A model depicting the mechanism of miR-346 induction during ER stress is presented in Fig. 4.
FIGURE 3.
miR-346 expression is XBP1-dependent. Wild type (Xbp1+/+) and Xbp1-deficient (Xbp1−/−) mouse embryonic fibroblasts (MEF) cells were treated with TM (5 μg/ml) for the time periods specified to activate the UPR. A, relative miR-346 levels. miR-346 levels were measured by qRT-PCR in Xbp1+/+ and Xbp1−/− MEFs to assess the XBP1 dependence of the miR-346 induction. The largest increase in miR-346 levels occurred 8 h after UPR induction in XBP1+/+ MEF cells. ER stress did not increase miR-346 levels in XBP1−/− MEFs. B, Dnajb9 induction is XBP1-dependent. Relative Dnajb9 mRNA levels were also determined from MEF cells. As demonstrated previously, the increased levels of Dnajb9 mRNA were XBP1-dependent. C, CHOP/GADD153 induction is XBP1-independent. Relative CHOP/GADD153 mRNA levels were determined in control and ER-stressed MEFs. In agreement with previous results, the increased levels of CHOP/GADD153 mRNA were independent of XBP1 (n = 4).
FIGURE 4.
ER stress-associated miR-346 induction. Step 1, induction of miR-346 transcription. ER stress activates IRE1α, which splices the XBP1 mRNA, resulting in the translation of sXBP1 protein. sXBP1 enters the nucleus and activates pri-miR-346 transcription. Step 2, target mRNA degradation. Pri-miR-346 enters the miRNA maturation pathway, and in the cytosol, miR-346 is generated. Mir-346 binds to the 3′-UTR of target transcripts and recruits the RNA-induced silencing complex, leading to mRNA decay.
Identification of ER Stress-associated miR-346 Targets
A previous study indicated that miR-436 targets the 5′-UTR of a mouse brain-specific splice variant of the receptor-interacting protein 140 (RIP140) mRNA and induces its expression (25). Based on this, we tested whether RIP140 levels were altered either during ER stress or by miR-346. Our results indicated that neither ER stress nor miR-346 had any effect on RIP140 levels in human Calu-3 airway epithelial cells or in HeLa cells, indicating that RIP140 was not a target.
As a more practical method for identifying the ER stress-associated targets of miR-346, we applied miRNA target prediction algorithms such as TargetBoost and TargetScan (33, 34). These databases were developed based on the observation that the conserved seed pairing sites for miRNAs are often flanked by adenosines (35, 36). Because the bioinformatics analysis predicted 2491 potential targets for miR-346, we turned to an experimental approach. We wanted to focus on targets that were repressed by ER stress and contributed to the regulation of ER protein influx. To accomplish this, we overexpressed an miR-346 mimic that resembles mature miR-346, or a control miRNA (miR-C67) that has no mammalian target sequences, in HeLa cells. We then performed mRNA profiling arrays and selected transcripts that were repressed in the miR-346 mimic-expressing cells.
This approach identified 28 mRNAs as significantly reduced (>2-fold) when the mature form of miR-346 (mimic) was overexpressed. To select transcripts that were also reduced during ER stress, we cross-referenced the results of the mRNA arrays following miR-346 expression in HeLa cells with the results of mRNA profiling performed following ER stress induction in Calu-3 cells. This analysis revealed 21 unique transcripts that were reduced by both ER stress and overexpression of the miR-346 mimic (supplemental Fig. S3). This selection eliminated cell type-specific targets, mRNAs that were reduced by ER stress but not miR-346, and mRNAs that were regulated by miR-346 but not ER stress. Interestingly, the selected targets were MHC-associated genes and interferon-inducible genes (supplemental Fig. S3).
We concentrated our studies on MHC class I (HLA) gene products and the ATP-binding cassette (ABC) transporter, TAP1, because of their biological importance in MHC class I-associated antigen presentation and their role in regulating ER peptide influx. The TAP1/TAP2 heterodimer translocates peptides, derived from the proteasomal degradation of cytosolic proteins, into the ER lumen (37–40). These peptides are then loaded onto MHC class I molecules for subsequent presentation at the cell surface (41). The loading of a peptide into the peptide-binding groove of an assembling MHC class I molecule is essential for the assembly of this complex, exit from the ER (42, 43), and proper MHC class I-associated antigen presentation. Interestingly, recent studies have revealed a relationship between ER stress, the UPR, and reduced trafficking of MHC class I molecules to the cell surface (44). Based on these findings, we tested whether miR-346 could contribute to MHC class I-associated antigen presentation reduction during ER stress. This may occur by reduction of MHC class I levels, TAP, or both.
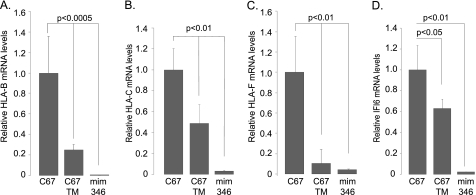
First, we confirmed the results of the mRNA profiling arrays by qRT-PCR. Following transfection of the HeLa cells with the control miR-C67, miR-C67 transfection plus ER stress induction with TM, or transfection with miR-346 mimic, we measured the mRNA levels of four MHC class I gene products (HLA-B, HLA-C, HLA-F, IFI6). The results of these experiments were consistent with results of the mRNA profiling arrays (Fig. 5, A–D).
FIGURE 5.
Confirmation of predicted miR-346 targets by qRT-PCR. A–D, mRNA levels of HLA-B (A), mRNA levels of HLA-C (B), mRNA levels of HLA-F (C), and mRNA levels of IFI6 (D). Relative mRNA levels of four selected mRNAs from supplemental Fig. 3 were tested by qRT-PCR to confirm the effects of miR-346 on the post-transcriptional regulation of these genes. Three different conditions were applied. 1) Cells were transfected with a control miRNA (C67); 2) ER stress was induced with TM (C67 TM); 3) cells were transfected with miR-346 mimic (mim 346). As suggested by the mRNA profiling following miR-346 mimic expression, both ER stress and miR-346 expression caused a significant decrease in all four mRNAs. Results are plotted as relative mRNA levels as compared with mRNA levels in cells transfected with the control miRNA, C67 (n = 4).
However, miR-346-mediated reduction in MHC class I mRNA levels may be direct by binding to the 3′-UTR or indirect by regulating an activator of MHC class I expression. Indeed, TargetScan analysis did not reveal seeding sites for miR-346 on these mRNAs, indicating an indirect regulatory effect. In support of this, a previous study indicated that although MHC class II mRNAs lack miRNA target sites, sites were identified in the class II, major histocompatibility complex, transactivator (CIITA) gene and were shown to repress IFN-γ-induced MHC class II activation indirectly (45). Because analysis of the indirect regulatory pathways was outside the scope of this study, we analyzed the 21 affected mRNAs for possible direct miR-346-binding sites. We found that the human TAP1 mRNA 3′-UTR contains a canonical seeding site for miR-346, and therefore, we analyzed TAP1 further.
miR-346 Directs the Post-transcriptional Repression of Human TAP1 during ER Stress
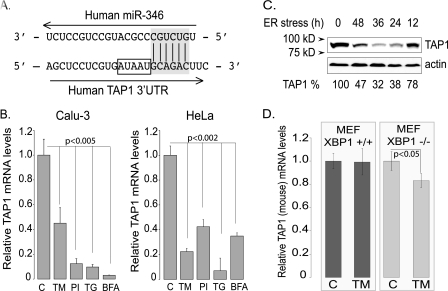
Efficient RNA-induced silencing complex binding and mRNA decay by miRNAs require the binding of the miRNA to the 3′-UTR of the target mRNAs at canonical seeding sites (35). The human TAP1 mRNA 3′-UTR, ∼150 nucleotides 3′ from the stop codon, represented a canonical, perfect 6-nucleotide match (35) for miR-346 with an AU-rich nucleotide composition near the site (46) (Fig. 6A). Surprisingly, scanning the entire 3′-UTR of the mouse TAP1 mRNA indicated no canonical seeding sequences for the mouse miR-346. This difference between the human and mouse TAP1 mRNAs 3′-UTR provided a specificity control for our subsequent experiments. Thus, if miR-346 is directly responsible for post-transcriptional repression of TAP1 mRNA in human cells during ER stress, we predicted that the ER stress-mediated reduction in TAP1 expression observed in human cells would not occur in mouse cells.
FIGURE 6.
The human TAP1 mRNA is a direct target of miR-346. A, the predicted seeding of miR-346 to the 3′-UTR of the human TAP1 mRNA. The human TAP1 mRNA 3′-UTR and the predicted binding site of miR-346 are shown with the 6-mer canonical seeding site highlighted in gray. AU elements in the vicinity of the predicted miR-346 binding are indicated with a rectangle. B, ER stress reduces TAP1 mRNA levels in Calu-3 and HeLa cells. Cells were treated with different ER stressors, TM, proteasome inhibition (PI), thapsigargin (TG), and brefeldin A (BFA), for 12 h, and relative TAP1 mRNA levels were measured. Results are plotted relative to untreated control TAP1 mRNA level (n = 4). C, ER stress reduces TAP1 protein levels. The effects of ER stress (TM) were tested on human TAP1 protein levels in HeLa cells. Cells were treated with TM (5 μg/ml) for the time periods specified, and 30 μg of total protein lysate was analyzed by SDS-PAGE and Western blot analysis for TAP1 expression. Actin was detected as a loading control, and densitometry was performed using ImageJ (National Institutes of Health). The percentage values represent the percentage of untreated control (100%). D, ER stress has no effect on mouse TAP1 mRNA levels. Mouse embryonic fibroblasts (Xbp1+/+ and Xbp1−/−) were treated with TM (5 μg/ml) for 18 h to induce ER stress. The relative mouse TAP1 mRNA levels were determined by qRT-PCR using mouse TAP1-specific primer sets. Results are plotted relative to untreated control (n = 3).
To test this, we induced ER stress with different stressors (TM, proteasome inhibition, thapsigargin, and brefeldin A) in two human cell lines, Calu-3 and HeLa, and found that TAP1 mRNA levels were repressed after 12 h of ER stress in both cell types (Fig. 6B). Reduction of TAP1 protein levels required longer intervals of ER stress (Fig. 6C). In contrast, experiments using XBP1+/+ and XBP1−/− mouse embryonic fibroblasts revealed no significant reduction in expression of murine TAP1 under conditions of ER stress (Fig. 6D). These results support the hypothesis that miR-346 is a direct post-transcriptional regulator of human TAP1 expression during ER stress. Although the mouse homolog of miR-346 exists and is induced by the same transcriptional activator (sXBP1) as in humans, its targets and regulatory activities are different in mice. Here, we concentrated on the direct role of miR-346 in the post-transcriptional regulation of human TAP1.
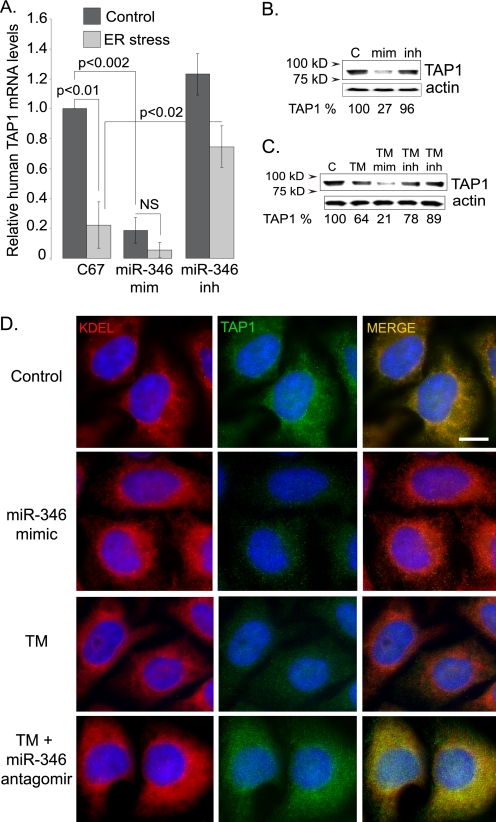
To further investigate whether miR-346 directly regulates human TAP1 expression, we designed experiments in which we overexpressed miR-346 (mimic) or its antagomir (miR-346 inhibitor). We also tested the effects of the miR-346 mimic and antagomir on human TAP1 expression in combination with ER stress (Fig. 7A). Overexpression of miR-346 mimic resulted in TAP1 mRNA reduction similar to ER stress induction, as measured by qRT-PCR. Furthermore, when we expressed the miR-346 mimic and induced ER stress, TAP1 mRNA levels were virtually eliminated. However, expression of the miR-346 antagomir enhanced TAP1 mRNA levels in control cells, and more importantly, stabilized the level of TAP1 mRNA during ER stress (Fig. 7A). We also measured the effects of miR-346 mimic and antagomir expression on human TAP1 protein levels. Overexpression of miR-346 mimic reduced TAP1 protein levels to 27% of control, whereas expression of the miR-346 antagomir had no effects on TAP1 protein levels (Fig. 7B).
FIGURE 7.
The miR-346 antagomir protects TAP1 from ER stress or miR-346 expression. A, ER stress and miR-346 mimic reduce human TAP1 mRNA levels. A control miRNA (C67), miR-346 mimic (mim), and miR-346 antagomir (inh) were expressed in control untreated and TM-treated (5 μg/ml for 20 h) HeLa cells. The relative human TAP1 mRNA levels were measured by qRT-PCR. Results are plotted as -fold change relative to untreated, C67-transfected TAP1 mRNA levels (n = 4). B, miR-346 mimic expression reduces human TAP1 protein levels. Western blots were performed following transfection of HeLa cells with C67 (C), Mir-346 mimic (mim), or antagomir (inh). Actin levels were measured as a loading control. miR-346 mimic expression reduced TAP1 protein levels to 27% of untreated controls. Densitometry was performed using ImageJ (National Institutes of Health). Three individual experiments were performed that gave similar results. C, expression of miR-346 antagomir protects TAP1 from ER stress-associated reduction. Cells were untreated (control) or treated with TM, and then miR-346 mimic (TM mim) or antagomir (TM inh) was expressed in TM-treated cells to study whether the miR-346 antagomir can reduce the effect of ER stress on TAP1 protein levels. TAP1 protein levels were assessed by densitometry (ImageJ) following Western blotting (control represents 100%). β-Actin was used as a loading control. D, TAP1 protein levels decrease following miR-346 mimic expression without significant changes in ER structure. ER structure was visualized by anti-KDEL polyclonal (rabbit) antibody (red). TAP1 was detected with anti-TAP1 monoclonal (mouse) antibody (green), and nuclei were visualized by staining with DAPI (blue). A reduction in TAP1 (green) is apparent following miR-346 mimic expression. Merged images represent co-localization of TAP1 and KDEL sequences (yellow). Bar: 5 μm.
When ER stress and miR-346 mimic were applied in combination, TAP1 protein levels were diminished to 21% of control levels. More importantly, when we induced ER stress in the presence of the miR-346 antagomir, the reduction in TAP1 protein levels was less significant than in the absence of the antagomir (Fig. 7C). These results indicate that the miR-346 antagomir protected the human TAP1 mRNA from miR-346 during ER stress.
As an alternative assay for TAP1 protein expression and to investigate the potential effects of miR-346 overexpression on ER structure, we performed immunofluorescence studies (Fig. 7D). In these experiments, we used an antibody that recognizes the KDEL sequence as a marker of the ER (red) and an anti-TAP1 antibody (green) to label TAP1. The results demonstrate a significant reduction in TAP1 staining in miR-346 mimic-expressing cells and following ER stress induction with tunicamycin for 24 h, whereas there was no effect on the KDEL staining. Furthermore, when ER stress (TM) and miR-346 antagomir were applied together, no reduction in TAP1 staining was evident. These results indicate that inhibition of miR-346-mediated TAP1 mRNA decay blocks the effects of ER stress on decreasing TAP1 protein levels (Fig. 7D). Together, these data support a direct effect of miR-346 in the post-transcriptional regulation of human TAP1 expression.
DISCUSSION
To search for ER stress-induced miRNAs, we performed miRNA profiling arrays in epithelial cells under control and ER stress conditions. Because the predominant function of mammalian miRNAs is to destabilize their target mRNAs (18), we were interested in miRNAs that were enhanced during the UPR. We selected miR-346 because it had the highest -fold increase of any miRNA when the cells were treated with either of two classic chemical ER stress inducers. Mir-346 is an intronic miRNA, encoded in intron 2 of the GRID1 gene (23). Earlier studies suggested that the expression pattern of intronic miRNAs associates with their host genes (47). Indeed, a recent study identified miR-708 as an ER stress-inducible, CHOP-regulated miRNA that is co-regulated with its host gene Odz4, a member of the highly conserved teneurin family of developmental regulators (22). In contrast, our studies revealed that the levels of GRID1 mRNA were unaffected during ER stress, whereas mir-346 levels increased. Our result that miR-346 expression is independent of the GRID1 gene is supported by an earlier study indicating that miR-346 expression does not correlate with its host gene expression pattern. Specifically, the correlation between expression of miR-346 and GRID1 (p = 0.895) was the least among 33 different intronic miRNAs tested (48). Furthermore, although alterations in miR-346 expression have been associated with thyroid cancer progression (49), T lymphocyte activation (24), and TNF-α output (50), these studies did not identify specific targets for miR-346 or factors that regulate its expression.
We demonstrated that sXBP1 is required and sufficient to induce the expression of miR-346 during ER stress. Therefore, our data reveal the first example of an miRNA regulated by a key UPR transcriptional activator sXBP1. Whether other transcription factors participate in the regulation of miR-346 expression, either in the presence or in the absence of ER stress, awaits further study.
Interestingly, miR-346 has been implicated in autoimmune responses during rheumatoid arthritis by regulating IL-18 release from activated synoviocytes (51) and in T-lymphocyte development by regulating leukemia inhibitory factor (LIF) receptor expression (24), suggesting an immunomodulatory role for this miRNA. Therefore, it is notable that the genes affected by miR-346 included MHC class I complex encoded genes, complement factors (MHC III), and interferon-induced (IFI) genes. Significantly, these predicted targets were also reduced during ER stress, as assessed by genome-wide mRNA profiling. However, based on our analysis, most of these mRNAs are not direct targets for miR-346.
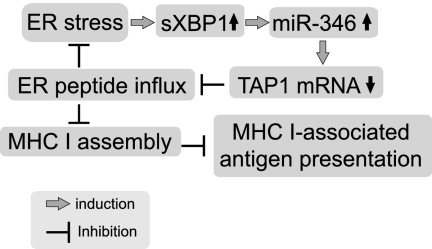
Further support for our findings comes from studies indicating alterations in self-antigen and viral peptide presentation during ER stress, but without a complete understanding of the underlying mechanisms (52–54). Furthermore, it is evident that proper ER homeostasis and TAP function are necessary for the assembly of MHC class I subunits and peptides (41, 55). Therefore, the results presented herein provide an important mechanistic explanation for reduced MHC class I-associated antigen presentation during ER stress. Specifically, we demonstrated that miR-346 indirectly decreases MHC class I (HLA B, HLA C, and HLA F) mRNA levels and directly reduces the expression of human TAP1 (>70%). Furthermore, although the role of IFN-γ-induced miRNAs in the down-regulation of MHC class I-related chain A on tumor cells has been reported (56), here we define novel mechanisms for MHC I and TAP1 regulation during ER stress (Fig. 8).
FIGURE 8.
The biological effects of miR-346 during ER stress. The ER stress-induced sXBP1 transcription factor activates miR-346 expression. TAP1 is a direct target of miR-346. Reduced TAP1 mRNA and protein levels lead to inhibition of peptide influx into the ER. Reduced ER peptide influx contributes to decreased MHC class I-associated antigen presentation.
In addition to the immunological relevance, our data further reveal that miR-346 helps to reduce the influx of nascent polypeptides into the ER by decreasing TAP1 levels. Further, the activation of miR-346 by sXBP1 describes a novel connection between the IRE/XBP1 branch of the UPR and regulation of ER load through reducing TAP1 expression. It will be particularly interesting to explore how these UPR-mediated processes influence immune responses.
In summary, we identified an ER stress, specifically an sXBP1-inducible, intronic miRNA, miR-346, that regulates the expression of a group of MHC-associated genes. Although further studies will be necessary to test the consequences of miR-346 expression and TAP1 reduction during pathological conditions that are associated with UPR induction, the studies presented herein identify a novel relationship between sXBP1 and miR-346 in regulating influx of proteins and peptides into the ER.
Acknowledgments
We thank Ileana V. Aragon for expert technical assistance and Dr. Elizabeth Sztul for critical reading of the manuscript and helpful suggestions. Real time qRT-PCR studies were performed at the Cystic Fibrosis Research Center core facility.
This work was supported, in whole or in part, by National Institutes of Health Grants HL076587 (to Z. B.), GM61970 (to J. W. B.), and DK060065 (to J. F. C.).

The on-line version of this article (available at http://www.jbc.org) contains supplemental Materials and Methods and Figs. S1–S3.
- ER
- endoplasmic reticulum
- miRNA
- microRNA
- miR
- microRNA
- UPR
- unfolded protein response
- TAP1
- antigen peptide transporter 1
- IRE
- inositol-requiring enzyme
- sXBP1
- spliced XBP1
- uXBP1
- unspliced XBP1
- qRT-PCR
- quantitative RT-PCR
- TM
- tunicamycin
- ALLN
- N-acetyl-leucinyl-leucinyl-norleucinal
- CHOP
- C/EBP homologous protein
- C/EBP
- CAAT/enhancer-binding protein
- IFI
- interferon-induced
- MEF
- mouse embryonic fibroblast.
REFERENCES
- 1. Schröder M., Kaufman R. J. (2005) Annu. Rev. Biochem. 74, 739–789 [DOI] [PubMed] [Google Scholar]
- 2. Welihinda A. A., Tirasophon W., Kaufman R. J. (1999) Gene Expr. 7, 293–300 [PMC free article] [PubMed] [Google Scholar]
- 3. Ron D., Walter P. (2007) Nat. Rev. Mol. Cell Biol. 8, 519–529 [DOI] [PubMed] [Google Scholar]
- 4. Rutkowski D. T., Kaufman R. J. (2004) Trends Cell Biol. 14, 20–28 [DOI] [PubMed] [Google Scholar]
- 5. Schröder M., Kaufman R. J. (2005) Mutat. Res. 569, 29–63 [DOI] [PubMed] [Google Scholar]
- 6. Fonseca S. G., Gromada J., Urano F. (2011) Trends Endocrinol. Metab. 22, 266–274 [DOI] [PMC free article] [PubMed] [Google Scholar]
- 7. Malhotra J. D., Kaufman R. J. (2007) Semin. Cell Dev. Biol. 18, 716–731 [DOI] [PMC free article] [PubMed] [Google Scholar]
- 8. Malhotra J. D., Kaufman R. J. (2007) Antioxid. Redox Signal. 9, 2277–2293 [DOI] [PubMed] [Google Scholar]
- 9. Bommiasamy H., Back S. H., Fagone P., Lee K., Meshinchi S., Vink E., Sriburi R., Frank M., Jackowski S., Kaufman R. J., Brewer J. W. (2009) J. Cell Sci. 122, 1626–1636 [DOI] [PMC free article] [PubMed] [Google Scholar]
- 10. Sriburi R., Jackowski S., Mori K., Brewer J. W. (2004) J. Cell Biol. 167, 35–41 [DOI] [PMC free article] [PubMed] [Google Scholar]
- 11. Bartoszewski R., Rab A., Twitty G., Stevenson L., Fortenberry J., Piotrowski A., Dumanski J. P., Bebok Z. (2008) J. Biol. Chem. 283, 12154–12165 [DOI] [PubMed] [Google Scholar]
- 12. Rab A., Bartoszewski R., Jurkuvenaite A., Wakefield J., Collawn J. F., Bebok Z. (2007) Am. J. Physiol. Cell Physiol. 292, C756–C766 [DOI] [PubMed] [Google Scholar]
- 13. DuRose J. B., Scheuner D., Kaufman R. J., Rothblum L. I., Niwa M. (2009) Mol. Cell Biol. 29, 4295–4307 [DOI] [PMC free article] [PubMed] [Google Scholar]
- 14. Harding H. P., Novoa I., Zhang Y., Zeng H., Wek R., Schapira M., Ron D. (2000) Mol. Cell 6, 1099–1108 [DOI] [PubMed] [Google Scholar]
- 15. Hollien J., Weissman J. S. (2006) Science 313, 104–107 [DOI] [PubMed] [Google Scholar]
- 16. Hollien J., Lin J. H., Li H., Stevens N., Walter P., Weissman J. S. (2009) J. Cell Biol. 186, 323–331 [DOI] [PMC free article] [PubMed] [Google Scholar]
- 17. Oda Y., Okada T., Yoshida H., Kaufman R. J., Nagata K., Mori K. (2006) J. Cell Biol. 172, 383–393 [DOI] [PMC free article] [PubMed] [Google Scholar]
- 18. Guo H., Ingolia N. T., Weissman J. S., Bartel D. P. (2010) Nature 466, 835–840 [DOI] [PMC free article] [PubMed] [Google Scholar]
- 19. Bartel D. P. (2009) Cell 136, 215–233 [DOI] [PMC free article] [PubMed] [Google Scholar]
- 20. Bartoszewski R., Rab A., Fu L., Bartoszewska S., Collawn J., Bebok Z. (2011) Methods Enzymol. 491, 3–24 [DOI] [PMC free article] [PubMed] [Google Scholar]
- 21. Lin H. J., Tsai C. H., Tsai F. J., Chen W. C., Chen H. Y., Fan S. S. (2004) Mol. Diagn. 8, 245–252 [DOI] [PubMed] [Google Scholar]
- 22. Behrman S., Acosta-Alvear D., Walter P. (2011) J. Cell Biol. 192, 919–927 [DOI] [PMC free article] [PubMed] [Google Scholar]
- 23. Zhu Y., Kalbfleisch T., Brennan M. D., Li Y. (2009) Schizophr. Res. 109, 86–89 [DOI] [PMC free article] [PubMed] [Google Scholar]
- 24. Thompson L. H., Whiston R. A., Rakhimov Y., Taccioli C., Liu C. G., Croce C., Metcalfe S. M. (2010) Cell Cycle 9, 4213–4221 [DOI] [PMC free article] [PubMed] [Google Scholar]
- 25. Tsai N. P., Lin Y. L., Wei L. N. (2009) Biochem. J. 424, 411–418 [DOI] [PubMed] [Google Scholar]
- 26. Alexiou P., Vergoulis T., Gleditzsch M., Prekas G., Dalamagas T., Megraw M., Grosse I., Sellis T., Hatzigeorgiou A. G. (2010) Nucleic Acids Res. 38, D137–D141 [DOI] [PMC free article] [PubMed] [Google Scholar]
- 27. Landgraf P., Rusu M., Sheridan R., Sewer A., Iovino N., Aravin A., Pfeffer S., Rice A., Kamphorst A. O., Landthaler M., Lin C., Socci N. D., Hermida L., Fulci V., Chiaretti S., Foà R., Schliwka J., Fuchs U., Novosel A., Müller R. U., Schermer B., Bissels U., Inman J., Phan Q., Chien M., Weir D. B., Choksi R., De Vita G., Frezzetti D., Trompeter H. I., Hornung V., Teng G., Hartmann G., Palkovits M., Di Lauro R., Wernet P., Macino G., Rogler C. E., Nagle J. W., Ju J., Papavasiliou F. N., Benzing T., Lichter P., Tam W., Brownstein M. J., Bosio A., Borkhardt A., Russo J. J., Sander C., Zavolan M., Tuschl T. (2007) Cell 129, 1401–1414 [DOI] [PMC free article] [PubMed] [Google Scholar]
- 28. Marson A., Levine S. S., Cole M. F., Frampton G. M., Brambrink T., Johnstone S., Guenther M. G., Johnston W. K., Wernig M., Newman J., Calabrese J. M., Dennis L. M., Volkert T. L., Gupta S., Love J., Hannett N., Sharp P. A., Bartel D. P., Jaenisch R., Young R. A. (2008) Cell 134, 521–533 [DOI] [PMC free article] [PubMed] [Google Scholar]
- 29. Yoshida H., Oku M., Suzuki M., Mori K. (2006) J. Cell Biol. 172, 565–575 [DOI] [PMC free article] [PubMed] [Google Scholar]
- 30. Adachi Y., Yamamoto K., Okada T., Yoshida H., Harada A., Mori K. (2008) Cell Struct. Funct. 33, 75–89 [DOI] [PubMed] [Google Scholar]
- 31. Shaffer A. L., Shapiro-Shelef M., Iwakoshi N. N., Lee A. H., Qian S. B., Zhao H., Yu X., Yang L., Tan B. K., Rosenwald A., Hurt E. M., Petroulakis E., Sonenberg N., Yewdell J. W., Calame K., Glimcher L. H., Staudt L. M. (2004) Immunity 21, 81–93 [DOI] [PubMed] [Google Scholar]
- 32. Lee A. H., Iwakoshi N. N., Glimcher L. H. (2003) Mol. Cell Biol. 23, 7448–7459 [DOI] [PMC free article] [PubMed] [Google Scholar]
- 33. Saetrom O., Snøve O., Jr., Saetrom P. (2005) RNA 11, 995–1003 [DOI] [PMC free article] [PubMed] [Google Scholar]
- 34. Saetrom P., Heale B. S., Snøve O., Jr., Aagaard L., Alluin J., Rossi J. J. (2007) Nucleic Acids Res. 35, 2333–2342 [DOI] [PMC free article] [PubMed] [Google Scholar]
- 35. Lewis B. P., Burge C. B., Bartel D. P. (2005) Cell 120, 15–20 [DOI] [PubMed] [Google Scholar]
- 36. Friedman R. C., Farh K. K., Burge C. B., Bartel D. P. (2009) Genome Res. 19, 92–105 [DOI] [PMC free article] [PubMed] [Google Scholar]
- 37. Bahram S., Arnold D., Bresnahan M., Strominger J. L., Spies T. (1991) Proc. Natl. Acad. Sci. U.S.A. 88, 10094–10098 [DOI] [PMC free article] [PubMed] [Google Scholar]
- 38. Powis S. J., Townsend A. R., Deverson E. V., Bastin J., Butcher G. W., Howard J. C. (1991) Nature 354, 528–531 [DOI] [PubMed] [Google Scholar]
- 39. Kleijmeer M. J., Kelly A., Geuze H. J., Slot J. W., Townsend A., Trowsdale J. (1992) Nature 357, 342–344 [DOI] [PubMed] [Google Scholar]
- 40. Herget M., Tampé R. (2007) Pflugers Arch. 453, 591–600 [DOI] [PubMed] [Google Scholar]
- 41. Heemels M. T., Ploegh H. (1995) Annu. Rev. Biochem. 64, 463–491 [DOI] [PubMed] [Google Scholar]
- 42. Elliott T., Cerundolo V., Elvin J., Townsend A. (1991) Nature 351, 402–406 [DOI] [PubMed] [Google Scholar]
- 43. Neefjes J. J., Momburg F. (1993) Curr. Opin. Immunol. 5, 27–34 [DOI] [PubMed] [Google Scholar]
- 44. de Almeida S. F., Fleming J. V., Azevedo J. E., Carmo-Fonseca M., de Sousa M. (2007) J. Immunol. 178, 3612–3619 [DOI] [PubMed] [Google Scholar]
- 45. Asirvatham A. J., Gregorie C. J., Hu Z., Magner W. J., Tomasi T. B. (2008) Mol. Immunol. 45, 1995–2006 [DOI] [PMC free article] [PubMed] [Google Scholar]
- 46. Grimson A., Farh K. K., Johnston W. K., Garrett-Engele P., Lim L. P., Bartel D. P. (2007) Mol. Cell 27, 91–105 [DOI] [PMC free article] [PubMed] [Google Scholar]
- 47. Baskerville S., Bartel D. P. (2005) RNA 11, 241–247 [DOI] [PMC free article] [PubMed] [Google Scholar]
- 48. Liang Y., Ridzon D., Wong L., Chen C. (2007) BMC Genomics 8, 166 [DOI] [PMC free article] [PubMed] [Google Scholar]
- 49. Weber F., Teresi R. E., Broelsch C. E., Frilling A., Eng C. (2006) J. Clin. Endocrinol. Metab 91, 3584–3591 [DOI] [PubMed] [Google Scholar]
- 50. Semaan N., Frenzel L., Alsaleh G., Suffert G., Gottenberg J. E., Sibilia J., Pfeffer S., Wachsmann D. (2011) PLoS One 6, e19827 [DOI] [PMC free article] [PubMed] [Google Scholar]
- 51. Alsaleh G., Suffert G., Semaan N., Juncker T., Frenzel L., Gottenberg J. E., Sibilia J., Pfeffer S., Wachsmann D. (2009) J. Immunol. 182, 5088–5097 [DOI] [PubMed] [Google Scholar]
- 52. Granados D. P., Tanguay P. L., Hardy M. P., Caron E., de Verteuil D., Meloche S., Perreault C. (2009) BMC Immunol. 10, 10 [DOI] [PMC free article] [PubMed] [Google Scholar]
- 53. Tardif K. D., Siddiqui A. (2003) J. Virol. 77, 11644–11650 [DOI] [PMC free article] [PubMed] [Google Scholar]
- 54. Ulianich L., Terrazzano G., Annunziatella M., Ruggiero G., Beguinot F., Di Jeso B. (2011) Biochim. Biophys. Acta 1812, 431–438 [DOI] [PubMed] [Google Scholar]
- 55. Lankat-Buttgereit B., Tampé R. (2002) Physiol. Rev. 82, 187–204 [DOI] [PubMed] [Google Scholar]
- 56. Yadav D., Ngolab J., Lim R. S., Krishnamurthy S., Bui J. D. (2009) J. Immunol. 182, 39–43 [DOI] [PMC free article] [PubMed] [Google Scholar]
- 57. Applied Biosystems (2004) Relative Quantification: Applied Biosystems 7300/7500/7500 Fast Real-Time PCR System: Getting Started Guide, Applied Biosystems, Carlsbad, CA [Google Scholar]


