

Abstract
Objective
Biomarkers are needed to improve the sensitivity and accuracy of diagnosis as well as prognosis in individuals with early Alzheimer disease (AD). Measures of brain structure and disease-related proteins in the cerebrospinal fluid (CSF) have been proposed as biomarkers, yet relatively little is known about the relationships between such measures. The present study was conducted to assess the relationship between CSF Aβ and tau protein levels and longitudinal measures of hippocampal structure in individuals with and without very mild dementia of the Alzheimer type.
Design
A single CSF sample and longitudinal MR scans were collected. The CSF samples were assayed for tau, p-tau181, Aβ1–42 and Aβ1–40 by ELISA. Large-deformation diffeomorphic metric mapping was used to generate hippocampal surfaces, and a composite hippocampal surface (previously constructed from 86 healthy participants) was used as a structural reference.
Setting:
Patients or Other Participants
13 participants with very mild AD (Clinical Dementia Rating, CDR 0.5) and 11 cognitively normal participants (CDR 0).
Intervention
None.
Main Outcome Measures
Initial and rate-of-change measures of total hippocampal volume and displacement of the hippocampal surface within zones overlying the CA1, subiculum and CA2-4+DG cellular subfields. Their correlations with initial CSF measures.
Results
Lower CSF Aβ1–42 levels and higher tau/Aβ1–42 and p-tau181/Aβ1–42 ratios were strongly correlated with decreases in hippocampal volume and measure of progressive inward deformations of the CA1 subfield in participants with early AD, but not cognitively normal participants.
Conclusions
Despite small sample size, we found that Aβ1–42 and tau-related CSF measures were related to hippocampal degeneration in individuals with clinically diagnosed early AD, and may reflect an association with a common underlying disease mechanism.
Keywords: Magnetic Resonance Imaging (MRI), Hippocampal subfields, β-Amyloid, Tau, P-Tau, biomarkers
INTRODUCTION
Aggregation of the amyloid-β (Aβ) peptide in amyloid plaques and tau in neurofibrillary tangles are the histopathologic hallmarks of Alzheimer’s disease (AD) and are used to confirm the clinical diagnosis of dementia of the Alzheimer-type (DAT) in postmortem brain autopsy. Postmortem studies have shown that by the time dementia becomes apparent, plaques and tangles are prominent in the medial temporal lobe and cortex1, 2. In individuals with DAT, levels of cerebrospinal fluid (CSF) Aβ 1–42 (Aβ1–42) are reduced and tau proteins are elevated3. Moreover, in such patients, lower CSF Aβ1–42 and higher tau levels have been correlated with in vivo cerebral atrophy4, 5, cortical amyloid load as assessed by amyloid imaging6, 7, and increased postmortem plaque and tangle pathology8, 9. In a recent cross-sectional analysis of the relationship between CSF and neuroanatomical measures, Fagan et al.10 suggested that lower Aβ1–42 levels were more strongly associated with brain atrophy in cognitively normal individuals during early amyloid accumulation, while higher tau and phosphorylated tau181 (p-tau181) levels were more strongly associated with brain atrophy in cognitively impaired individuals. Finally, several studies have shown that CSF Aβ1–42, either alone or combined with tau measures (as ratios or linear combination), can be useful for predicting conversion to DAT11, 12.
In the current study, we selected participants from a prior study of CSF biomarkers10 with longitudinal neuroimaging data to investigate the effect of baseline disease pathology as measured by CSF proteins on longitudinal changes of brain structure. Based on our previous study10, we hypothesized that CSF Aβ1–42 levels would be correlated with progressive changes in hippocampal structure in participants with DAT. Further, because we previously found that deformations of the hippocampal CA1 area most powerfully discriminated participants with DAT from cognitively normal individuals13–15, we hypothesized that the strongest correlations would be found between CSF Aβ1–42 levels and inward deformation of the CA1 area of the hippocampal surface, but not in CSF Aβ40, tau181 or p-tau181.
METHODS
Participants
Participants included in this study were selected from previous investigations of relationships between whole-brain measures and levels of CSF biomarkers10. All participants received the Clinical Dementia Rating scale (CDR)16, and an independent diagnosis and staging of DAT according to NINCDS-ADRDA criteria17. The previous study included 69 cognitively normal (CDR 0) and 21 very mild AD (CDR 0.5 with a concurrent diagnosis of DAT) individuals, all scanned on a 1.5T scanner. Investigators elsewhere may characterize at least some of these CDR 0.5 DAT individuals as having mild cognitive impairment rather than AD. We have undergone a scanner field upgrade since the initial study, therefore, only a small number of participants who had longitudinal MR data on the 1.5T scanner platform were included in this study. CSF assessments took place within 2 years of initial scanning. Previous studies of longitudinal changes of CSF have reported mixed results: while some have reported increases in p-tau in individuals with more severe cognitive impairments at baseline 18, 19, the majority reported that CSF biomarkers remained stable over similar intervals20–23. APOE4 allele status was also obtained in these participants. The final sample of 11 CDR 0 and 13 CDR 0.5 participants for this study was small but relatively well matched (Table 1).
Table 1. Participant Summary.
P values are reported from t tests or chi-square tests where appropriate.
| CDR 0 (n=11) | CDR 0.5 (n=13) | p | |
|---|---|---|---|
| age at CSF assessment, yr Mean (SD) | 73.3 (7.6) | 74.6 (4.4) | 0.61 |
| Sex, F/M (% F) | 10/1 (90.9%) | 8/5 (61.5%) | 0.10 |
| MMSE score Mean (SD) [range, 0–30] |
29.2 (0.9) [27 – 30] | 27.1 (2.3) [23 – 30] | 0.014 |
| APOE4 status With at least one ε4-allele |
4 | 10 | 0.045 |
| Interval between CSF assessment and initial scan, yr Mean (SD) [range] |
0.77 (0.75) [0 – 1.8] | 0.37 (0.49) [0 – 1.2] | 0.13 |
| Scan interval, yr Mean (SD) [range] |
1.8 (0.7) [0.3 – 3.0] | 1.7 (0.6) [1.1 – 3.3] | 0.81 |
CSF Collection, Processing, and Biomarker Measurement
CSF (20–30ml) was collected via standard lumbar puncture (LP) in polypropylene tubes at 8:00 AM after overnight fasting as described previously6. Samples from blood contamination were gently inverted to remove possible gradient effects, briefly centrifuged at low speed to pellet any cellular elements, and aliquoted (500 μl) into polypropylene tubes before freezing at −84°C. Total tau, p-tau181, and Aβ1–42 were analyzed by commercial enzyme-linked immunosorbant assay (ELISA, Innogenetics, Ghent, Belgium), performed on aliquots after a single thaw. CSF Aβ1–40 was assayed by ELISA as described elsewhere24.
Imaging and Mapping of Hippocampus
All MR scans were collected on a Siemens 1.5-Tesla VISION system. The scanning protocol included four 3D T1-weighted MPRAGE scans (voxel resolution=1mm×1mm×1.25mm, TR=9.7ms, TE=4.0ms, flip angle=10°, scan time=6.5 min). Scans for each participant were aligned with the first scan and averaged to create a low-noise image25.
For mapping of the volume and surface of the hippocampus, the images were processed using the FreeSurfer+Large-Deformation Diffeomorphic Metric Mapping (FS+LDDMM) pipeline as previously described26, 27. This process consisted 1) FreeSurfer28 labeling and initial affine registration that generated rough hippocampal segmentation, 2) intensity normalization with histogram matching that ensured similar tissue-type intensities, 3) LDDMM-based diffeomorphic mapping29 that produced smooth transformations. The template was the same cognitively normal 69-year-old male CDR 0 participant used previously15, obtained from the same source as the other subjects but not included in the data analysis.
For mapping hippocampal surfaces in longitudinal scans, FS+LDDMM was performed on each participant with its initial scan as the template and follow-up scans as targets. The initial surface of was then carried into each follow-up scan through the diffeormorphic transformation.
Hippocampal Volume, Surface Variation and Change
For each hippocampal surface at each timepoint, volume was calculated as the enclosed volume of the mapped surface. Deformation from an external reference15 was then calculated at each surface point, after rigid registration of all surfaces to the reference, from which average deformation for the CA1, subiculum and CA2-4+DG (CA2, 3, 4 and dentate gyrus combined) subfields were calculated according to previously described methods15, 26. Negative and positive values for these measures represented inward and outward surface deformation, respectively. Normalized whole-brain volumes (nWBV) were computed as the proportion of all voxels occupied by gray and white matter (equivalent to 100%–%CSF) voxels, yielding a unit that represents the proportion of estimated total intracranial volume (ICV)25. Annualized rates of change of the hippocampal volume, subfield deformation and nWBV were calculated by performing a linear regression of each measure at all timepoints against time elapsed since baseline.
Data Analysis
Group differences in the rates of change and initial measures of hippocampal volume and subfield deformation were examined with general linear models using SAS 9.130, where left and right hemispheres were treated as repeated measures. Since no significant hemisphere asymmetry was observed during the analysis, we averaged left+right hemisphere slope measures for correlation analysis (Spearman’s rho) among hippocampal measures. We correlated hippocampal slopes with CSF measures in each group separately, partialling out APOE4 status and age, adjusting for multiple comparisons (alpha=0.0125 for 4 structural variables). We also performed hierarchical regression using each of the CSF measures as the dependent variable, and slopes of volume and CA1 as predictors to examine whether subfield measures accounted for significant variance beyond volume.
RESULTS
Demographics
At baseline, the two groups did not differ in age (t=−0.52, df=22, p=0.61) or gender (chi-square=2.7, p=0.10). The MMSE scores for CDR 0 were significantly higher than that for CDR 0.5 (t=2.7, df=21, p=0.014, one CDR 0 participant missing value). Nine out of the 11 CDR 0 participants had LP prior to scanning (7.9± 9.1 month), and 2 after (16.0±7.4 month). Seven out of the 13 CDR 0.5 participants had LP prior to scanning (1.0±1.1 month), and 6 after (8.6±6.8 month) (Chi-square=2.1, p=0.15). The two groups also did not differ in the time interval between LP and date of initial scan (t=1.6, df=22, p=0.13). Longitudinal MR scans were on average 1.77±0.64 years apart, ranging from 0.31 to 3.32 years, with no difference in the scan interval between the two groups. Ten participants had no APOE4 alleles, while 4 CDR 0 participants and 10 CDR 0.5 participants had at least one APOE4 allele. See Table 1.
Comparison of CSF and Anatomical Change
Group differences for the CSF and neuroanatomical measures are summarized in Table 2. Consistent with the findings reported in Fagan et al.10, CDR 0.5 participants had higher levels of tau (p=0.013), p-tau181 (p=0.048), and lower levels of Aβ1–42 (p=0.090, trend) but not Aβ1–40 (p=0.69). As expected, tau/Aβ1–42 (p=0.0069) and p-tau181/Aβ1–42 (p=0.016) ratios were higher in CDR 0.5 participants.
Table 2. CSF, plasma and neuroanatomic measures.
For CSF and whole brain measures, p values were obtained from t tests. For hippocampal measures, p values were obtained from general linear models where left and right hemispheres were treated as repeated measures.
| Mean (SD) | CDR 0 | CDR 0.5 | T (df) or F(df1, df2) | p | |
|---|---|---|---|---|---|
| Initial CSF measures | CSF tau, pg/ml | 308.7 (155.4) | 446.8 (211.4) | −2.59 (46) | 0.013 |
| CSF p-tau181, pg/ml | 54.8 (21.2) | 68.7 (25.4) | −2.03 (46) | 0.048 | |
| CSF Aβ1–42, pg/ml | 588.7 (225.1) | 474.7 (202.8) | 1.73 (46) | 0.090 | |
| CSF tau/Aβ1–42 | 0.62 (0.49) | 1.07 (0.59) | −2.83 (46) | 0.0069 | |
| CSF p-tau181/Aβ1–42 | 0.11 (0.07) | 0.17 (0.08) | −2.49 (46) | 0.016 | |
| CSF Aβ1–40, pg/ml | 10594 (3834) | 10131 (3670) | 0.4 (45) | 0.69 | |
| Rates of hippocampal change | Volume, mm3/year | L: −42.6 (26.2) | −86.9 (61.7) | 5.29 (1,22) | 0.031 |
| R: −44.3 (38.5) | −78.0 (48.6) | ||||
| CA1, mm/year | L: −0.050 (0.030) | −0.115 (0.081) | 6.46 (1,22) | 0.019 | |
| R: −0.035 (0.035) | −0.069 (0.055) | ||||
| SUB, mm/year | L: −0.023 (0.014) | −0.046 (0.041) | 4.44 (1,22) | 0.047 | |
| R: −0.020 (0.017) | −0.039 (0.027) | ||||
| CA2-4+GD, mm/year | L: −0.013 (0.010) | −0.035 (0.040) | 5.83 (1,22) | 0.024 | |
| R: −0.001 (0.038) | −0.030 (0.038) | ||||
| Initial hippocampal measures | Volume, mm3 | L: 1928 (268) | 1676 (325) | 4.6 (1,22) | 0.043 |
| R: 2452 (385) | 2060 (519) | ||||
| CA1, mm | L: −0.24 (0.22) | −0.62 (0.36) | 7.44 (1,22) | 0.012 | |
| R: −0.28 (0.33) | −0.64 (0.46) | ||||
| SUB, mm | L: −0.14 (0.26) | −0.20 (0.26) | 1.09 (1,22) | 0.31 | |
| R: 0.06 (0.22) | −0.10 (0.36) | ||||
| CA2-4+GD, mm | L: −0.02 (0.22) | 0.05 (0.29) | 0.24 (1,22) | 0.63 | |
| R: 0.23 (0.18) | 0.08 (0.31) | ||||
| Rate of change nWBV, fractional ICV | −0.0029 (0.0046) | −0.0071 (0.0074) | 3.13 (22) | 0.0049 | |
| Initial measure nWBV, fractional ICV | 0.76 (0.04) | 0.74 (0.03) | 1.15 (22) | 0.26 | |
CA1: – deformation for the CA1 subfield. SUB: deformation for the subiculum subfield. CA2-4+GD: deformation for the combined subfields of CA2, 3, 4 and dentate gyrus.
CDR 0.5 participants exhibited significantly accelerated decreases (i.e., more negative annualized rates of change) in hippocampal volumes and more pronounced changes in inward deformation of the CA1, subiculum and CA2-4+GD subfield surface zones as compared to CDR 0 participants, even after covarying baseline measures. Also, consistent with our prior findings in similar populations15, CDR 0.5 participants exhibited significantly smaller baseline hippocampal volumes and more inward deformation of the CA1 subfield surface zones as compared to CDR 0 participants. The CDR 0.5 participants exhibited significantly smaller initial whole brain measure and accelerated whole brain atrophy, as reported elsewhere in similar populations31, 32.
Correlation between CSF and Anatomical Change
Correlations between CSF and hippocampal change are reported separately for the CDR 0.5 and CDR 0 participant groups in Table 3. Significant correlations were only found in the CDR 0.5 participants – lower levels of Aβ1–42, and higher tau/Aβ1–42 and p-tau181/Aβ1–42 ratios were correlated with higher rates of hippocampal volume reduction (i.e., accelerated atrophy) and higher rates of inward deformation (i.e., more negative change) of the CA1 subfield zone. Scatter plots that illustrate these correlations are shown in Figure 1. Similar relationships with the other hippocampal subfield measures were not found (significance reported for p<0.0125, adjusting for multiple comparisons). There were no significant correlations between tau, p-tau181 and Aβ1–42 measures as individual variables and rates of change in hippocampal volume or any subfield measures in the CDR 0.5 participants.
Table 3. Correlation (Spearman’s rho and p value) between CSF measures and rates of hippocampal structural change (slopes).
Significance (highlighted with bold-face) is reported with multiple comparison corrections at p=0.0125 (see text). Partialling out age and/or APOE4 status resulted in similar correlation values and significance.
| Slopes for CDR 0 (n=11) | Slopes for CDR 0.5 (n=13) | |||||||
|---|---|---|---|---|---|---|---|---|
| Spearman r p value | volume | CA1 | SUB | CA2-4+GD | volume | CA1 | SUB | CA2-4+GD |
| tau | −0.53 | −0.54 | −0.71 | 0.16 | −0.62 | −0.56 | −0.55 | −0.099 |
| 0.096 | 0.089 | 0.015 | 0.63 | 0.025 | 0.046 | 0.049 | 0.75 | |
| p-tau181 | −0.53 | −0.49 | −0.66 | 0.15 | −0.38 | −0.38 | −0.35 | 0.027 |
| 0.065 | 0.13 | 0.0260 | 0.67 | 0.20 | 0.20 | 0.24 | 0.93 | |
| Aβ1–42 | 0.082 | 0.15 | 0.10 | −0.15 | 0.69 | 0.71 | 0.56 | 0.41 |
| 0.81 | 0.65 | 0.77 | 0.67 | 0.0087 | 0.0061 | 0.046 | 0.17 | |
| tau/Aβ1–42 | −0.49 | −0.47 | −0.70 | 0.082 | −0.79 | −0.78 | −0.66 | −0.27 |
| 0.13 | 0.14 | 0.016 | 0.81 | 0.0015 | 0.0017 | 0.013 | 0.36 | |
| p-tau181/Aβ1–42 | −0.45 | −0.43 | −0.62 | −0.064 | −0.68 | −0.70 | −0.58 | −0.25 |
| 0.17 | 0.19 | 0.043 | 0.85 | 0.010 | 0.0073 | 0.039 | 0.40 | |
| Aβ1–40 | −0.36 | −0.41 | −0.35 | 0.20 | −0.44 | −0.39 | −0.23 | −0.29 |
| 0.27 | 0.21 | 0.28 | 0.56 | 0.15 | 0.21 | 0.47 | 0.35 | |
CA1 deformation for the CA1 subfield; SUB – deformation for the subiculum subfield; CA2-4+GD – deformation for the combined subfields of CA2,3,4 and dentate gyrus. We also conducted a robust multivariate outlier detection (http://www.math.yorku.ca/SCS/sssg/outlier.html) on each anatomical variable, and found that there was only one CDR 0 outlier and one CDR 0.5 outlier in each case. Removing them from the analysis not only did not diminish the correlations.
Figure 1. Scatter plots of select CSF measures vs. rates of change in hippocampus measures.

Variables with significant correlations (see Table 3) are plotted. Left to right: Aβ1–42, tau/Aβ1–42, p-tau181/Aβ1–42. Top to bottom: slope of CA1 deformation, slope of hippocampal volume. We also conducted a robust multivariate outlier detection (http://www.math.yorku.ca/SCS/sssg/outlier.html) on each anatomical variable, and found that there was only one CDR 0 outlier and one CDR 0.5 outlier in each case. Removing them from the analysis not only did not diminish the correlations.
In the CDR 0 participants, there were no significant correlations between CSF and hippocampal changes. Further, there were no significant correlations between any CSF measure and measures of baseline hippocampal structure in CDR 0.5 or CDR 0 participants (data not shown). The lack of correlation between CSF measures and initial hippocampal volumes were also found in a previously published study of a larger sample (from which this cohort was obtained)10.
The relationships between CSF measures and rates of hippocampal surface deformation are visualized on the hippocampal surfaces with the subfield zones delineated (Figure 2). At each surface location, the slope of surface deformation was first computed via linear regression against time elapsed since baseline, and the correlation between this slope and the CSF measure calculated. The surface locations clustered at 33 or more vertices (accounting for 0.5% or more total hippocampal surface area) with correlation coefficients p 0.05 were colored on the hippocampal surface according to the color scale; those with p>0.05 or did not reach clustering threshold were colored in green. These representations provided visual confirmation of the correlation between Aβ1–42-related measures and inward deformation of the hippocampal surface approximating the CA1 subfield.
Figure 2. Visualization of correlations between CSF measures vs. rates of change in hippocampus measures on the hippocampal surface for the CDR 0.5 group.
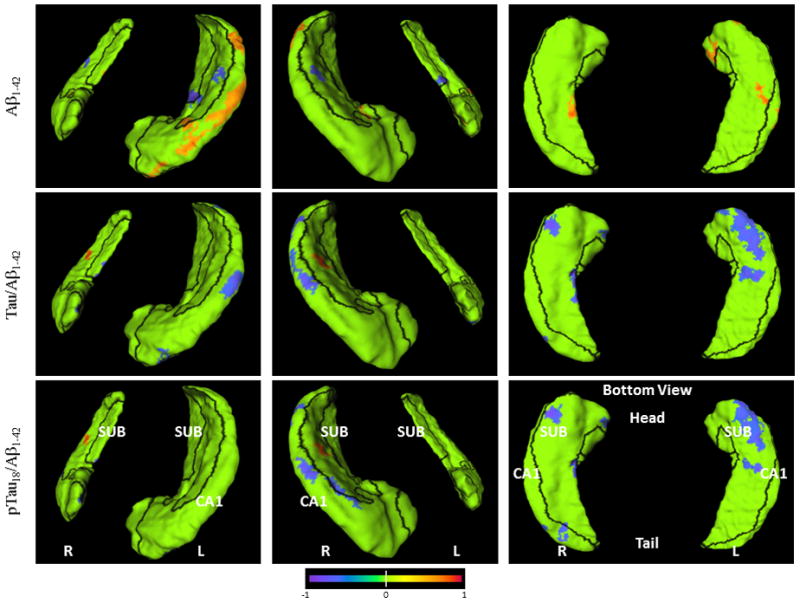
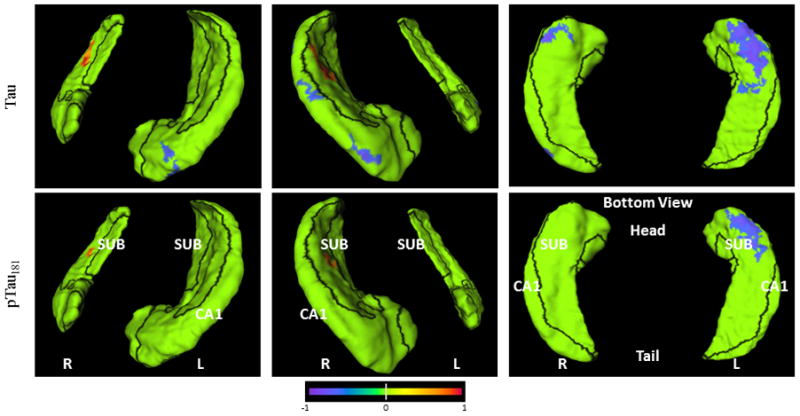
Orientation and hemispheres are as labeled in the panels. Blue to purple colors indicate negative correlations (up to −1) at p<0.05 level, and orange to red colors indicate positive correlations (up to +1) at p<0.05 level. Row 1: Aβ1–42, Row 2: tau/Aβ1–42, Row 3: p-tau181/Aβ1–42; Row 4: tau, Row 5: p-tau181. Visualization of hippocampal surface that have significant correlations is restricted to clusters of 33 or more surface vertices accounting for 0.5% or more total hippocampal surface area.
The rate of change of the hippocampal volume were correlated with that of CA1 (r=0.96, p<.0001), subiculum (r=0.85, p<.0001), and CA2-4+DG (r=0.05). The hierarchical regression analysis showed for Aβ1–42, the CA1 slope did not account for significant variance beyond volume slope (p=0.33); for tau/Aβ1–42, it showed trend level (0.083); and for p-tau181/Aβ1–42, it did (p=0.0076).
DISCUSSION
Our results suggest that lower CSF Aβ1–42 levels and higher tau/Aβ1–42 and p-tau181/Aβ1–42 ratios are correlated with hippocampal degeneration (i.e., accelerated rates of hippocampal volume and specific subfield atrophies but not at the initial timepoint) in individuals with very mild DAT, but not in cognitively normal individuals. Our findings support prior reports of relationships between lower CSF Aβ1–42 levels and increased rates of neurodegeneration of medial temporal lobe structures, including the hippocampus, in individuals with DAT5, 33, 34. Although initial tau and p-tau181 levels exhibited some correlations with changes in hippocampal structure in both participant groups, these correlations did not survive multiple comparison correction. The lack of significant relationships between CSF tau measures and hippocampal degeneration within individuals with very mild DAT or cognitively normal individuals has also been reported elsewhere34–37. While tau is generally assumed to cause hippocampal atrophy, it is possible that tangle load and neurodegeneration may not have reached a level to elevate CSF tau measurement. Also, previously reported correlations between whole-brain volume and Aβ1–42 (but not tau) level in nondemented individuals10 suggest that atrophy may also be caused by Aβ1–42 dysmetabolism early in AD. Indeed, the finding that Aβ1–42 and its related ratios, but not tau, were correlated with hippocampal atrophy further suggests that lowered Aβ1–42 level is a “necessary” but not sufficient condition for structural changes.
Similarly, the lack of significant association between APOE4 status and hippocampal volume loss has also been reported in normal and MCI subjects34. Finally, initial Aβ1–40 levels were not correlated with baseline or change measures of hippocampal structure in either group. These findings are consistent with prior findings that Aβ1–42 is more prone to aggregation than Aβ1–4038 and is therefore more closely associated with the pathogenesis of AD39.
We were able to represent the correlations between Aβ1–42 levels and changes in hippocampal structure as regions on the hippocampal surface related to specific cellular subfields of the hippocampus, namely, the CA1 and subiculum (see also Figure 2). This pattern of progressive inward deformation of the hippocampal surface involving the hippocampal CA1subfield and subiculum was first reported by our group14, 15, 26 and later confirmed by others in cross-sectional studies of AD37, 40–42, aging41, as well as AD-related cognitive decline43. However, the results of this study are the first to relate subfield patterns of structural change to CSF biomarkers of AD, in particular measures related to Aβ1–42 and the tau/Aβ1–42 ratio. These findings are also consistent with the observed pattern of hippocampal pathology in post-mortem studies of individuals with AD; i.e., prominent neuronal degeneration in the hippocampal CA1 subfield2, 44, 45, which suggests that our longitudinal hippocampal mapping algorithm may help to detect subtle neuroanatomical changes that is characteristic of AD. Thus, the measurement of change in hippocampal structure, perhaps in combination with CSF Aβ1–42 or ratio values with tau and p-tau181, may be useful for constructing a biomarker of the underlying disease process in early stage AD.
About 30% of cognitively normal individuals in the middle of their eighth decade have significant AD pathology2, whereas individuals designated as CDR 0.5 predictably progress to greater dementia severity with time and, at autopsy, are highly likely (93%) to have histopathological (i.e., plaques and tangles) AD46. Since decreased CSF Aβ1–42 levels are associated with Aβ aggregation in the brain, our finding that lower Aβ1–42 level and higher tau(s)/Aβ1–42 ratios are related to accelerated hippocampal loss in the CDR 0.5 group, but not in the CDR 0 group, provides support for the role of Aβ1–42 as a key indicator of progression of the disease process underlying AD. Moreover, evidence for increases in CSF tau levels in the setting of decreased Aβ1–42 levels indicates that a neurodegenerative process is taking place. In the current study, the presence of a strong association between Aβ1–42-related measures and longitudinal changes, but not cross-sectional differences, in the hippocampal structure suggests that longitudinal changes in brain structure are highly sensitive indicators of AD-related neurodegeneration. Also, Fagan et al.10 reported that CSF measures did not correlate with hippocampal volumes sampled at a single timepoint, perhaps suggesting that non-specific genetic or environmental factors can obscure disease-related relationships at single timepoints. Our findings that CSF Aβ1–42 levels were not related to longitudinal measures of hippocampal change in cognitively normal individuals are consistent with recent reports that there is no association between beta amyloid burden and longitudinal hippocampal atrophy in these individuals47. Also, even though CA1 slope was highly correlated with volume slope, it accounted for varying degrees of significant variance beyond volume slope for the different CSF measures. This suggests that local measures should be considered when measuring the hippocampus.
There are several limitations to our study. First, the small sample size limits our ability to detect small correlations with sufficient power. For any given CSF marker as a predictor, the power to detect a correlation with R2=0.2 in the 11 CDR 0 participants would be 0.29, whereas for the 13 CDR 0.5 participants with R2=0.48 the power is 0.76. The small sample size further limits our ability to generalize, as well as to interpret, the findings for the subiculum where after correction for multiple comparisons the moderate correlations did not reach statistical significance (Table 3). In addition, increasing the balance between male and females in the CDR 0 group may also help the interpretability of our findings in comparison with the correlations observed in the CDR 0.5 group, as Hua X et al. showed a faster rate of whole brain and medial temporal lobe volume decline in women as compared to men48. Second, we cannot determine whether the correlations we observed reflect a direct relationship between hippocampal degeneration and amyloid deposition within the structure, or a more indirect relationship with amyloid deposition at distant cortical locations (perhaps in regions that project directly or indirectly to the hippocampus). Gross CSF measures are likely not able to capture specific regional amyloid information. Post-mortem confirmation that the individuals assessed as CDR 0.5 had AD was not available at the time of preparation of this paper. Third, the time of CSF collection and MR scanning was on average 4 (CDR 0.5) to 9 (CDR 0) months apart, thus our results should be interpreted with further caution as the predictability of one measure for the other becomes unclear due to the time lag.
Also, our study did not have sufficient sample size to allow further investigation of the cognitively normal participants based on Aβ1–42 cut-offs. Notably, the results of some prior studies have suggested that above a certain threshold, disease-related CSF measures may not be related to brain structural changes49 or age2. Finally, we did not have longitudinal CSF measures on all participants, and in one study, these levels were associated with longitudinal decreases in hippocampal volumes in individuals with mild cognitive impairment5 (n=7). Such analyses may be possible in the future as we continue to follow our participants over time.
In conclusion, despite small sample size, we found that lower CSF Aβ1–42 levels and higher tau/Aβ1–42 and p-tau181/Aβ1–42 ratios are related to progressive hippocampal degeneration in individuals with very mild DAT, and related these CSF measures to patterns of structural change in specific hippocampal subfields. Future studies that include longitudinal CSF measures, larger sample sizes and brain structure measures beyond the medial temporal lobe, as suggested by Fjell et al.33, are needed to further elucidate the relationships of CSF biomarkers and dementia-related neurodegeneration.
Acknowledgments
Funding for this study was provided by NIH grants P01-AG026276, P01-AG03991, P50-AG05681, and a grant from the Pacific Alzheimer Research Foundation. The sponsors have no role in the design and conduct of the study; collection, management, analysis, and interpretation of the data; and preparation, review, or approval of the manuscript. The principal investigator (JCM) takes responsibility for the integrity of the data and the accuracy of the data analysis.
Footnotes
FINANCIAL DISCLOSURES
John Morris: has participated or is participating in clinical trials of antidementia drugs sponsored by: Elan, Eli Lilly and Company, Wyeth, and has served as a consultant or has received speaking honoraria for: AstraZeneca, Bristo-Myers Squibb, Genetech, Lilly, Merck, Novartis, Pfizer, Schering Plough, Wyeth Elan, since 2006.
David Holtzman: co-founded C2N Diagnostics, LLC, and serves as scientific advisor, on scientific advisor boards of En Vivo and Satori, receives research grants from Eli Lilly, Astra Zeneca, and Pfizer to Washington University in St. Louis.
No other author reported biomedical financial interests or potential conflicts of interest.
References
- 1.Arnold SE, Hyman BT, Flory J, Damasio AR, Van Hoesen GW. The topographical and neuroanatomical distribution of neurofibrillary tangles and neuritic plaques in the cerebral cortex of patients with Alzheimer’s disease. Cereb Cortex. 1991;1(1):103–116. doi: 10.1093/cercor/1.1.103. [DOI] [PubMed] [Google Scholar]
- 2.Price JL, Morris JC. Tangles and plaques in nondemented aging and “preclinical” Alzheimer’s disease. Ann Neurol. 1999;45(3):358–368. doi: 10.1002/1531-8249(199903)45:3<358::aid-ana12>3.0.co;2-x. [DOI] [PubMed] [Google Scholar]
- 3.Blennow K. Cerebrospinal fluid protein biomarkers for Alzheimer’s disease. NeuroRx. 2004 Apr;1(2):213–225. doi: 10.1602/neurorx.1.2.213. [DOI] [PMC free article] [PubMed] [Google Scholar]
- 4.Chou YY, Lepore N, Avedissian C, et al. Mapping correlations between ventricular expansion and CSF amyloid and tau biomarkers in 240 subjects with Alzheimer’s disease, mild cognitive impairment and elderly controls. Neuroimage. 2009 Jun;46(2):394–410. doi: 10.1016/j.neuroimage.2009.02.015. [DOI] [PMC free article] [PubMed] [Google Scholar]
- 5.de Leon MJ, DeSanti S, Zinkowski R, et al. Longitudinal CSF and MRI biomarkers improve the diagnosis of mild cognitive impairment. Neurobiology of Aging. 2006;27(3):394–401. doi: 10.1016/j.neurobiolaging.2005.07.003. [DOI] [PubMed] [Google Scholar]
- 6.Fagan AM, Mintun MA, Mach RH, et al. Inverse relation between in vivo amyloid imaging load and cerebrospinal fluid Abeta42 in humans. Ann Neurol. 2006 Mar;59(3):512–519. doi: 10.1002/ana.20730. [DOI] [PubMed] [Google Scholar]
- 7.Fagan AM, Mintun MA, Shah AR, et al. Cerebrospinal fluid tau and ptau(181) increase with cortical amyloid deposition in cognitively normal individuals: implications for future clinical trials of Alzheimer’s disease. EMBO Mol Med. 2009 Nov;1(8–9):371–380. doi: 10.1002/emmm.200900048. [DOI] [PMC free article] [PubMed] [Google Scholar]
- 8.Spires-Jones TL, Stoothoff WH, de Calignon A, Jones PB, Hyman BT. Tau pathophysiology in neurodegeneration: a tangled issue. Trends Neurosci. 2009 Mar;32(3):150–159. doi: 10.1016/j.tins.2008.11.007. [DOI] [PubMed] [Google Scholar]
- 9.Goedert M, Spillantini MG. A century of Alzheimer’s disease. Science. 2006 Nov 3;314(5800):777–781. doi: 10.1126/science.1132814. [DOI] [PubMed] [Google Scholar]
- 10.Fagan AM, Head D, Shah AR, et al. Decreased cerebrospinal fluid Abeta(42) correlates with brain atrophy in cognitively normal elderly. Ann Neurol. 2009 Feb;65(2):176–183. doi: 10.1002/ana.21559. [DOI] [PMC free article] [PubMed] [Google Scholar]
- 11.Fagan AM, Roe CM, Xiong C, Mintun MA, Morris JC, Holtzman DM. Cerebrospinal Fluid tau/beta-Amyloid42 Ratio as a Prediction of Cognitive Decline in Nondemented Older Adults. Arch Neurol. 2007;64(3):343–349. doi: 10.1001/archneur.64.3.noc60123. [DOI] [PubMed] [Google Scholar]
- 12.Li G, Sokal I, Quinn JF, et al. CSF tau/A{beta}42 ratio for increased risk of mild cognitive impairment: A follow-up study. Neurology. 2007;69(7):631–639. doi: 10.1212/01.wnl.0000267428.62582.aa. [DOI] [PubMed] [Google Scholar]
- 13.Csernansky JG, Wang L, Joshi S, et al. Early DAT is distinguished from aging by high-dimensional mapping of the hippocampus. Dementia of the Alzheimer type. Neurology. 2000 Dec 12;55(11):1636–1643. doi: 10.1212/wnl.55.11.1636. [DOI] [PubMed] [Google Scholar]
- 14.Wang L, Swank JS, Glick IE, et al. Changes in hippocampal volume and shape across time distinguish dementia of the Alzheimer type from healthy aging. Neuroimage. 2003 Oct;20(2):667–682. doi: 10.1016/S1053-8119(03)00361-6. [DOI] [PubMed] [Google Scholar]
- 15.Wang L, Miller JP, Gado MH, et al. Abnormalities of hippocampal surface structure in very mild dementia of the Alzheimer type. Neuroimage. 2006 Mar;30(1):52–60. doi: 10.1016/j.neuroimage.2005.09.017. [DOI] [PMC free article] [PubMed] [Google Scholar]
- 16.Morris JC. The Clinical Dementia Rating (CDR): current version and scoring rules. Neurology. 1993;43(11):2412–2414. doi: 10.1212/wnl.43.11.2412-a. [DOI] [PubMed] [Google Scholar]
- 17.McKhann G, Drachman D, Folstein M, Katzman R, Price D, Stadlan EM. Clinical diagnosis of Alzheimer’s disease: report of the NINCDS-ADRDA Work Group under the auspices of Department of Health and Human Services Task Force on Alzheimer’s Disease. Neurology. 1984 Jul;34(7):939–944. doi: 10.1212/wnl.34.7.939. [DOI] [PubMed] [Google Scholar]
- 18.Andersson C, Blennow K, Almkvist O, et al. Increasing CSF phospho-tau levels during cognitive decline and progression to dementia. Neurobiol Aging. 2008 Oct;29(10):1466–1473. doi: 10.1016/j.neurobiolaging.2007.03.027. [DOI] [PubMed] [Google Scholar]
- 19.Stomrud E, Hansson O, Zetterberg H, Blennow K, Minthon L, Londos E. Correlation of longitudinal cerebrospinal fluid biomarkers with cognitive decline in healthy older adults. Arch Neurol. 2010 Feb;67(2):217–223. doi: 10.1001/archneurol.2009.316. [DOI] [PubMed] [Google Scholar]
- 20.Buchhave P, Blennow K, Zetterberg H, et al. Longitudinal study of CSF biomarkers in patients with Alzheimer’s disease. PLoS One. 2009;4(7):e6294. doi: 10.1371/journal.pone.0006294. [DOI] [PMC free article] [PubMed] [Google Scholar]
- 21.Sluimer JD, Bouwman FH, Vrenken H, et al. Whole-brain atrophy rate and CSF biomarker levels in MCI and AD: a longitudinal study. Neurobiol Aging. 2010 May;31(5):758–764. doi: 10.1016/j.neurobiolaging.2008.06.016. [DOI] [PubMed] [Google Scholar]
- 22.Vemuri P, Wiste HJ, Weigand SD, et al. Serial MRI and CSF biomarkers in normal aging, MCI, and AD. Neurology. 2010 Jul 13;75(2):143–151. doi: 10.1212/WNL.0b013e3181e7ca82. [DOI] [PMC free article] [PubMed] [Google Scholar]
- 23.Wahlund LO, Blennow K. Cerebrospinal fluid biomarkers for disease stage and intensity in cognitively impaired patients. Neurosci Lett. 2003 Mar 20;339(2):99–102. doi: 10.1016/s0304-3940(02)01483-0. [DOI] [PubMed] [Google Scholar]
- 24.Cirrito JR, May PC, O’Dell MA, et al. In vivo assessment of brain interstitial fluid with microdialysis reveals plaque-associated changes in amyloid-beta metabolism and half-life. J Neurosci. 2003 Oct 1;23(26):8844–8853. doi: 10.1523/JNEUROSCI.23-26-08844.2003. [DOI] [PMC free article] [PubMed] [Google Scholar]
- 25.Buckner RL, Head D, Parker J, et al. A unified approach for morphometric and functional data analysis in young, old, and demented adults using automated atlas-based head size normalization: reliability and validation against manual measurement of total intracranial volume. Neuroimage. 2004 Oct;23(2):724–738. doi: 10.1016/j.neuroimage.2004.06.018. [DOI] [PubMed] [Google Scholar]
- 26.Csernansky JG, Wang L, Swank J, et al. Preclinical detection of Alzheimer’s disease: hippocampal shape and volume predict dementia onset in the elderly. Neuroimage. 2005 Apr 15;25(3):783–792. doi: 10.1016/j.neuroimage.2004.12.036. [DOI] [PubMed] [Google Scholar]
- 27.Wang L, Khan A, Csernansky JG, et al. Fully-automated, multi-stage hippocampus mapping in very mild Alzheimer disease. Hippocampus. 2009;19(6):541–548. doi: 10.1002/hipo.20616. [DOI] [PMC free article] [PubMed] [Google Scholar]
- 28.Desikan RS, Segonne F, Fischl B, et al. An automated labeling system for subdividing the human cerebral cortex on MRI scans into gyral based regions of interest. Neuroimage. 2006 Jul 1;31(3):968–980. doi: 10.1016/j.neuroimage.2006.01.021. [DOI] [PubMed] [Google Scholar]
- 29.Beg MF, Miller MI, Trouve A, Younes L. Computing Large Deformation Metric Mappings via Geodesic Flows of Diffeomorphisms. International Journal of Computer Vision. 2005;61(2):139. [Google Scholar]
- 30.SAS System for Windows, V9.1.3 [computer program]. Version. Cary, North Carolina: SAS Institute Inc; 2004. [Google Scholar]
- 31.Fotenos AF, Snyder AZ, Girton LE, Morris JC, Buckner RL. Normative estimates of cross-sectional and longitudinal brain volume decline in aging and AD. Neurology. 2005 Mar 22;64(6):1032–1039. doi: 10.1212/01.WNL.0000154530.72969.11. [DOI] [PubMed] [Google Scholar]
- 32.Jack CR, Jr, Petersen RC, Xu Y, et al. Rates of hippocampal atrophy correlate with change in clinical status in aging and AD. Neurology. 2000 Aug 22;55(4):484–489. doi: 10.1212/wnl.55.4.484. [DOI] [PMC free article] [PubMed] [Google Scholar]
- 33.Fjell AM, Walhovd KB, Fennema-Notestine C, et al. CSF Biomarkers in Prediction of Cerebral and Clinical Change in Mild Cognitive Impairment and Alzheimer’s Disease. J Neurosci. 2010;30(6):2088–2101. doi: 10.1523/JNEUROSCI.3785-09.2010. [DOI] [PMC free article] [PubMed] [Google Scholar]
- 34.Schuff N, Woerner N, Boreta L, et al. MRI of hippocampal volume loss in early Alzheimer’s disease in relation to ApoE genotype and biomarkers. Brain. 2009 Apr;132(Pt 4):1067–1077. doi: 10.1093/brain/awp007. [DOI] [PMC free article] [PubMed] [Google Scholar]
- 35.Hampel H, Burger K, Pruessner JC, et al. Correlation of Cerebrospinal Fluid Levels of Tau Protein Phosphorylated at Threonine 231 With Rates of Hippocampal Atrophy in Alzheimer Disease. Arch Neurol. 2005;62(5):770–773. doi: 10.1001/archneur.62.5.770. [DOI] [PubMed] [Google Scholar]
- 36.Leow AD, Yanovsky I, Parikshak N, et al. Alzheimer’s Disease Neuroimaging Initiative: A one-year follow up study using tensor-based morphometry correlating degenerative rates, biomarkers and cognition. Neuroimage. 2009;45(3):645–655. doi: 10.1016/j.neuroimage.2009.01.004. [DOI] [PMC free article] [PubMed] [Google Scholar]
- 37.Apostolova LG, Dutton RA, Dinov ID, et al. Conversion of mild cognitive impairment to Alzheimer disease predicted by hippocampal atrophy maps. Arch Neurol. 2006 May;63(5):693–699. doi: 10.1001/archneur.63.5.693. [DOI] [PubMed] [Google Scholar]
- 38.Jarrett JT, Berger EP, Lansbury PT. The C-terminus of the beta protein is critical in amyloidogenesis. Annals of the New York Academy of Sciences. 1993;695:144–148. doi: 10.1111/j.1749-6632.1993.tb23043.x. [DOI] [PubMed] [Google Scholar]
- 39.Yin YI, Bassit B, Zhu L, Yang X, Wang C, Li YM. {gamma}-Secretase Substrate Concentration Modulates the Abeta42/Abeta40 Ratio: IMPLICATIONS FOR ALZHEIMER DISEASE. J Biol Chem. 2007 Aug 10;282(32):23639–23644. doi: 10.1074/jbc.M704601200. [DOI] [PubMed] [Google Scholar]
- 40.Becker JT, Davis SW, Hayashi KM, et al. Three-dimensional patterns of hippocampal atrophy in mild cognitive impairment. Arch Neurol. 2006 Jan;63(1):97–101. doi: 10.1001/archneur.63.1.97. [DOI] [PubMed] [Google Scholar]
- 41.Frisoni GB, Ganzola R, Canu E, et al. Mapping local hippocampal changes in Alzheimer’s disease and normal ageing with MRI at 3 Tesla. Brain. 2008 Dec;131(Pt 12):3266–3276. doi: 10.1093/brain/awn280. [DOI] [PubMed] [Google Scholar]
- 42.Scher AI, Xu Y, Korf ES, et al. Hippocampal shape analysis in Alzheimer’s disease: a population-based study. Neuroimage. 2007 May 15;36(1):8–18. doi: 10.1016/j.neuroimage.2006.12.036. [DOI] [PubMed] [Google Scholar]
- 43.Xie J, Alcantara D, Amenta N, et al. Spatially localized hippocampal shape analysis in late-life cognitive decline. Hippocampus. 2009 Jun;19(6):526–532. doi: 10.1002/hipo.20618. [DOI] [PMC free article] [PubMed] [Google Scholar]
- 44.Bobinski M, de Leon MJ, Tarnawski M, et al. Neuronal and volume loss in CA1 of the hippocampal formation uniquely predicts duration and severity of Alzheimer disease. Brain Res. 1998;805(1–2):267–269. doi: 10.1016/s0006-8993(98)00759-8. [DOI] [PubMed] [Google Scholar]
- 45.Bobinski M, Wegiel J, Wisniewski HM, et al. Neurofibrillary pathology--correlation with hippocampal formation atrophy in Alzheimer disease. Neurobiol Aging. 1996;17(6):909–919. doi: 10.1016/s0197-4580(97)85095-6. [DOI] [PubMed] [Google Scholar]
- 46.Morris JC, Storandt M, Miller JP, et al. Mild cognitive impairment represents early-stage Alzheimer disease. Arch Neurol. 2001 Mar;58(3):397–405. doi: 10.1001/archneur.58.3.397. [DOI] [PubMed] [Google Scholar]
- 47.Driscoll I, Zhou Y, An Y, et al. Lack of association between 11C-PiB and longitudinal brain atrophy in non-demented older individuals. Neurobiology of Aging. 2010 doi: 10.1016/j.neurobiolaging.2009.12.008. In Press, Corrected Proof. [DOI] [PMC free article] [PubMed] [Google Scholar]
- 48.Hua X, Hibar DP, Lee S, et al. Sex and age differences in atrophic rates: an ADNI study with n=1368 MRI scans. Neurobiol Aging. 2010 Aug;31(8):1463–1480. doi: 10.1016/j.neurobiolaging.2010.04.033. [DOI] [PMC free article] [PubMed] [Google Scholar]
- 49.Fjell AM, Walhovd KB, Fennema-Notestine C, et al. Brain Atrophy in Healthy Aging Is Related to CSF Levels of A{beta}1–42. Cereb Cortex. 2010:bhp279. doi: 10.1093/cercor/bhp279. [DOI] [PMC free article] [PubMed] [Google Scholar]