

Abstract
Age at the onset of motor symptoms in Huntington disease (HD) is determined largely by the length of a CAG repeat expansion in HTT but is also influenced by other genetic factors. We tested whether common genetic variation near the mutation site is associated with differences in the distribution of expanded CAG alleles or age at the onset of motor symptoms. To define disease-associated single-nucleotide polymorphisms (SNPs), we compared 4p16.3 SNPs in HD subjects with population controls in a case:control strategy, which revealed that the strongest signals occurred at a great distance from the HD mutation as a result of “synthetic association” with SNP alleles that are of low frequency in population controls. Detailed analysis delineated a prominent ancestral haplotype that accounted for ∼50% of HD chromosomes and extended to at least 938 kb on about half of these. Together, the seven most abundant haplotypes accounted for ∼83% of HD chromosomes. Neither the extended shared haplotype nor the individual local HTT haplotypes were associated with altered CAG-repeat length distribution or residual age at the onset of motor symptoms, arguing against modification of these disease features by common cis-regulatory elements. Similarly, the 11 most frequent control haplotypes showed no trans-modifier effect on age at the onset of motor symptoms. Our results argue against common local regulatory variation as a factor influencing HD pathogenesis, suggesting that genetic modifiers be sought elsewhere in the genome. They also indicate that genome-wide association analysis with a small number of cases can be effective for regional localization of genetic defects, even when a founder effect accounts for only a fraction of the disorder.
Introduction
Huntington disease (HD; [MIM 143100]) is a dominantly inherited neurodegenerative disorder characterized by involuntary movements, motor deficits, cognitive decline, and psychiatric disturbance. The genetic defect was originally mapped to chromosome 4p16.3 by linkage to DNA polymorphisms and then confined to a segment of ∼2 Mb by crossover analysis in families.1 Further narrowing of the candidate region was accomplished by association analysis with both multi-allele and dimorphic DNA markers, which revealed the existence of multiple ancestral haplotypes and led to the identification of the genetic defect as an expansion mutation in the CAG trinucleotide repeat of HTT (formerly HD [MIM 613004]) in chromosomal region 4p16.3.2 Not only does the length of the HTT CAG repeat determine the probability that HD will be manifest (alleles of 36–39 repeat units do not show full penetrance), but it is also the primary determinant of when these symptoms develop; when there are more than 39 repeats, the age at onset of diagnostic motor symptoms decreases with increasing CAG length.2–6 Importantly, some portion of the variance in the age at onset is not explained by the CAG-repeat length. For example, in a sample of 492 HD individuals with a CAG repeat length of 44, ∼46% developed diagnostic motor symptoms at an age that was more than 5 years earlier or later than the average age at onset (44.4 years).7 The unexplained variance in age at onset shows heritability,8–10 supporting the idea that genetic factors in addition to the CAG repeat are involved in determining the age at onset of HD symptoms. Though genetic modifiers of HD might be located anywhere in the genome, an attractive hypothesis is that the chromosomal region of HTT itself harbors variation that alters HD pathogenesis. Interestingly, even before the expanded CAG repeat was identified, a locus closely linked to the HD mutation was hypothesized to modify age at onset.11 Subsequently, suggestive evidence was reported for linkage of an age-at-onset modifier near HTT,12 raising a potential role for the 4p16.3 haplotype surrounding the CAG expansion as a cis-acting modifier of the rate of disease pathogenesis leading to the onset of motor symptoms, possibly through regulation of HTT expression or through an effect on its protein product, huntingtin. Similarly, a cis-acting factor affecting the stability of the CAG repeat has also been proposed as a factor in the disease.13 Because HD proceeds inexorably to death an average of 16 years after the onset of motor symptoms and because there is no preventative or attenuating treatment, a mechanism capable of delaying the onset of HD symptoms could be of great benefit. Consequently, we have tested the hypothesis of a cis-acting modifier of CAG-repeat length and/or the onset of HD motor symptoms by evaluating the extended SNP haplotypes of the HTT region from mutant and normal chromosomes. In carrying out this study, we also uncovered “synthetic association” signals, which we examined in more detail in order to guide future association analyses of HD modifiers and other disorders.
Material and Methods
Subjects, SNP Genotyping, and Quality Control
DNA samples from HD subjects were collected locally or from collaborating investigators by the Huntington's Disease Center Without Walls at Massachusetts General Hospital with proper informed consent and were studied with approval of the Partners HealthCare Institutional Review Board. SNP genotyping was performed with the Genome-Wide Human SNP Array 6.0 (Affymetrix, Santa Clara CA) at the Broad Institute of MIT and Harvard (Cambridge MA). As population controls, we used individuals who were of European ancestry and who had been genotyped with the same platform in a previous study but who were not assessed for HD.14 For a stringent analysis, initial quality controls (QCs) were applied to each cohort independently (SNP genotyping call rate > 99%; minor-allele frequency > 5%). The Hardy-Weinberg equilibrium p value filter was applied to controls (p > 1 × 10⁻⁶). On the basis of high-quality SNPs that had passed QC, we identified unrelated subjects of European ancestry by comparing estimated identity-by-descent (IBD) calculated by the PLINK program15 to those of HapMap samples. Subsequently, SNPs showing significantly different call rates between HD subjects and controls were also excluded (p < 0.001). Finally, we obtained genotypes for 436,185 SNPs for 2,375 individuals (699 HD subjects and 1,676 controls) (sample genotyping call rate: 99.903%).
Genotyping of the Delta2642 In/Del Polymorphism
We genotyped delta2642 in HD subjects by using a previously established PCR assay with slight modifications.16 In brief, genomic DNA (30 ng) was amplified by PCR with fluorescently labeled primers (6-FAM-5′-GCTGGGGAACAGCATCACACCC-3′ and 5′-CCTGGAGTTGACTGGAGACTTG-3′), then separated with an ABI 3730 DNA analyzer (Applied Biosystems, Foster City, CA). Subsequently, the sizes of resolved PCR products were determined by the GeneMapper program (version 3.7) on the basis of the internal size standards (GeneScan 500-LIZ) so that sample genotypes could be obtained.
Genome-wide Association Analysis
We performed a case-control association analysis that compared genotypes of HD subjects (699 unrelated HD individuals) to those of independent population controls (1,676 individuals not assessed for HD) by using a chi-square test implemented in PLINK.15 Because HD is dominantly inherited, a dominant model was used, and SNPs with a genotype count smaller than 5 in either HD subjects or controls were excluded. We observed significant association (p < 5 × 10⁻⁸) for multiple markers in chromosomal region 4p16.3 and for six other SNPs (rs3754791, rs1376313, rs4605656, rs1405178, rs1360098, and rs16928445) not in this region. We were able to dismiss the latter as being due to technical artifacts by performing proxy-drop association analysis with the PLINK program. In this analysis, we excluded and then reimputed each SNP, and we used neighboring SNPs for the subsequent association analysis (data not shown). We then extracted all SNPs in the 4p16.3 region of association for further analysis.
Haplotype Phasing and Analysis
Haplotype phasing of SNPs was performed with the MACH program. 4p16.3 SNPs that showed significant association with HD (p < 0.01) in the original dominant-model analysis (59 SNPs) or in the dropout association analysis (21 SNPs) were used for haplotype phasing. Among these, 21 SNPs were significant in both analyses (Table S1, available online). In addition to genotypes of 61 SNPs, we included genotypes of HD CAG-repeat mutation (expanded or normal) and the delta2642 polymorphism (insertion or deletion) in phasing in order to identify HD chromosomes and the major HD haplotype chromosome, respectively, in HD subjects. The genotype of the HTT CAG repeat in HD individuals was coded as a biallelic system, in that each individual was a heterozygote with one expanded and one normal allele. Among controls, each individual was coded as a homozygote with two normal alleles of the HTT CAG repeat. Association of haplotypes with differences in CAG length, age at onset, or residual age at onset of motor symptoms was tested in an ANOVA model followed by post-hoc test with Tukey's HSD test in R (2.7.2). Residual age at onset of motor symptoms of an HD subject was the difference between the actual natural log-transformed age at onset of that individual and the natural log-transformed age at onset predicted on the basis of a large collection of HD subjects with the same expanded HD CAG-repeat length.7
Results
SNP Comparison of HD and Control Subjects
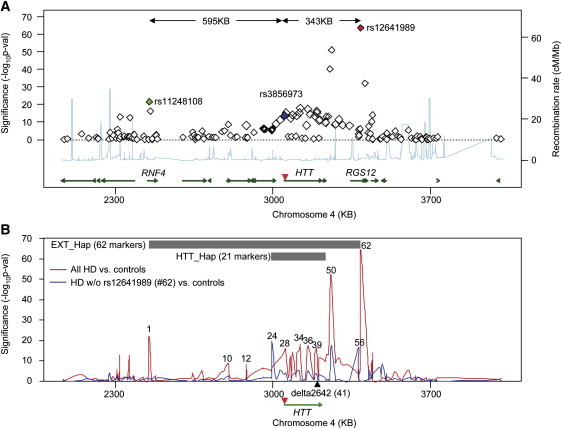
HTT maps approximately 3 Mb from the short-arm telomere in the p16.3 subband of chromosome 4. As a first step to examining the haplotype structure of HD chromosomes, we extracted genotypes from this region for 699 unrelated HD subjects of European origin and 1,676 population controls.14 We generated these genotypes by using the Affymetrix Genome-Wide Human SNP Array 6.0 platform and compared them by standard case-control association analysis (see Figure S1 for a Q-Q plot). Within an ∼1 Mb region, 40 SNPs showed genome-wide significance (dominant model, p < 5 × 10⁻⁸) for association with the disorder, and most of these were centered as expected around HTT (Figure 1A). Surprisingly, however, the SNP most significantly associated with HD (i.e., rs12641989; red diamond; p = 1.73 × 10−64) did not map to HTT but rather mapped to RGS12 [MIM 602512], located 343 kb proximal to the CAG expansion mutation (Figure 1A). In addition, a group of SNPs (including rs11248108; green diamond; p = 1.74 × 10⁻²²), approximately 600 kb distal to the CAG-expansion mutation, showed significant association signals with HD (Figure 1A). By contrast, the SNP closest to the CAG-expansion mutation, rs3856973 (blue diamond; p = 1.87 × 10⁻¹⁴), did not give as strong a signal, and several SNPs within HTT gave p values that were not significant. These results suggested that there are multiple different mutation-bearing SNP haplotypes in the HD population and that one or more of these haplotypes bears SNPs that contribute to apparent synthetic association at a considerable distance from the HD mutation.17,18
Figure 1.
Huntington Disease Case-Control SNP Association Analysis
(A) A regional association plot focusing on the 4p16.3 region of significant association signals from HD case-control analysis is shown. Green lines represent genes, and the light blue line shows the recombination rate (secondary y axis) based on HapMap release 22 data. Genomic locations of SNPs and genes were based on the UCSC hg18 genome assembly. SNP rs3856973 (blue diamond) maps closest to the HD CAG expansion mutation (inverted red triangle). SNP rs12641989 (red diamond) shows the strongest association signal (p = 1.73 × 10−64), and the distant SNP rs11248108 (green diamond) also showed strong association with the disease (p = 1.74 × 10⁻²²).
(B) To test whether rs12641989 tagged the most abundant HD haplotype and to identify SNPs associated with other haplotypes, we compared the association signals in the original association analysis (699 HD versus 1676 controls; red trace) to those from an association analysis (315 HD versus 1676 controls; blue trace) from which HD samples with at least one minor allele for rs12641989 had been excluded. The location of the HTT CAG repeat is given as an inverted red triangle. Above the map are bars indicating two segments for which detailed haplotype analysis was performed: EXT_Hap (comprising 62 markers from rs11248108 to rs12641989) and HTT_Hap (comprising 21 markers spanning HTT) (for markers see Table S1). SNPs from the former were arbitrarily numbered sequentially from telomeric to centromeric (e.g., 1, rs11248108; 10, rs189139; 12, rs762847; 24, rs2857845; 28, rs2285086; 34, rs11731237; 36, rs2298969; 39, rs82333; 41, delta2642 (black triangle); 50, rs1138690; 56, rs1730768; and 62, rs12641989).
To confirm this interpretation, we excluded HD subjects with at least one minor allele for rs12641989 (384 subjects) and performed the case-control association analysis again by using the remaining HD subjects (315 subjects) and all controls (1676 subjects). The plot in Figure 1B shows the results of the association analyses (dominant model) before (red trace) and after (blue trace) the exclusion of HD subjects with the minor allele of rs12641989 (marker 62). As expected, many SNP association signals were attributable to HD-mutation-bearing chromosomes marked by the rs12641989 minor allele; these signals disappeared when these HD chromosomes were excluded. Surprisingly, among the association signals that disappeared was the one at rs11248180 (marker 1), indicating that both rs12641989 and rs11248180 mark an extended haplotype of ∼938 kb associated with the most abundant HD-mutation-bearing chromosome. Notably, the exclusion of HD samples on the basis of rs12641989 also generated new genome-wide-significant association signals at rs2857845 (marker 24) and rs1730768 (marker 56), indicating that these markers tag one or more haplotypes whose ancestral origin is likely to be different from that of the most frequent HD haplotype. These findings are consistent with the multi-allele-marker haplotype studies that led originally to localization of the HD mutation and which revealed that although the HTT region exhibits many different haplotypes, one apparent founder haplotype, marked by an HTT-codon deletion polymorphism, delta2642, was particularly frequent among HD-mutation-bearing chromosomes (for convenience, here we refer to this haplotype as the “major” HD haplotype).16,19
SNP-Based Haplotypes across the HTT Region
To determine the proportion of HD chromosomes bearing the extended 938 kb haplotype detected above, we generated SNP haplotypes (including the delta2642 codon deletion) for 62 polymorphic sites from rs11248180 to rs12641989 (Figure 1B; Table S1). We assumed that each individual with HD had one mutant (defined as having >35 CAGs) and one wild-type (defined as having <36 CAGs) allele. Fully 165 (23.6%) of the 699 HD chromosomes shared the entire 62 SNP haplotype (Table S2), whereas only 2.1% of control chromosomes did so, suggesting a common ancestral origin for these HD chromosomes and preservation of an extended region of identity by descent due to the relatively low recombination rate across this segment of 4p16.3 (Figure 1A, light blue trace).
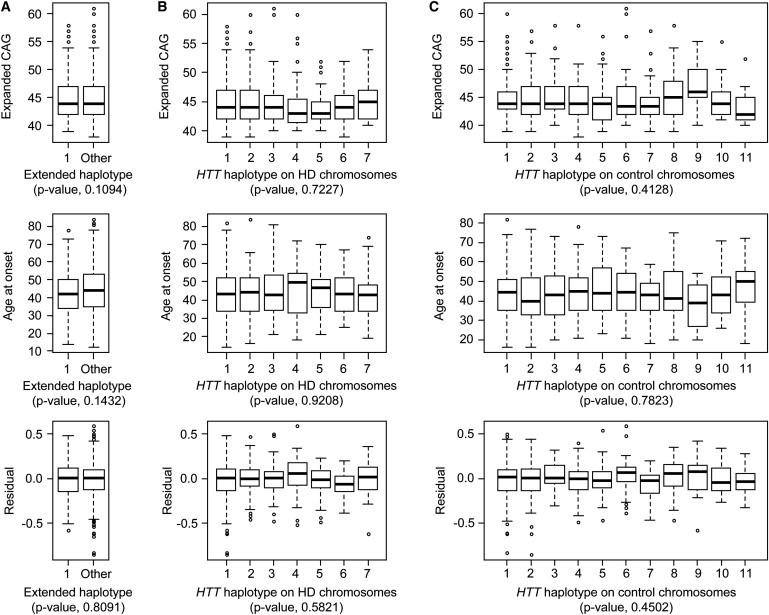
To test for evidence of a cis-acting modifier within this large segment, we compared HD subjects who shared this haplotype to those with all other HD haplotypes across this segment. There was no significant difference in the distribution of expanded CAG-repeat lengths, the distribution of ages at onset of diagnostic neurologic manifestations in these subjects, or the distribution of residual age at onset after the effect of the CAG-repeat length was taken into account (Figure 2A).
Figure 2.
Local 4p16.3 Haplotype Does Not Influence Distribution of Either HD Expanded CAG Repeat Length or the Age at the Onset of Motor Symptoms
(A) The distributions of expanded CAG repeat length (top), age at the onset of motor symptoms (middle), and residual of age at the onset of motor symptoms after the length of the CAG repeat (bottom) had been taken into account were compared for 165 individuals with an identical extended haplotype on their HD-mutation-bearing chromosome (1: Extended haplotype 1) across the EXT_Hap segment (Figure 1B) versus the other 424 HD subjects (Extended haplotype Other).
(B) The distributions of expanded CAG repeat length (top), age at the onset of motor symptoms (middle), and residual of age at the onset of motor symptoms after the length of the CAG repeat (bottom) had been taken into account were compared for the seven most abundant HD-mutation-bearing chromosome haplotypes, shown in Figure 3, across the HTT_Hap region (from Figure 1B).
(C) The distributions of expanded CAG repeat length (top), age at the onset of motor symptoms (middle), and residual of age at the onset of motor symptoms after the length of the CAG repeat (bottom) had been taken into account were compared for the 11 most common control haplotypes across the HTT_Hap region (see Figure 1B).
Each distribution is shown as a box plot, where the top, middle and bottom of the box represent the 75th percentile, median, and 25th percentile data points, respectively. The top and bottom horizontal lines (i.e., top and bottom whiskers, connected to the box by a vertical dashed line) represent the maximum and minimum data points, respectively, after outliers were removed by a standard interquartile method (1.5× interquartile). p values of ANOVA models are shown in parentheses.
Although the extended 938 kb haplotype was readily detectable, the even greater frequency of the delta2642 deletion allele suggested that this same ancestral chromosome was also the source of additional HD chromosomes among the 699 whose shared haplotypes, as a result of historical recombination events, were not as extended. Consequently, we generated SNP haplotypes spanning HTT for both HD and normal chromosomes and compared all HD-mutation-bearing haplotypes that occurred 20 or more times among the 699 HD chromosomes. This more restricted haplotype of 21 markers spanned ∼235 kb from rs2857845, 48 kb upstream of HTT, to rs3095073, 17 kb downstream (Figure 1B; Table S3). The first three SNPs were located telomeric to the site of the CAG repeat, and the remainder were centromeric to it.
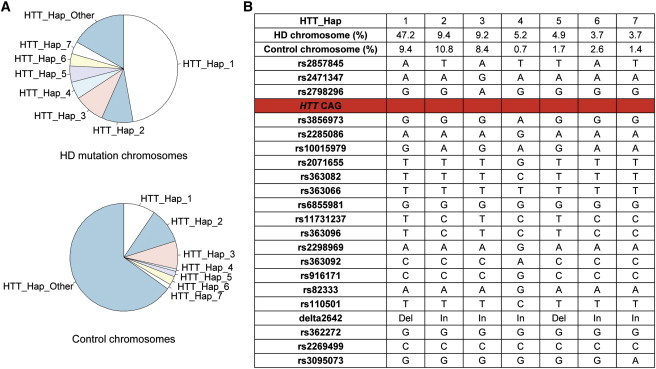
As expected, the vast majority of chromosomes bearing a CAG expansion could be grouped into a limited number of HD haplotypes; ∼83% of all HD chromosomes fell into one of seven different haplotypes (Figure 3). Of these, the most frequent, HTT_Hap_1 (which forms the core of the shared extended haplotype noted above), accounted for almost half of all HD-mutation-bearing chromosomes. Most of the remaining haplotypes are likely to have arisen from the occurrence of independent HD mutations, although some could have been derived from HTT_Hap_1 or from one another by one or more historical recombination events within the 235 kb segment spanned by this haplotype. For example, HTT_Hap_5, present on ∼5% of HD-mutation-bearing chromosomes, might have been derived from HTT_Hap_1 as a result of a rare recombination event between rs2857845 and rs2471347, the ultimate and penultimate SNPs on the telomeric end of the haplotype (Figure 3B).
Figure 3.
Haplotypes across HTT
(A) The relative frequencies of each HTT_Hap among HD-mutation-bearing chromosomes (top) and control subjects (bottom) are shown in pie charts.
(B) The seven most frequent haplotypes across HTT on HD-mutation-bearing chromosomes are shown, with the name and allele of each of 21 markers (20 SNPs and 1 in/del). Also given are the frequencies of these haplotypes on HD-mutation-bearing and control chromosomes and the location of the HTT CAG repeat (red line).
For each of these seven most frequent HD haplotypes, we again examined the distribution of CAG repeat lengths on HD-mutation-bearing chromosomes, the distribution of ages at onset of these subjects, and the distribution of residual age at onset after we had accounted for the effect of the CAG-repeat length. By ANOVA, we found that the individual HD haplotypes did not significantly influence CAG-repeat length, age at onset, or residual of age at onset (Figure 2B). We also compared the subjects with HTT_Hap_1 against all other HD subjects and again found no significant difference in any of the three parameters (data not shown).
Thus, neither HTT nor the almost 1 Mb surrounding region represented by the common extended HD haplotype showed evidence of a cis-acting modifier of either CAG-repeat length or age at onset of motor symptoms.
Lack of HD Modification by the Normal-Chromosome HTT Region
The haplotype structure of the normal chromosome in each HD individual also offered us the potential to test whether the haplotype of the normal HTT allele acts as a modifier of the age at onset of motor symptoms. We have previously showed that the length of the HTT CAG repeat on the normal chromosome, and by consequence the length of the polyglutamine tract in normal huntingtin, does not modify the age at onset of motor symptoms caused by mutant huntingtin.7 However, although normal huntingtin's polyglutamine tract does not have an impact, it is conceivable that differences that occur in the level or pattern of expression of the normal HTT allele and which are associated with differences in local haplotype might have a modifier effect. To test this possibility, across HTT (21 SNPs) we defined 11 haplotypes that were most abundant on control chromosomes; each had a population frequency of >2%. Together, these 11 haplotypes accounted for ∼79% of the normal chromosomes present in the 699 HD individuals genotyped. We modeled the residual of age at onset after accounting for the effect of the expanded CAG repeat as a function of normal chromosome HTT haplotype in each individual and found no significant evidence of disease modification (Figure 2C). As was the case for the HD-mutation-bearing HTT haplotypes, posthoc testing did not reveal any significant differences between individual haplotypes (data not shown). Thus, as with the HTT region of HD-mutation-bearing chromosomes, the HTT region of at least the majority of normal chromosomes does not act as a modifier of the age at the onset of motor symptoms in HD.
Underlying Mechanisms of Synthetic Association in the HD-Control GWAS
As noted above, the overall case-control association analysis was remarkable for yielding the most-significant association signals at a considerable physical distance from HTT. Because the causal mutation located in exon 1 of HTT is well established,2 our data provide a rare opportunity for investigating the underlying mechanisms of such synthetic association in an actual experimental dataset. It was evident from the haplotype analyses that the minor alleles for rs12641989 (A) in RGS12 and rs11248108 (A) in RNF4 (MIM 602850) were both overrepresented in the HD cohort. In the case of the latter marker, this overrepresentation was a result of its presence on the 165 major HD haplotype chromosomes with the 938 kb shared extended haplotype; in the case of the former marker, the overrepresentation was a result of its presence on the majority of the 330 HD chromosomes that bear HTT_Hap_1, all of which also have the delta2642 deletion allele. However, none of the SNP markers in HTT itself yielded scores as highly significant as these distant markers. Clearly, the relative significance of the SNPs did not correlate with their physical distance from the causal variation (Figure S2A), but as expected, it did correlate strongly with the difference in allele frequency between cases and controls (Figure S2B). Although for these markers the absolute difference in minor-allele frequency between cases and controls was slightly correlated with distance from the expanded CAG (Figure S2C), we observed a much stronger correlation between control minor-allele frequency and association significance (Figure S2D). On the basis of these observations, we hypothesized that the synthetic association signals in the HD case-control GWAS were created by a combination of the existence of an extended version of an ancestral major haplotype represented by HTT_Hap1 (and probably HTT_Hap5) and the presence on chromosomes with that haplotype of minor alleles for some SNP markers that show low minor-allele frequency in controls.
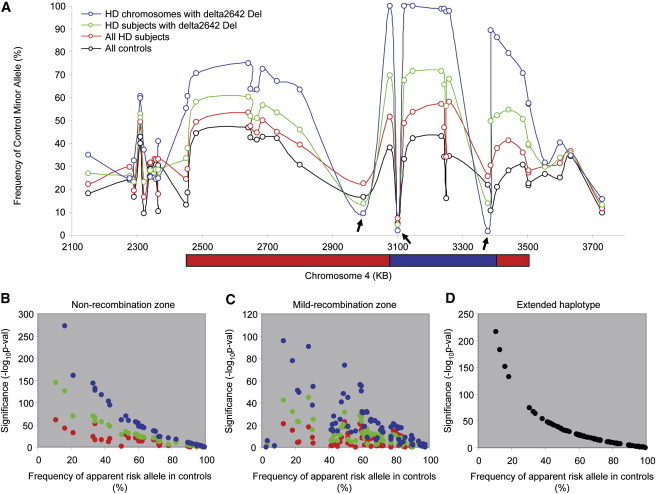
To test this hypothesis, we investigated the relationship between control minor-allele frequencies and the significance of the association signals across the region. In order to discern patterns of recombination across the region as reflected in the major HD haplotype (Figure 4A), we used those SNPs whose minor alleles were significantly overrepresented in HD subjects as compared to controls (p < 0.05 in the original association analysis). We calculated the minor-allele frequency in controls (black) and the frequency of the same allele in HD subjects (red), in HD subjects with the minor (deletion) allele for delta2642 (green), and on HD-mutation-bearing chromosomes with the minor allele for delta2642 (blue). Grouping in this way provided a gradual enrichment for HD-mutation-bearing chromosomes with the major HD haplotype. For example, ∼25.8% of all chromosomes in HD subjects (red), ∼50% of all chromosomes in those HD subjects with a delta2642 deletion (green), and close to 100% of HD chromosomes that themselves had a delta2642 deletion (blue) represented this haplotype. As shown in Figure 4A, allele frequencies for all SNP minor alleles, except rs2857845, rs363082, and rs1730768 (arrows), increased as the major HD haplotype was enriched (red to green to blue); this is consistent with our haplotyping results, which indicated that rs2857845, rs363082 and rs1730768 tag other haplotypes.
Figure 4.
Effect of Allele Frequency in Controls and Recombination on Significance in Association Analysis
To test whether allele frequency in controls plays an important role in determining significance in association analysis, we analyzed data sets that were progressively enriched for the HD major haplotype.
(A) For each marker, the allele frequency of that allele which is minor in the control population was plotted against its genomic location in the following groups: (1) all controls (1676 controls; black), (2) all cases (699 HD subjects; red), (3) cases with at least one delta2642 deletion allele (384 HD subjects; green), and (4) HD mutation-bearing chromosomes with a delta2642 deletion allele (362 chromosomes; blue). To simplify the analysis, we show those SNPs whose minor allele was overrepresented in HD subjects versus controls in the original association analysis (p < 0.05; 41 SNPs). The boundaries of “nonrecombination” (blue) and “mild recombination” (red) zones represent arbitrary cut-offs (80% and 50%, respectively) based on allele frequency on HD-mutation-bearing chromosomes.
(B) Association analyses were performed for all SNPs in the nonrecombination zone; each of the enrichment groups from (A) was compared to controls (allele test). The significance of the apparent HD risk alleles (overrepresented in HD compared to controls; p < 0.05 in the original dominant model association analysis involving all HD subjects and controls) (y axis) was plotted against the corresponding allele frequency in controls (x axis).
(C) Association analyses were performed for all SNPs in the mild recombination zone; each of the enrichment groups from (A) was compared to controls (allele test). The significance of the apparent HD risk alleles (y axis) was plotted against the corresponding allele frequency in controls (x axis).
(D) To eliminate the effect of recombination, we performed an association analysis (allele test) by comparing allele frequencies of all SNPs on the HD-mutation-bearing chromosomes with Ext_Hap_1 to their allele frequencies on control chromosomes. Significance (y axis) was plotted against frequency of apparent risk allele (x axis).
On the basis of the apparent decay in the major HD haplotype (i.e., Figure 4A, blue trace, excluding rs363082), we arbitrarily divided the chromosome 4p region into a relative “nonrecombination” zone (control minor allele present on >80% of HD major haplotype chromosomes; blue bar) and a relative “mild recombination” zone (control minor allele present on >50% but <80% of HD major-haplotype chromosomes; red bars). In both zones, we then tested SNP markers within each of the haplotype-enrichment groups separately for an association with HD. We tested the following groups: (1) all controls versus all cases (red); (2) all controls versus only those cases with a delta2642 deletion allele (green); and (3) all control chromosomes versus only those chromosomes bearing a HD mutation and having a delta2642 deletion allele (blue) (Figures 4B and 4C). In the nonrecombination zone (118 kb), we observed a strong negative correlation between the frequency of a SNP's apparent risk allele (i.e., the allele increased in HD subjects) in controls and the significance of association with that SNP. The correlation became progressively stronger as the sample was enriched for the major HD haplotype (red to green to blue), supporting the notion that the control allele frequency plays an important role in creating synthetic associations (Figure 4B). In the mild recombination zone (938 kb, excluding the 118 kb nonrecombination zone), we used only SNPs that showed nominally significant differences between HD subjects and controls in the original association analysis (dominant-model p value < 0.05) because inclusion of nonsignificant SNPs would add noise to the analysis and complicate interpretation. Similarly to the nonrecombination region findings, we observed a negative correlation between control minor-allele frequency and association significance, although the significance values were considerably lower than those achieved in the nonrecombination zone at a similar control allele frequency, suggesting a strong effect of recombinational decay of the major HD haplotype (Figure 4C). Taken together, these results imply that the control minor-allele frequency and the recombination frequency, rather than physical distance between the SNP and the causative defect, play important roles in determining synthetic associations.
To confirm this conclusion, we compared the subset of major-haplotype HD chromosomes that shared the entire extended haplotype of 938 kb from rs11248108 to rs12641989 to control chromosomes. This permitted us to compare the strength of association across SNPs without encountering any effect of recombination. As shown in Figure 4D, markers across this segment showed a smooth inverse relationship between the strength of association and allele frequency on control chromosomes, confirming the notion that control minor-allele frequency plays a critical role in synthetic associations. Together, our results strongly indicate that synthetic association signals in HD were contributed by a combination of a frequent, extended HD haplotype in cases and the inclusion of markers with relatively low minor-allele frequencies in the genotyping array of controls.
Discussion
The results of the case-control SNP association analysis of HD and the subsequent HTT-region haplotype analysis that we performed here, taken in historical context, have implications for applying the approach to chromosomal localization and identification of other strong-effect human genetic defects. The approach might be particularly useful for relatively rare phenotypes that result in small family sizes, which preclude effective linkage analysis, and for founder mutations that contribute only a subset of cases for a phenotype of diverse etiology. The genetic defect causing HD was identified almost two decades ago when our knowledge of human genetic variation was far less evolved and the technologies for performing human genetic studies were far less powerful than they are today. Its identification came after genetic linkage mapping, first with restriction-fragment length polymorphisms, and subsequently with PCR-based multi-allele markers, in HD-affected families confined the disease mutation to a region of 2.2 Mb in 4p16.3.1,20 This candidate region was then narrowed by association analysis, in which the biallelic markers presented the apparent quandary of closely spaced polymorphisms that alternatively showed either strong or no evidence for association. The conundrum was explained by the power of the multiallele markers to resolve multiple ancestral haplotypes, a particularly frequent one of which was marked by the minor deletion allele of a 3 bp in/del polymorphism (delta2642) that ultimately proved to represent a codon in HTT.16,19,21 The comparison of markers on HD chromosomes bearing this minor allele focused the search for the genetic defect to a 150 kb segment with the HTT CAG repeat and led to its identification.
Not unexpectedly, the data generated from our current analysis indicate that a case-control genome-wide SNP-association approach could have quickly accomplished the initial mapping of the HD genetic defect to 4p16.3 and that it could have done so with as few as 50 unrelated HD cases and 1,600 controls, despite the presence of multiple founder chromosomes. However, the analysis of individual SNPs would not have finely localized the CAG mutation; the most significantly associated marker is in RGS12, 343 kb from the defect. It should also be noted that application of current whole-exome or even whole-genome next-generation sequencing strategies would not have identified the HD mutation because sizing even longer normal alleles is problematic with short-read technologies. Thus, like the multi-allele-marker haplotype analysis that actually led to the identification of the expanded CAG repeat, SNP-based haplotype analysis would have been required to home in on the defect after the initial association analysis placed it in region 4p16.3. rs12641989 yielded the strongest association signal because it was present on the most frequent ancestral HD haplotype, it had a low minor-allele frequency in the control population, there was a low recombination rate across this region, and this low recombination rate allowed an extended shared haplotype. Our data strongly suggest that SNP arrays aimed at genotyping markers with even lower control minor-allele frequencies would be yet more powerful for initial chromosomal localization of founder mutations. However, because a defect localized by association with a rare allele might be at a considerable physical distance from the marker, subsequent identification of the actual defect could benefit from detailed haplotype analysis that takes into account the local recombination landscape. The same argument can be made for phenotypic associations linked to genomic segments introduced into a population by admixture or to phenotypes where only a minor proportion of cases are due to a founder mutation. Indeed, case-control simulations indicate that for a SNP with a control minor-allele frequency of 0.01, a founder haplotype bearing such an allele need be present in less than 60 cases in 1,000 or 100 cases in 5,000 to yield genome-wide significance (p < 5 × 10⁻⁸; Figure S3).
Our SNP haplotype analysis of the HTT region, which extends previous lower-resolution investigations, is revealing with regard to the structure of the HD population. The studies that led to the identification of the CAG expansion mutation investigated only 78 HD chromosomes without regard to population ancestry and identified 26 different haplotypes, although these involved markers widely dispersed over the large 2.5 Mb HD candidate region then defined by recombination events in families. There was far less diversity in the immediate region of the mutation: Approximately one-third of chromosomes shared a common set of alleles, including the deletion allele at HTT codon 2642. More recently, Warby et al.13 identified 22 HTT SNPs that permitted the definition of a haplogroup representing 95% of 268 HD European chromosomes. However, their analysis allowed for diversity at many additional intervening SNPs within HTT, indicating that this single haplogroup combines multiple HTT haplotypes. Though the analysis here was also restricted to individuals of European ancestry, the delineation of multiple dense SNP haplotypes spanning the HD mutation is most consistent with multiple independent origins of the HD-mutation-bearing chromosomes in this population.
The seven most abundant HTT-region haplotypes constituted 582 of the 699 chromosomes, whereas the remaining 117 HD-mutation-bearing chromosomes accounted for 48 additional haplotypes (HTT_Hap_Other). Although many of these haplotypes, such as HTT_Hap_1 and HTT_Hap_5, might be derived from one another by historical crossovers, it seems likely that there have been a minimum of four founder events given that there are HD-mutation-bearing chromosomes representing all four two-marker haplotypes for SNPs rs2798296 and rs3856973, which flank the CAG repeat (A-A, four in HTT_Hap_Other; A-G, HTT_Hap_3 and ten in HTT_Hap_Other; G-A, HTT_Hap_4 and three in HTT_Hap_Other; G-G, HTT_Hap_1, HTT_Hap_2, HTT_Hap_5, HTT_Hap_6, HTT_Hap_7, and 31 in HTT_Hap_Other).
Despite this diversity, one founder event accounts for about half of all these European HD chromosomes (HTT_Hap_1 and probably the derivative HTT_Hap_5). It corresponds with the most frequent HD haplotype defined in earlier studies given that it is marked by the delta2642 deletion allele. Of the most frequent HD haplotypes, HTT_Hap_2 and HTT_Hap_3 show little or no increase in frequency relative to control chromosomes, whereas HTT_Hap_1 shows an increase of more than 5-fold. Interestingly, almost 50% of the HTT_Hap_1 HD-mutation-bearing chromosomes share an identical SNP haplotype that reaches far beyond the confines of HTT and extends over at least 938 kb, reflecting the relatively low recombination rate across this segment and reinforcing the view that many of the other observed haplotypes represent independently originating HD mutations. This pattern also fits predictions that are based on the analysis of reproductive success in HD.22
Delineation of the haplotype structure of the 4p16.3 segment has permitted us to test for cis-acting modifiers of HD pathogenesis. For the seven most abundant HTT haplotypes, we observed no significant difference in the distribution of expanded CAG repeats, indicating that at least for the substantial majority of HD chromosomes, there is no evident effect of local variation on the instability of the expanded CAG repeat. Previous analysis suggested enrichment of a particular haplogroup on both HD chromosomes and control chromosomes with CAG repeats high in the normal range, raising the possibility that this haplogroup is predisposed to instability.13 The low frequency of this haplogroup among East Asians has been proposed as the basis for the lower prevalence of HD in this population relative to Europeans.23 Our data are not directly comparable to the haplogroup analyses, but the lack of an effect of local haplotype on instability within the expanded CAG allele range does not preclude an effect within the high normal HD range. Similarly, although we cannot speak to the CAG allele distribution on the control chromosomes used here, it is likely that the HD_Hap_1 haplotype in the normal population is associated with higher-range normal alleles that act as a reservoir of new mutations to HD because such high normal alleles might be more likely to expand into the HD range. Indeed, we have previously noted that the major haplotype defined by the delta2642 deletion allele marks chromosomes that gave rise to sporadic cases of HD in “new mutation” families, indicating that the current pool of HTT_Hap_1 HD cases is descended from multiple normal individuals who transmitted a newly expanded allele on this haplotype.24
The detailed haplotype analysis also provided the basis for testing the hypothesis that local genetic variation modifies HD pathogenesis through either a cis- or a trans-acting effect on HTT expression. Neither the extended shared haplotype nor the seven most abundant HTT haplotypes on HD-mutation-bearing chromosomes showed evidence of influencing age at the onset of motor symptoms after the effect of the expanded CAG repeat length, which is the main driver of pathogenesis, was taken into account. Similarly, the HTT haplotypes on the normal chromosomes present in HD subjects showed no evidence of an impact on the age at onset, consistent with the previous finding that neither the length of the normal CAG allele nor the presence of a second expanded CAG allele has a significant impact on the rate of pathogenesis leading to the onset of motor symptoms.7 Although it is conceivable that the local HTT haplotype might still influence some other HD phenotype, the age at the onset of motor symptoms correlates strongly with the length of the expanded CAG allele and shows evidence of being altered by one or more modifier genes.
Our study also does not exclude the possibility that one or more rare haplotypes among the HD_Hap_Other grouping does involve a cis-modifier effect on either CAG repeat instability or the age at the onset of motor symptoms or that a rare <2% frequency control haplotype might exert a trans effect. However, our findings do indicate that no such effects occur in most HD subjects, and they suggest instead that the emphasis should be on identifying trans-acting modifiers located elsewhere in the genome. The ability to attribute the full effect of the HTT locus to the length of the expanded CAG repeat, without having to consider other genetic variation at the locus, will facilitate the analysis of genome-wide association scans aimed at identifying such modifier genes; such analysis is a high priority in HD because valid targets for therapeutic intervention are badly needed.
Acknowledgments
We thank the HD research participants and their families, who made this work possible; the Harvard Brain Tissue Resource Center; the COHORT Study of the Huntington Study Group; and the Myocardial Infarction Genetics Consortium (MIGen) study, which was funded by grants from the U.S. National Institutes of Health and National Heart, Lung, and Blood Institute's STAMPEED genomics research program (R01 HL087676) and the National Center for Research Resources (U54 RR020278). We also thank investigators and contributors to the HD-MAPS study: Alexandra Durr, Adam Rosenblatt, Luigi Frati, Susan Perlman, P. Michael Conneally, Mary Lou Klimek, Melissa Diggin, Tiffany Hadzi, and Ayana Duckett. This work was supported by grants from the National Institute of Neurological Disorders and Stroke (NS16367) (Huntington's Disease Center Without Walls) and NS32765, the CHDI Foundation, and the Huntington's Disease Society of America's Coalition for the Cure. E.M.R. received a scholarship from the Fundação para a Ciência e a Tecnologia of Portugal (SFRH/BD/44335/2008).
Supplemental Data
Web Resources
The URLs for data presented herein are as follows:
International HapMap Project, http://hapmap.ncbi.nlm.nih.gov/
MACh Home Page, http://www.sph.umich.edu/csg/abecasis/MACH/index.html
Online Mendelian Inheritance in Man (OMIM), http://www.omim.org/
References
- 1.Gusella J.F., Wexler N.S., Conneally P.M., Naylor S.L., Anderson M.A., Tanzi R.E., Watkins P.C., Ottina K., Wallace M.R., Sakaguchi A.Y. A polymorphic DNA marker genetically linked to Huntington's disease. Nature. 1983;306:234–238. doi: 10.1038/306234a0. [DOI] [PubMed] [Google Scholar]
- 2.The Huntington's Disease Collaborative Research Group A novel gene containing a trinucleotide repeat that is expanded and unstable on Huntington's disease chromosomes. Cell. 1993;72:971–983. doi: 10.1016/0092-8674(93)90585-e. [DOI] [PubMed] [Google Scholar]
- 3.Andrew S.E., Goldberg Y.P., Kremer B., Telenius H., Theilmann J., Adam S., Starr E., Squitieri F., Lin B., Kalchman M.A. The relationship between trinucleotide (CAG) repeat length and clinical features of Huntington's disease. Nat. Genet. 1993;4:398–403. doi: 10.1038/ng0893-398. [DOI] [PubMed] [Google Scholar]
- 4.Duyao M., Ambrose C., Myers R., Novelletto A., Persichetti F., Frontali M., Folstein S., Ross C., Franz M., Abbott M. Trinucleotide repeat length instability and age of onset in Huntington's disease. Nat. Genet. 1993;4:387–392. doi: 10.1038/ng0893-387. [DOI] [PubMed] [Google Scholar]
- 5.Persichetti F., Srinidhi J., Kanaley L., Ge P., Myers R.H., D'Arrigo K., Barnes G.T., MacDonald M.E., Vonsattel J.P., Gusella J.F. Huntington's disease CAG trinucleotide repeats in pathologically confirmed post-mortem brains. Neurobiol. Dis. 1994;1:159–166. doi: 10.1006/nbdi.1994.0019. [DOI] [PubMed] [Google Scholar]
- 6.Snell R.G., MacMillan J.C., Cheadle J.P., Fenton I., Lazarou L.P., Davies P., MacDonald M.E., Gusella J.F., Harper P.S., Shaw D.J. Relationship between trinucleotide repeat expansion and phenotypic variation in Huntington's disease. Nat. Genet. 1993;4:393–397. doi: 10.1038/ng0893-393. [DOI] [PubMed] [Google Scholar]
- 7.Lee J.M., Ramos E.M., Lee J.H., Gillis T., Mysore J.S., Hayden M.R., Warby S.C., Morrison P., Nance M., Ross C.A. CAG repeat expansion in Huntington disease determines age at onset in a fully dominant fashion. Neurology. 2012 doi: 10.1212/WNL.0b013e318249f683. in press. Published online February 8, 2012. [DOI] [PMC free article] [PubMed] [Google Scholar]
- 8.Djoussé L., Knowlton B., Hayden M., Almqvist E.W., Brinkman R., Ross C., Margolis R., Rosenblatt A., Durr A., Dode C. Interaction of normal and expanded CAG repeat sizes influences age at onset of Huntington disease. Am. J. Med. Genet. A. 2003;119A:279–282. doi: 10.1002/ajmg.a.20190. [DOI] [PubMed] [Google Scholar]
- 9.Li J.L., Hayden M.R., Warby S.C., Durr A., Morrison P.J., Nance M., Ross C.A., Margolis R.L., Rosenblatt A., Squitieri F. Genome-wide significance for a modifier of age at neurological onset in Huntington's disease at 6q23-24: the HD MAPS study. BMC Med. Genet. 2006;7:71. doi: 10.1186/1471-2350-7-71. [DOI] [PMC free article] [PubMed] [Google Scholar]
- 10.Wexler N.S., Lorimer J., Porter J., Gomez F., Moskowitz C., Shackell E., Marder K., Penchaszadeh G., Roberts S.A., Gayán J., U.S.-Venezuela Collaborative Research Project Venezuelan kindreds reveal that genetic and environmental factors modulate Huntington's disease age of onset. Proc. Natl. Acad. Sci. USA. 2004;101:3498–3503. doi: 10.1073/pnas.0308679101. [DOI] [PMC free article] [PubMed] [Google Scholar]
- 11.Farrer L.A., Cupples L.A., Wiater P., Conneally P.M., Gusella J.F., Myers R.H. The normal Huntington disease (HD) allele, or a closely linked gene, influences age at onset of HD. Am. J. Hum. Genet. 1993;53:125–130. [PMC free article] [PubMed] [Google Scholar]
- 12.Djoussé L., Knowlton B., Hayden M.R., Almqvist E.W., Brinkman R.R., Ross C.A., Margolis R.L., Rosenblatt A., Durr A., Dode C. Evidence for a modifier of onset age in Huntington disease linked to the HD gene in 4p16. Neurogenetics. 2004;5:109–114. doi: 10.1007/s10048-004-0175-2. [DOI] [PMC free article] [PubMed] [Google Scholar]
- 13.Warby S.C., Montpetit A., Hayden A.R., Carroll J.B., Butland S.L., Visscher H., Collins J.A., Semaka A., Hudson T.J., Hayden M.R. CAG expansion in the Huntington disease gene is associated with a specific and targetable predisposing haplogroup. Am. J. Hum. Genet. 2009;84:351–366. doi: 10.1016/j.ajhg.2009.02.003. [DOI] [PMC free article] [PubMed] [Google Scholar]
- 14.Kathiresan S., Voight B.F., Purcell S., Musunuru K., Ardissino D., Mannucci P.M., Anand S., Engert J.C., Samani N.J., Schunkert H., Myocardial Infarction Genetics Consortium. Wellcome Trust Case Control Consortium Genome-wide association of early-onset myocardial infarction with single nucleotide polymorphisms and copy number variants. Nat. Genet. 2009;41:334–341. doi: 10.1038/ng.327. [DOI] [PMC free article] [PubMed] [Google Scholar]
- 15.Purcell S., Neale B., Todd-Brown K., Thomas L., Ferreira M.A., Bender D., Maller J., Sklar P., de Bakker P.I., Daly M.J., Sham P.C. PLINK: a tool set for whole-genome association and population-based linkage analyses. Am. J. Hum. Genet. 2007;81:559–575. doi: 10.1086/519795. [DOI] [PMC free article] [PubMed] [Google Scholar]
- 16.Ambrose C.M., Duyao M.P., Barnes G., Bates G.P., Lin C.S., Srinidhi J., Baxendale S., Hummerich H., Lehrach H., Altherr M. Structure and expression of the Huntington's disease gene: evidence against simple inactivation due to an expanded CAG repeat. Somat. Cell Mol. Genet. 1994;20:27–38. doi: 10.1007/BF02257483. [DOI] [PubMed] [Google Scholar]
- 17.Dickson S.P., Wang K., Krantz I., Hakonarson H., Goldstein D.B. Rare variants create synthetic genome-wide associations. PLoS Biol. 2010;8:e1000294. doi: 10.1371/journal.pbio.1000294. [DOI] [PMC free article] [PubMed] [Google Scholar]
- 18.Goldstein D.B. Common genetic variation and human traits. N. Engl. J. Med. 2009;360:1696–1698. doi: 10.1056/NEJMp0806284. [DOI] [PubMed] [Google Scholar]
- 19.MacDonald M.E., Novelletto A., Lin C., Tagle D., Barnes G., Bates G., Taylor S., Allitto B., Altherr M., Myers R. The Huntington's disease candidate region exhibits many different haplotypes. Nat. Genet. 1992;1:99–103. doi: 10.1038/ng0592-99. [DOI] [PubMed] [Google Scholar]
- 20.MacDonald M.E., Haines J.L., Zimmer M., Cheng S.V., Youngman S., Whaley W.L., Wexler N., Bucan M., Allitto B.A., Smith B. Recombination events suggest potential sites for the Huntington's disease gene. Neuron. 1989;3:183–190. doi: 10.1016/0896-6273(89)90031-7. [DOI] [PubMed] [Google Scholar]
- 21.MacDonald M.E., Lin C., Srinidhi L., Bates G., Altherr M., Whaley W.L., Lehrach H., Wasmuth J., Gusella J.F. Complex patterns of linkage disequilibrium in the Huntington disease region. Am. J. Hum. Genet. 1991;49:723–734. [PMC free article] [PubMed] [Google Scholar]
- 22.Frontali M., Sabbadini G., Novelletto A., Jodice C., Naso F., Spadaro M., Giunti P., Jacopini A.G., Veneziano L., Mantuano E. Genetic fitness in Huntington's Disease and Spinocerebellar Ataxia 1: a population genetics model for CAG repeat expansions. Ann. Hum. Genet. 1996;60:423–435. doi: 10.1111/j.1469-1809.1996.tb00440.x. [DOI] [PubMed] [Google Scholar]
- 23.Warby S.C., Visscher H., Collins J.A., Doty C.N., Carter C., Butland S.L., Hayden A.R., Kanazawa I., Ross C.J., Hayden M.R. HTT haplotypes contribute to differences in Huntington disease prevalence between Europe and East Asia. Eur. J. Hum. Genet. 2011;19:561–566. doi: 10.1038/ejhg.2010.229. [DOI] [PMC free article] [PubMed] [Google Scholar]
- 24.Myers R.H., MacDonald M.E., Koroshetz W.J., Duyao M.P., Ambrose C.M., Taylor S.A., Barnes G., Srinidhi J., Lin C.S., Whaley W.L. De novo expansion of a (CAG)n repeat in sporadic Huntington's disease. Nat. Genet. 1993;5:168–173. doi: 10.1038/ng1093-168. [DOI] [PubMed] [Google Scholar]
Associated Data
This section collects any data citations, data availability statements, or supplementary materials included in this article.