

Abstract
To identify genetic factors contributing to type 2 diabetes (T2D), we performed large-scale meta-analyses by using a custom ∼50,000 SNP genotyping array (the ITMAT-Broad-CARe array) with ∼2000 candidate genes in 39 multiethnic population-based studies, case-control studies, and clinical trials totaling 17,418 cases and 70,298 controls. First, meta-analysis of 25 studies comprising 14,073 cases and 57,489 controls of European descent confirmed eight established T2D loci at genome-wide significance. In silico follow-up analysis of putative association signals found in independent genome-wide association studies (including 8,130 cases and 38,987 controls) performed by the DIAGRAM consortium identified a T2D locus at genome-wide significance (GATAD2A/CILP2/PBX4; p = 5.7 × 10⁻⁹) and two loci exceeding study-wide significance (SREBF1, and TH/INS; p < 2.4 × 10⁻⁶). Second, meta-analyses of 1,986 cases and 7,695 controls from eight African-American studies identified study-wide-significant (p = 2.4 × 10⁻⁷) variants in HMGA2 and replicated variants in TCF7L2 (p = 5.1 × 10⁻¹⁵). Third, conditional analysis revealed multiple known and novel independent signals within five T2D-associated genes in samples of European ancestry and within HMGA2 in African-American samples. Fourth, a multiethnic meta-analysis of all 39 studies identified T2D-associated variants in BCL2 (p = 2.1 × 10⁻⁸). Finally, a composite genetic score of SNPs from new and established T2D signals was significantly associated with increased risk of diabetes in African-American, Hispanic, and Asian populations. In summary, large-scale meta-analysis involving a dense gene-centric approach has uncovered additional loci and variants that contribute to T2D risk and suggests substantial overlap of T2D association signals across multiple ethnic groups.
Introduction
Type 2 Diabetes (T2D [MIM 125853]) is a complex disease caused by multiple genetic and environmental factors; heritability is estimated at 22%–73% from twin and family studies.1–5 The age-adjusted prevalence of T2D in adults has recently been estimated at 7.6% in European Americans, 14.9% in non-Hispanic African Americans, 4.3%–8.2% in Asian Americans, and 10.9%–15.6% in Hispanics.6–9 Researchers have identified more than 40 T2D-associated genetic loci, but these loci have been revealed primarily on the basis of studies of individuals of European ancestry. Candidate-gene association studies discovered association between T2D and missense variants in PPARG (MIM 601487) and KCNJ11 (MIM 600937), which are targets for antidiabetic medications, and implicated common genetic variants responsible for Mendelian forms of diabetes in T2D (e.g., such variants include those in the Wolfram-syndrome-associated locus WFS1 [MIM 606201], those in HNF1A [MIM 142410] and HNF4A [MIM 600281], and those in genes involved in maturity-onset diabetes of the young [MODY (MIM 125851)]10–15). Association testing near a linkage peak identified common variants in TCF7L2 (MIM 602228), which remains the strongest signal for T2D and replicates robustly across many,16 but not all, ethnic groups.17 Early genome-wide association studies (GWASs) for T2D18–22 and fasting glucose23 successfully identified multiple loci. Recent meta-analyses of GWASs of T2D24 and glycemic quantitative traits25 have dramatically increased the number of genome-wide-significant T2D-associated loci in European populations; most of these variants act through defects in beta-cell function rather than insulin action. Together, variants known to be associated with T2D explain ∼10% of the genetic variance,24,26 indicating that additional loci and independent signals in established loci are likely to contribute to disease risk.
Genetic contributors to T2D are less well understood in non-European populations. One novel locus (KCNQ1 [MIM 607542]) was identified on the basis of a GWAS in a Japanese population27,28 and has subsequently been shown to harbor independent alleles in individuals of European descent.24 More recently, GWASs in Chinese,29,30 Japanese,31 and South Asian populations32 describe additional T2D loci surpassing genome-wide significance. To date, T2D GWASs in African-Americans have been underpowered to detect novel loci.33
An important first step toward understanding genetic risk across populations is to establish whether known T2D association signals span ethnicities or are population specific. Consistent association of T2D risk variants discovered in Europeans was reported in a multiethnic case-control study of five US populations,34 in studies of Chinese,30 Japanese,31 Hispanic35 and South Asian32 populations, and in a study focusing on fasting glucose in an African-American36 population, despite possible differences in linkage disequilibrium (LD) between marker and causal variants in each population. Indeed, multiethnic differences in regional LD help with refinement of association signals and can distinguish causal variants from correlated markers.33,37 Furthermore, independent association signals in the same gene (for example, KCNQ1) in different ethnicities could be useful for pinpointing genes that harbor causal mutations. Recent power analyses suggest that large-scale multiethnic association studies might have greater statistical power to detect causal alleles because random genetic drift can elevate global risk variants to a higher allele frequency in different populations.38
The 50K SNP Human CVD beadchip, or ITMAT-Broad-CARe (IBC) array, captures genetic diversity across more than 2,000 candidate gene regions related to cardiovascular, inflammatory, and metabolic phenotypes, and a large portion of loci are captured with marker density equal to or greater than that found by GWAS.39 SNPs were selected on the basis of the International HapMap Consortium and publically available resequencing data such as those from the SeattleSNPs and National Institute of Environmental Health Sciences (NIEHS) SNPs consortia. The focus was on the inclusion of rare variants and variants with a high likelihood of functionality. More than 5,000 SNPs from 49 candidate genes (Table S1, available online) were specifically selected on the basis of prior evidence of a role in Mendelian forms of diabetes,40 diabetes patho-physiology (including insulin signaling, endocrine pathways, and energy metabolism),41 linkage studies42 and meta-analyses of T2D GWASs.18–22 GWAS efforts have identified additional loci since the design of this array; therefore, of the currently documented T2D loci, 21 candidate genes from eighteen loci and index SNPs from nine additional T2D loci were included on the array. SNP association for this array has been reported for a range of phenotypes, including those involving coronary artery disease,43,44 lipid traits,45 blood pressure,46,47 cardiomyopathy,48 blood traits49,50 and height.51
In this study we set out to discover novel T2D loci and attempted to replicate, fine map, and detect independent signals at known loci by combining T2D association results across 39 studies genotyped on the IBC array. We performed meta-analysis in individuals of European ancestry (14,073 cases, 57,489 controls), African-American ancestry (1,986 cases, 7,695 controls), Hispanic ancestry (592 cases, 1,410 controls), and Asian ancestry (767 cases, 3704 controls). Using conditional analyses, we sought to identify additional independent signals within associated loci. Finally, we assessed the concordance of direction of effect of new and established loci and a composite risk score of known loci across ethnicities.
Subjects and Methods
T2D Case and Control Definitions and Participating Studies
For the IBC meta-analyses performed here, T2D cases were defined on the basis of one of the six following criteria: (1) the American Diabetes Association criteria;52 (2) fasting (8 hr or longer fast) glucose ≥ 126 mg/dl (≥7 mmol/liter); (3) 2 hr glucose ≥ 200 mg/dl (≥11.1 mmol/liter) during an oral glucose tolerance test (OGTT); (4) use of diabetes medications; (5) nonfasting plasma glucose > 200 mg/dl, or (6) physician report or self-report of physician-diagnosed diabetes. We selected cases for an age at diagnosis or age at exam ≥25 years in order to minimize the inclusion of cases with type 1 diabetes (T1D [MIM 222100]). Glutamic acid decarboxylase (GAD) antibody status was not available in any IBC cohorts, and so we could not definitively exclude subjects with T1D or latent autoimmune diabetes of adults (LADA). Controls within each study were individuals who, on the basis of the criteria described above, were not classified as T2D cases in an exam when they were ≥25 years of age.
Clinical and genotype quality-control characteristics from the 39 datasets included in the IBC chip meta-analysis (these datasets consisted of population-based cohorts, collections of cases and controls for metabolic and cardiovascular phenotypes, and individuals collected for clinical trials) are described in Table S2.
All participating studies were required to obtain informed consent for DNA analysis and to have received approval from local institutional review boards. The individuals of European ancestry sampled in the primary analysis were independent from the subjects included in the eight component studies of the previously reported DIAGRAM GWAS meta-analysis used for in silico replication.24 GAD antibody status was available for subjects from four component GWASs of the DIAGRAM consortium, and T2D association results for each component DIAGRAM study were obtained for SNPs rs9273363 (HLA-DQB1 [MIM 604305]) and rs10770141 (TH/INS region [MIMs 191290 and 176730]) from the DIAGRAM investigators.
Genotyping and Quality Control
Genotyping in each component study of the IBC meta-analysis was performed with the IBC array.39 SNPs were clustered into genotypes with the Illumina Beadstudio software and subjected to quality-control filters at the sample and SNP levels separately within each cohort. Samples were excluded for individual call rates <90%, gender mismatch, and duplicate discordance. SNPs were removed for call rates <95% or Hardy-Weinberg equilibrium p < 10−7 in controls from each cohort (regardless of ethnicity). Because of the low-frequency SNPs included in the design and the aim to capture low-frequency variants of large effect across the large dataset, we filtered only on minor allele frequency (MAF) < 0.005.
Statistical Analyses
Evaluation of Population Stratification
For the primary meta-analysis, only individuals of European ancestry were included. Self-reported ethnicity was verified by multidimensional scaling (MDS) analysis of identity-by-state distances as implemented in PLINK; HapMap panels were included as reference standards. After SNPs in LD (r2 > 0.3) were pruned out, Eigenstrat was used for computing principal components on the subset of nonexcluded individuals for use as covariates in the regression analyses.53,54
Association Testing
We performed T2D association analysis in each study by using an additive genetic model. Our primary association analysis included adjustment for age, sex, body-mass index (BMI), study site(s), and principal components (PCs) if population structure was evident. The genomic control inflation factor, λ, was calculated in each case-control study and used for within-study correction before meta-analysis. λ ranged from 1.0 to 1.077. As the Look AHEAD study55,56 was a case-only study, we merged this dataset with 4,124 randomly selected ARIC controls of European ancestry for association analysis. After performing stringent quality control, we found limited population structure between the two datasets and a λ of 1.04. ARIC individuals used for the Look AHEAD (cases)/ARIC (controls) sample were not included in the ARIC IBC association analysis reported here (1,278 ARIC cases and 2,600 independent ARIC controls). Notably, Look AHEAD participants were obese (with an average BMI of 36.0 ± 5.9 kg/m2), and ARIC controls selected for matching were not (average BMI of 27.7 ± 5.2 kg/m2). Despite BMI adjustment, this discrepancy could lead to T2D association signals arising from SNP associations to BMI.
Meta-analyses within each ethnic group were performed by two independent analysts who used a fixed-effect inverse-variance approach in two different software packages: MANTEL and METAL.33 After association tests in each ethnicity, a multiethnic meta-analysis that included all available participants was performed. Additionally, the direction of effect of lead SNPs from previously identified loci was evaluated for consistency in African-Americans, Hispanics, and Asians.
Previous studies using the IBC array have used different significance thresholds, from p < 1 × 10⁻⁵ to p < 1 × 10−6.43, 45 To calculate an appropriate significance threshold, we used data from the Candidate Gene Association Resource (CARe) IBC array studies57 and determined that after LD was accounted for, the effective number of independent tests was ∼26,500 for African Americans and i∼20,500 for Europeans. This produces an experimental or study-wide statistical threshold of p = 1.9 × 10⁻⁶ and p = 2.4 × 10⁻⁶, respectively, if a false-positive rate of 5% is to be maintained. Consistent with the hypothesis-driven candidate gene approach taken here, we have adopted these “array-wide” or study-wide statistical thresholds for this study, but we also highlight loci significantly associated at a more conventional genome-wide-significant threshold of p < 5.0 × 10⁻⁸.
For confirmation of signals previously associated with T2D, we selected the exact SNP from the most recent discovery study or meta-analysis when possible. If the SNP was not present on the array, we selected from the IBC array a SNP that was in highest linkage disequilibrium with the previously identified SNP in the HapMap CEU (Utah residents with northern and Western European ancestry from the CEPH collection) population (this SNP was identified with the online tool SNAP). Selected SNPs and r2 to previously associated SNPs are shown in Table S1.
Conditional Analyses
Forty-six loci harboring nominally significant evidence for association (p < 1.0 × 10⁻⁴) were examined for additional signals via conditional analyses in PLINK.58 A term was added to the regression model so that the lead SNP was included as a covariate, and SNPs within the same candidate gene, or ± 200 kb if the candidate gene region was <200 kb, were evaluated for significance. Conditional analysis was performed in fifteen European and eight African-American cohorts with individual-level genotype data. We applied a locus-specific Bonferroni correction (i.e., correction for SNPs tested within the same candidate gene or within 200 kb if the candidate gene region was <200 kb) to determine the significance of independent signals within candidate genes genotyped at each locus. Table S1 shows the number of SNPs (and therefore tests) per locus on which the locus-wide significance level was based.
Genetic-Risk-Score Analyses
In eight African-American, Asian, and Hispanic cohorts from the CARe study, we generated a genetic-risk score of 27 T2D-associated SNPs (26 previously established genome-wide-significant T2D-associated SNPs and the index SNP from the GATAD2A signal from this study) weighted by the log of the OR from meta-analyses of GWASs24,25 as described previously.59 We evaluated the contribution of the weighted genetic risk score to T2D in logistic regression models adjusting for age, gender, BMI, and ten principal components and compared the relative ORs across quartiles of risk.
Results
Meta-Analysis of Samples of European Ancestry
We performed association testing for T2D status (tests included 14,073 cases and 57,489 controls) and adjusted for age, gender, BMI, and three or more PCs in 25 European IBC studies. After a fixed-effects, inverse-variance meta-analysis, independent SNPs at HLA-DQB1, SREBF1 (MIM 184756), GATAD2A/CILP2 (MIM 612419)/PBX4 (MIM 608127), BCL2 (MIM 151430), and 16 previously described loci were significantly associated with T2D at study-wide significance (p < 2.4 × 10⁻⁶), and SNPs at eight known loci surpassed the traditional genome-wide-significance threshold (p < 5.0 × 10⁻⁸; Tables 1 and 2; Figures S1A and S1B). Of the study-wide significant loci, SNPs correlated to the most significant SREBF1 polymorphism (r2 > 0.85 in HapMap CEU) have been reported previously in candidate-gene analyses60,61 but not in large-scale genomic studies with robust replication. Our sample-selection and study-design strategies are validated by study-wide-significant independent replication of 14 out of 29 previously reported T2D-associated loci present on the IBC chip (Table 2) and nominal association of 23/29 loci with a consistent direction of effect for all signals. For five T2D association signals tagged by variants on the IBC array (these signals were in or near RBMS1 [MIM 602310], CENTD2 [MIM 606646], ZFAND6 [MIM 610183], HMGA2 [MIM 600698], or HNF1A), overlapping samples from four component studies (ARIC, CCCS, FHS, and KORA) were included in the initial report,24 and therefore our results are not independent.
Table 1.
Loci Associated with T2D in Individuals of European Ancestry
|
European-Ancestry IBC Meta-Analysisa |
DIAGRAM Meta-Analysisb |
Combined European Ancestry Meta-Analysisc |
|||||||||||
|---|---|---|---|---|---|---|---|---|---|---|---|---|---|
| Chr | NCBI 36 Position | Candidate Gened | SNP | RA | RAF IBC | OR (95% CI) | p | % I2 | OR (95% CI) | p | OR (95% CI) | p | Percent I2 |
| SNPs with Study-wide Significance | |||||||||||||
| 19 | 19471596 | GATAD2A | rs3794991 | T | 0.08 | 1.14 (1.08–1.20) | 8.95 × 10⁻⁷ | 25 | 1.11 (1.04–1.17) | 1.55 × 10⁻³ | 1.12 (1.08–1.15) | 5.70 × 10⁻⁹ | 22 |
| 17 | 17662182 | SREBF1 | rs4925115 | A | 0.38 | 1.09 (1.05–1.12) | 2.04 × 10⁻⁷ | 0 | 1.04 (0.99–1.08) | 1.01 × 10⁻¹ | 1.07 (1.04–1.10) | 2.62 × 10⁻⁷ | 0 |
| 11 | 2150416 | TH/INS | rs10770141 | A | 0.39 | 1.07 (1.04–1.11) | 6.44 × 10⁻⁶ | 0 | 1.05 (1.00–1.10) | 7.08 × 10⁻² | 1.07 (1.04-1.10) | 1.57 × 10⁻⁶ | 0 |
| 18 | 58996864 | BCL2 | rs12454712 | T | 0.63 | 1.08 (1.04–1.11) | 2.29 × 10⁻⁶ | 21 | - | - | - | - | - |
| SNPs with Borderline Significancee | |||||||||||||
| 11 | 49127350 | FOLH1 | rs16906158 | C | 0.09 | 1.13 (1.07–1.19) | 8.75 × 10⁻⁶ | 32 | 1.07 (1.00–1.14) | 5.17 × 10⁻² | 1.10 (1.06–1.15) | 2.57 × 10⁻⁶ | 32 |
| 3 | 172217793 | SLC2A2 | rs11924032 | G | 0.74 | 1.08 (1.04–1.12) | 1.87 × 10⁻⁵ | 0 | 1.05 (1.00–1.10) | 3.31 × 10⁻² | 1.06 (1.04–1.10) | 2.60 × 10⁻⁶ | 0 |
| 19 | 50864118 | GIPR | rs11671664 | A | 0.11 | 1.12 (1.07–1.18) | 2.86 × 10⁻⁶ | 0 | 1.06 (0.98–1.14) | 1.71 × 10⁻¹ | 1.10 (1.06-1.15) | 2.61 × 10⁻⁶ | 0 |
| SNPs with Likely Association to LADA or Autoimmune Diabetes Componentf | |||||||||||||
| 6 | 32734250 | HLA-DQB1 | rs9273363 | A | 0.27 | 1.10 (1.06–1.14) | 7.99 × 10⁻⁸ | 17 | 1.06 (1.01–1.10) | 1.64 × 10⁻² | 1.08 (1.05–1.11) | 1.10 × 10⁻⁸ | 19 |
Abbreviations are as follows: Chr, chromosome; RA, risk allele; RAF, risk-allele frequency; OR, odds ratio; and CI confidence interval.
14,073 cases and 57,489 controls.
8,130 cases and 38,987 controls.
22,203 cases and 94,476 controls.
Candidate gene selected for testing on the array.
IBC Study-wide significance = p < 2.4 × 10⁻⁶.
See Tables S4 and S5.
Table 2.
Association Results for Known T2D Loci in Meta-Analysis of IBC Studies of European Ancestry
| Chr | Prev. Assoc. SNP | Pos (NCBI 36) | Candidate Gene | Lead SNP on IBC array | r2 to Prev. Assoc. SNP | RA | RAF IBC | OR (95% CI) | p | I2 (%) |
|---|---|---|---|---|---|---|---|---|---|---|
| 1 | rs10923931 | 120,319,482 | NOTCH2 | T | 0.10 | 1.06 (1.01–1.12) | 3.23 × 10⁻² | 21.0 | ||
| 1 | 120,239,407 | NOTCH2 | rs2641348 | 0.85 (rs10923931) | G | 0.11 | 1.06 (1.01–1.12) | 1.95 × 10⁻² | 16.0 | |
| 2 | rs780094 | 27,594,741 | GCKR | rs780094 | 0.93 (rs1260326) | C | 0.59 | 1.09 (1.05–1.12) | 2.12 × 10⁻⁷ | 43.0 |
| 2 | rs7578597 | 43,586,327 | THADA | rs7578597 | T | 0.90 | 1.16 (1.10–1.22) | 2.91 × 10⁻⁷ | 34.4 | |
| 2 | rs7593730 | 160,879,700 | RBMS1 | rs6718526 | 0.83 (rs7593730) | C | 0.79 | 1.03 (0.99–1.07) | 1.20 × 10⁻¹ | 0 |
| 3 | rs1801282 | 12,368,125 | PPARG | C | 0.88 | 1.11 (1.10–1.16) | 2.15 × 10⁻⁵ | 0 | ||
| 3 | 12,367,272 | PPARG | rs7649970 | 1 (rs1801282) | C | 0.88 | 1.11 (1.06–1.16) | 7.87 × 10⁻⁶ | 0 | |
| 3 | rs4607103 | 64,686,944 | ADAMTS9 | C | 0.74 | 1.05 (1.02–1.10) | 4.11 × 10⁻³ | 0 | ||
| 64,676,186 | ADAMTS9 | rs9860730 | 0.69 (rs4607103) | A | 0.68 | 1.05 (1.02–1.09) | 1.24 × 10⁻³ | 0 | ||
| 3 | rs1470579 | 187,011,774 | IGF2BP2 | rs1470579 | C | 0.32 | 1.14 (1.10–1.18) | 9.19 × 10⁻¹⁶ | 8.8 | |
| 4 | rs10010131 | 6,343,816 | WFS1 | G | 0.60 | 1.10 (1.01–1.20) | 3.37 × 10⁻² | 76.9 | ||
| 6,336,616 | WFS1 | rs4688985 | 0.58 (rs10010131) | G | 0.73 | 1.10 (1.05–1.14) | 2.88 × 10⁻⁷ | 34.8 | ||
| 6 | rs7754840 | 20,769,229 | CDKAL1 | C | 0.32 | 1.16 (1.12–1.20) | 4.58 × 10⁻¹⁹ | 0 | ||
| 20,794,975 | CDKAL1 | rs9368222 | 0.63 (rs7754840) | A | 0.27 | 1.18 (1.14–1.22) | 5.37 × 10⁻²¹ | 0 | ||
| 7 | rs10244051 | 15,030,358 | DGKB-TMEM195 | rs10244051 | 1 (rs2191349) | G | 0.54 | 1.04 (0.95–1.14) | 4.02 × 10⁻¹ | 55.3 |
| 7 | rs864745 | 28,147,081 | JAZF1 | rs864745 | 0.97 (rs849134) | T | 0.50 | 1.11 (1.08–1.14) | 2.22 × 10⁻⁹ | 31.3 |
| 7 | rs4607517 | 44,202,193 | GCK | A | 0.18 | 1.10 (0.98–1.23) | 1.07 × 10⁻¹ | 0 | ||
| 7 | 44,189,327 | GCK | rs1990458 | 0.18 (rs4607517) | C | 0.59 | 1.08 (1.04–1.11) | 1.67 × 10⁻⁶ | 0 | |
| 8 | rs13266634 | 118,253,964 | SLC30A8 | rs13266634 | C | 0.70 | 1.11 (1.08–1.15) | 2.49 × 10⁻⁹ | 29.5 | |
| 9 | rs10811661 | 22,124,094 | CDKN2A/B | rs10811661 | T | 0.82 | 1.19 (1.14–1.23) | 4.83 × 10⁻¹⁶ | 0 | |
| 10 | rs12779790 | 12,368,016 | CDC123/CAMK1D | rs12779790 | G | 0.18 | 1.07 (0.99–1.15) | 7.28 × 10⁻² | 4.7 | |
| 10 | rs5015480 | 94,455,539 | HHEX/IDE | rs5015480 | C | 0.60 | 1.12 (1.10–1.16) | 2.68 × 10⁻¹⁴ | 12.3 | |
| 10 | rs7903146 | 114,748,339 | TCF7L2 | rs7903146 | T | 0.30 | 1.44 (1.40–1.49) | 1.21 × 10−109 | 27.6 | |
| 11 | rs163184 | 2,803,645 | KCNQ1 | rs163184 | G | 0.48 | 1.08 (1.05–1.11) | 6.08 × 10⁻⁷ | 0 | |
| 11 | rs2237892 | 2,796,327 | KCNQ1 | rs2237892 | C | 0.94 | 1.11 (0.92–1.37) | 2.61 × 10⁻¹ | 0 | |
| 11 | rs231362 | 2,648,047 | KCNQ1 | rs231362 | G | 0.52 | 1.08 (1.04–1.11) | 5.90 × 10⁻⁶ | 3.8 | |
| 11 | rs5215 | 17,365,206 | KCNJ11 | rs5215 | 0.93 (rs5219) | C | 0.37 | 1.09 (1.06–1.13) | 1.65 × 10⁻⁸ | 15.2 |
| 11 | rs1552224 | 72,110,746 | CENTD2 region | rs613937 | 0.86 (rs1552224) | A | 0.81 | 1.08 (1.04–1.13) | 1.17 × 10⁻⁴ | 0 |
| 11 | rs10830963 | 92,348,358 | MTNR1B | rs10830963 | G | 0.30 | 1.05 (1.01–1.08) | 8.07 × 10⁻³ | 21.0 | |
| 11 | rs2943634 | 226,776,324 | IRS1 region | rs2943634 | 0.82 (rs7578326) | C | 0.67 | 1.09 (1.05–1.12) | 4.32 × 10⁻⁷ | 16.4 |
| 12 | rs7961581 | 69,949,369 | TSPAN8/LGR5 | rs7961581 | 0.87 (rs4760790) | G | 0.71 | 1.06 (1.01–1.10) | 1.57 × 10⁻² | 0 |
| 12 | 64,569,867 | HMGA2 | rs17179453 | 0.57 (rs1531343) | C | 0.09 | 1.10 (1.05–1.16) | 3.73 × 10⁻⁴ | 11.9 | |
| 12 | rs7957197 | 119,945,069 | HNF1A | rs12427353 | 0.88 (rs7957197) | G | 0.77 | 1.07 (1.03–1.12) | 4.76 × 10⁻⁴ | 0 |
| 15 | 78,200,439 | ZFAND6 | rs2903265 | 0.71 (rs11634397) | G | 0.72 | 1.01 (0.98-1.05) | 4.62 × 10⁻¹ | 4.2 | |
| 16 | rs11642841 | 52,402,988 | FTO | rs11642841 | A | 0.41 | 1.06 (1.03–1.09) | 1.78 × 10⁻⁴ | 14.8 | |
| 17 | rs4430796 | 33,172,153 | HNF1B | rs4430796 | 0.54 (rs757210) | G | 0.51 | 1.08 (1.05–1.12) | 2.48 × 10⁻⁷ | 0 |
| X | rs5945326 | 152,553,116 | DUSP9 | rs5945326 | A | 0.77 | 1.09 (1.03–1.15) | 2.53 × 10⁻³ | 0 |
The study included 14,073 cases and 57,489 controls. Abbreviations are as follows: Chr, chromosome; Prev. assoc., previously reported T2D-associated SNP; Pos, position; RA, risk allele; RAF, risk-allele frequency; OR, odds ratio; and CI, confidence interval.
In order to confirm putative novel signals, we carried out in silico follow-up analyses of 25 SNPs from previously undescribed T2D-associated signals (p < 1.0 × 10⁻⁴) in a meta-analysis of eight GWASs (n = 8,130 cases and 38,987 controls of European ancestry) from the DIAGRAM consortium.24 Combined meta-analyses of the discovery and replication studies led to genome-wide-significant signals at the GATAD2A/CILP2/PBX4 (p = 5.7 × 10⁻⁹) and HLA-DQB1 (p = 1.1 × 10⁻⁸) loci; the signal at SREBF1 remained study-wide significant, and a signal at TH/INS became study-wide significant (Table 1, Figures 1A–1D). Furthermore, 12/18 additional SNPs displayed a direction of effect consistent with our discovery dataset, suggesting that additional loci might have weaker effects that are undetectable as a result of limited statistical power (Table S3). Lead or correlated SNPs for three signals with p < 10−5 in the IBC meta-analysis at the BCL2, CDKN1B (MIM 600778), and SLC39A4 (MIM 607059) loci were not included in the DIAGRAM meta-analysis (Table S3), and these signals, as well as our study-wide-significant findings, will need independent follow-up in future studies of European ancestry.
Figure 1.
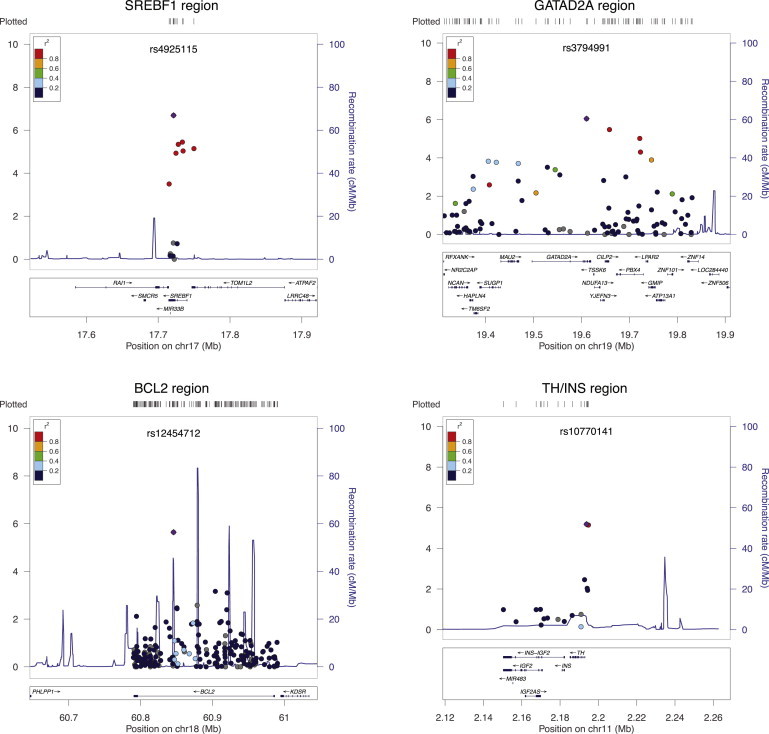
Regional Plots for T2D Loci with Study-Wide-Significant Regions in IBC Meta-Analysis of Data from Individuals with European Ancestry
Loci are shown as the lead SNP with a flanking region depicting the candidate gene and nearby genes included on the array. The purple diamond represents the lead SNP in the IBC meta-analysis, and the dots represent the surrounding SNPs; colors show the LD relationship with the lead SNP on the basis of CEU HapMap II information. –log10 p values for association with T2D are shown for each SNP (left-hand axis). Recombination rates in CEU HapMap II are shown in blue traces (right-hand axis).
The HLA-DQB1 allele has previously been demonstrated to exhibit a strong association with type 1 diabetes (odds ratio [OR] > 5.4). To determine whether the association signal observed at this locus was driven by cases with LADA, we examined association of this SNP in DIAGRAM component studies with and without exclusion of GAD-antibody-positive cases. We observed a trend toward more significant association of the SNP in meta-analysis of studies including LADA than in the study set that excluded LADA (Table S4), suggesting this signal might indeed stem from a subset of cases with autoimmune diabetes misclassified as T2D; however, this difference was not statistically significant (Phet = 0.51). To explore whether rs9273363 in HLA-DQB1 in fact represents a T1D signal, we imputed classical HLA alleles in 10,636 cases and 38,063 controls from our IBC dataset by using a reference set of 2,767 European individuals with four-digit genotype data for HLA-A (MIM 142800), HLA-B (MIM 142830), HLA-C (MIM 142840), HLA-DQA1 (MIM 146880), HLA-DQB1, HLA-DRB1 (MIM 142857), HLA-DPA1 (MIM 142880), and HLA-DPB1 (MIM 142858).62 After imputation, we tested imputed classical HLA alleles for association with T2D by using logistic regression including age, sex, BMI, study site, and three PCs as covariates. HLA-DQA1 was identified as the signal that was the most significantly associated with T2D (HLA-DQA1∗03; p = 2.8 × 10⁻⁷) and was closely followed by HLA-DRB1 (HLA-DRB1∗04; p = 3.6 × 10⁻⁷; Table S5). HLA-DQB1, HLA-DQA1, and HLA-DRB1 are major genetic determinants of T1D,63–65 suggesting that the observed association at HLA SNPs is an artifact caused by LADA pollution of our cases. We repeated association analysis conditioning on lead SNPs to identify other HLA-region loci that were associated with T2D (both rs9273363 and HLA-DQA1∗03), but we found no additional association signals.
Independent Signals at European T2D-Associated Loci
An advantage of our study over a GWAS is the inclusion of rare missense SNPs at candidate loci. Such SNPs can help identify independent T2D signals within genes at known loci. We performed regional conditional-association analyses by adjusting for lead SNPs at 46 signals with p < 10−4 in 10,636 cases and 38,063 controls of European ancestry. After Bonferroni correction for SNPs at the candidate gene locus, we found independent novel T2D signals at the PPARG, THADA (MIM 611800), and JAZF1 (MIM 606246) loci and confirmed known secondary signals at CDKN2A (MIM 600160)/CDKN2B (MIM 600431) and KCNQ122,24 (Table 3). Additionally, Table S6 shows seven locus-wide-significant signals in loci with primary associations of p < 2.5x10⁻⁴ in our study; these loci include GIPR, which was recently associated with 2 hr glucose levels during an OGTT.66
Table 3.
Loci with Significant Evidence of Independent T2D Association Signals
|
Original Results |
Conditional Results |
|||||||||
|---|---|---|---|---|---|---|---|---|---|---|
| Gene | SNP | Chr. | NCBI36 Position | Effect Allele | Freq. IBC | OR (95% CI) | p | OR (95% CI) | p | r2 with Lead SNP∗ |
| IBC European Ancestry | (14,073 cases and 57,489 controls) | (10,636 cases and 38,063 controls) | ||||||||
| CDKN2A/B | rs10811661 | 9 | 22,124,094 | C | 0.176 | 0.84 (0.81–0.88) | 4.83 × 10⁻¹⁶ | |||
| rs10757282 | 9 | 22,123,984 | C | 0.433 | 1.04 (1.01–1.08) | 2.23 × 10⁻² | 1.14 (1.10–1.18) | 2.41 × 10⁻¹⁰ | 0.36 | |
| KCNQ1 | rs163184 | 11 | 2,803,645 | G | 0.482 | 1.08 (1.05–1.11) | 6.08 × 10⁻⁷ | |||
| rs231362 | 11 | 2,648,047 | A | 0.477 | 0.93 (0.90–0.96) | 5.90 × 10⁻⁶ | 0.90 (0.87–0.94) | 1.98 × 10⁻⁷ | 0.025 | |
| PPARG | rs17036160 | 3 | 12,367,272 | T | 0.121 | 0.90 (0.86–0.94) | 7.87 × 10⁻⁶ | |||
| rs1797912 | 3 | 12,445,239 | A | 0.636 | 1.06 (1.03–1.09) | 5.48 × 10⁻⁵ | 1.08 (1.04–1.13) | 6.15 × 10⁻⁵ | 0.053 | |
| THADA | rs7578597 | 2 | 43,586,327 | C | 0.105 | 0.86 (0.82–0.91) | 2.91 × 10⁻⁷ | |||
| rs10200833 | 2 | 43,526,820 | C | 0.342 | 0.94 (0.91–0.98) | 2.63 × 10⁻³ | 0.92 (0.88–0.96) | 4.71 × 10⁻⁴ | 0.047 | |
| JAZF1 | rs864745 | 7 | 28,147,081 | C | 0.502 | 0.90 (0.88–0.93) | 2.22 × 10⁻⁹ | |||
| rs12113122 | 7 | 28,147,769 | G | 0.051 | 1.55 (1.11–2.15) | 5.13 × 10⁻² | 1.42 (1.11–1.62) | 1.21 × 10⁻² | 0.002 | |
| IBC African Americans | (1,986 cases and 7,695 controls) | (1,867 cases and 7,580 controls) | ||||||||
| HMGA2 | rs9668162 | 12 | 64,555,049 | G | 0.222 | 1.26 (1.15–1.37) | 2.41 × 10⁻⁷ | |||
| rs1042725 | 12 | 64,644,614 | T | 0.38 | 1.08 (1.00–1.16) | 3.76 × 10⁻² | 1.14 (1.06–1.24) | 0.00299 | 0.046 | |
T2D Meta-Analysis in Multiethnic Populations
We next performed meta-analysis across IBC-array T2D-association results independently in eight African-American studies (1,986 cases, 7,695 controls), three Hispanic-Latino studies (592 cases, 1,410 controls), and three Asian studies (767 cases, 3704 controls). Although these analyses were underpowered to detect novel loci at genome-wide significance in these populations, we could evaluate the contribution of known and identified T2D loci to disease risk across ethnicities (Table S7).
In African Americans, study-wide significant association was observed for SNPs within TCF7L2 (rs7903146 p = 5.1 × 10⁻¹⁵) and within HMGA2 (rs9668162 p = 2.4 × 10⁻⁷; Table S7). HMGA2 encodes a transcriptional regulator of IGF2BP2 (MIM 608289), a gene known to be associated with T2D, and a T2D-associated signal ∼43 kb upstream of HMGA2 was recently described in a European GWAS meta-analysis performed by the DIAGRAM consortium (r2 = 0.005 in CEU, r2 = 0.35 in YRI [Yoruba in Ibadan, Nigeria] to best European SNP;24). Because our array coverage was limited to the HMGA2 region, we cannot confirm whether the African-American signal observed is independent from the previously reported HMGA2 signal in Europeans; however, conditional analysis in African-American studies revealed two locus-wide-significant associations (Table 3).
We further investigated whether the African-American meta-analysis could refine localization of known T2D-associated signals on the basis of differential LD or reveal novel independent signals within genes known to be associated with T2D. Three suggestive missense association signals were identified for evaluation in future case-control association studies. These signals included (1) rs34150427 in KCNQ1 (V648I/V521I; MAF 0.02; p = 6 × 10⁻⁵), which was absent in Europeans; (2) rs1801208 in WFS1 (R456H; MAF 0.04; p = 0.001); and (3) rs16889462 in SLC30A8 (MIM 611145), a SNP adjacent to known T2D-associated SNP rs13266634, which alters codon R324 (MAF = 0.10; p = 0.017) and was rare in Europeans (MAF = 0.02, p = 0.28; Figures S2A–S2C).
In a multiethnic meta-analysis of all available IBC case-control samples, 14 loci retained study-wide significance (Table S7), and a variant in BCL2 attained genome-wide significance (rs12454712T OR = 1.09 [95% confidence interval (CI): 1.05–1.11], p = 2.1 × 10⁻⁸). Concordance in direction of effect was observed for 27 of 40 T2D association signals between Europeans and African Americans (p = 0.011). Thirty-two SNPs were concordant in direction of effect between Europeans and Hispanics (p = 7.0 × 10⁻⁵), and 27 SNPs were concordant between Europeans and Asians (p = 0.011). A total of 17 out of 40 SNPs were concordant across all four ethnic groups. A combined genetic risk score, comprising 26 previously described, robustly T2D-associated variants (listed in Table S1) and the genome-wide-significant GATAD2A-region signal discovered in this study, demonstrated a significant per-allele risk effect in African-American (OR = 1.06 [95% CI: 1.04–1.08]; p < 10−10), Hispanic (OR = 1.07 [95% CI: 1.03–1.12]; p < 10−3), and Asian cohorts (OR = 1.12 [95% CI: 1.04–1.22]; p < 10−3) from the CARe study (Table 4), suggesting overlap of causal T2D risk alleles across multiple ethnic groups.
Table 4.
Prediction of Risk of T2D in CARe African-American, Hispanic, and Asian Populations via a Weighted Genetic Score of 27 T2D Variants
| African-American | Hispanics | Asians | |
|---|---|---|---|
| Additive Risk per Allele | |||
| N (cases/controls) | 1801/7253 | 297/874 | 109/529 |
| OR (95% CI) | 1.06 (1.04–1.08) | 1.07 (1.03–1.12) | 1.12 (1.04–1.22) |
| p | 1.07 × 10⁻¹⁰ | 0.0021 | 0.0047 |
| Quartiles of Risk Alleles | |||
| Q1 OR (95% CI) | 1.00 (ref) | 1.00 (ref) | 1.00 (ref) |
| Q2 OR (95% CI) | 1.13 (0.96–1.33) | 1.06 (0.69–1.61) | 1.77 (0.88–3.57) |
| p | 0.14 | 0.802 | 0.114 |
| Q3 OR (95% CI) | 1.45 (1.24–1.70) | 1.28 (0.85–1.94) | 1.64 (0.81–3.33) |
| p | 5.01 × 10⁻⁶ | 0.24 | 0.17 |
| Q4 OR (95% CI) | 1.53 (1.31–1.80) | 1.69 (1.12–2.57) | 2.63 (1.37–5.05) |
| p | 1.90 × 10⁻⁷ | 0.013 | 0.0035 |
The 27 T2D variants on the IBC chip include 26 T2D-associated variants in Table S1 and the lead
SNP in the GATAD2A region. p = 0.34 for heterogeneity of allelic effects across ethnic groups.
Discussion
This study reports a large meta-analysis of T2D-candidate-gene association studies and has identified three additional diabetes-associated loci, verified known T2D-associated loci, and uncovered multiple independent T2D association signals, demonstrating the power of large collaborative approaches to uncover genetic insights in T2D. Furthermore, we have evaluated the impact of established T2D risk variants on risk of T2D in multiethnic populations.
Samples were assembled primarily through population-based studies and clinical trials; only one study (Look AHEAD) solely recruited T2D cases. As a validation of samples included in this study, 22 of 25 studies of European ancestry showed the expected association of TCF7L2 SNPs at p < 0.05 in the expected direction (Table S8), and 25 of 27 known T2D index SNPs or close proxies were replicated with p < 0.05 as described. A particular strength of our study as compared to other large-scale meta-analyses of T2D is that all participating studies performed association analyses adjusted for sex, age, and BMI, reducing confounding effects.
We identified a novel diabetes-associated locus at GATAD2A/CILP2/PBX4, included on the IBC array because it was previously described as being associated with lipid levels.39 GATAD2A rs3794991 is in strong LD (r2 > 0.90 in HapMap CEU) with rs16996148 (near CILP2/PBX4), previously associated with low-density lipoprotein (LDL) cholesterol and triglycerides (TGs) in meta-analysis of GWAS67 and in previous IBC studies of TG levels.45 Interestingly, the LDL and TG-lowering allele is associated with increased risk of T2D, reminiscent of the contrasting effects on T2D and triglyceride levels of the pleiotropic missense P446L SNP in GCKR.68 GATAD2A encodes the GATA zinc finger domain containing 2A, a transcriptional repressor that interacts with the methyl-CpG-binding domain proteins MBD2 (MIM 603547) and MBD3 (MIM 603573). Methyl-CpG-binding domain proteins mediate functional responses of methylated DNA. PBX4 encodes a homeodomain protein with similarity to a transcription factor involved in translocations in pre-B cell leukemias, and CILP2 encodes cartilage intermediate layer protein 2. Further studies are needed to establish the genetic variants that contribute to diabetes and lipid traits and to establish the causal mechanisms at this locus.
T2D-associated SNPs at the second genome-wide significant locus, the HLA-DQB1 region, have previously been strongly associated with type 1 diabetes (T1D) as one of four independent signals from the HLA region.65 This signal most likely represents association with LADA in both the IBC array and DIAGRAM T2D datasets; among most T2D studies, approximately 10% of “cases” are actually misdiagnosed individuals with LADA.69 An alternative hypothesis is that T1D risk alleles confer a much weaker risk to T2D.70 In this study, we show that the association of HLA SNPs with T2D is most likely an artifact caused by the inclusion of misdiagnosed individuals with LADA in our study, as indicated both by the comparison of DIAGRAM component studies with and without LADA cases and fine mapping of the major signal in the HLA region. If we assume an OR of 5.49 for the HLA signal in the LADA cases,71 we estimate the percentage of LADA cases in our total cases set to be 7.6%, consistent with previous estimates.69
A second T1D risk allele (rs10770141, located in the promoter region of tyrosine hydroxylase [TH] and 11 kb upstream of the insulin (INS) gene) was study-wide significant, but interestingly, this T1D risk allele was protective for T2D. Although located close to the insulin gene, this SNP regulates expression of TH; the T2D risk allele increases expression, and the T1D risk allele lowers expression.72,73 The signal is not correlated with a minisatellite upstream of the insulin gene; this minisatellite has previously been inconsistently associated with risk of T2D.74,75 Replication in independent cohorts will be important for the validation of this finding, and functional studies will be required to establish whether causal variants at this locus indeed act antagonistically to contribute to type 1 and type 2 diabetes. No significant association with T2D was found for other SNPs that had genome-wide-significant associations with T1D (Table S9).
The fourth signal resides in SREBF1, which encodes the transcription factors sterol-regulatory-element-binding protein (SREBP)-1a and -1c. Whereas SREBP1a is ubiquitously expressed, SREBP1c is particularly expressed in insulin-sensitive tissues such as liver and adipose. SREBP1a and SREBP1c control lipid synthesis and glucose metabolism by regulating the expression of key genes involved in glucose, fatty acid, and triglyceride metabolism.76,77 Variants in SREBF1 have previously been shown to be associated with T2D in several candidate-gene studies.60,61,78–80 All reported associated variants are in substantial LD with our most significantly associated SNP, rs4925115 (1000 Genomes Pilot 1: r2 = 0.81–0.89). However, thus far GWASs have not detected SREBF1 as a T2D locus, perhaps because most GWASs did not systematically adjust for the confounding factors of sex, age and BMI, and these adjustments were demonstrated to be essential for detection of this association in a previous study.60 Specifically, in the DIAGRAM meta-analysis, most component studies did not adjust for sex, age, and BMI, providing a likely explanation as to why the SREBF1 signal was not strongly replicated (Table 1).
T2D association signals that were close to study-wide significance include compelling candidates previously confirmed as associated with glycemic diabetes-related traits; such candidates include MADD (MIM 603584) near FOLH1 (MIM 600934),25 the glucose transporter 2 isoform SLC2A2 (MIM 138160),25 and gastric inhibitory polypeptide receptor GIPR (MIM 137241).66 These suggestive findings are consistent with the hypothesis that a large number of common variants and genes with modest effects contribute to the risk of T2D and that current studies are underpowered to detect these effects. Indeed, despite the large sample sizes assembled here, a limitation of our study is that significant and borderline-significant associations based on combined analysis of the European IBC and DIAGRAM datasets will need additional independent replication and follow-up.
Multiethnic meta-analysis across all 39 studies identified association of a common variant in BCL2 with T2D, an anti-apoptotic protein that has not previously been implicated in this disease. Meta-analysis of IBC array studies in African Americans also identified study-wide-significant association of independent alleles at HMGA2, suggesting that this gene might be causal across different ethnicities. Our observations that a genetic risk score of 27 variants associates with a risk of T2D in African Americans, Asians, and Hispanic populations is also consistent with the idea that at least a subset of T2D causal risk alleles spans ethnicities. The genetic risk score analysis confirms and extends findings in a previous study by Waters et al.,34 who report consistent association of 19 European T2D risk variants in several racial and ethnic groups from the US. Notably, our study included additional correction for population structure, which may contribute to the slightly reduced effect sizes observed.
In addition to common variants, the IBC array was selected to capture rare missense variants at select loci that are not directly captured or imputable by conventional GWASs. Robust association of an established missense SNP in HNF1a (rs1800574) with MAF = 0.029 (p = 1.4 × 10⁻⁷ in samples of European ancestry; Table S7)13 validates the platform's ability to detect rare variation that contributes to the risk of T2D. Although no rare variants reached study-wide significance, several follow-up candidate variants in known T2D loci were identified in African Americans.
In conclusion, this large-scale gene-centric meta-analysis of 39 multiethnic T2D association studies identified three European T2D risk loci (GATAD2A/CILP2/PBX4, previously known to have protective effects on lipids; TH/INS, previously known to have protective effects on T1D, and SREBF1), one African-American T2D risk locus (HMGA2), and one multiethnic risk locus (BCL2) and confirmed that a genetic score of T2D risk alleles influence risk of T2D in multiethnic populations including African-Americans, Hispanics, and Asians. Thus, well-powered, multiethnic GWASs of T2D should lead to the discovery of additional diabetes-associated genes relevant to multiple ethnic groups.
Acknowledgments
The CARe Consortium wishes to acknowledge the support of the National Heart, Lung, and Blood Institute and the contributions of the research institutions, study investigators, field staff, and study participants in creating this resource for biomedical research. The following nine parent studies have contributed parent study data, ancillary study data, and DNA samples through the Broad Institute of Harvard University and the Massachusetts Institute of Technology (N01-HC-65226) to create this genotype/phenotype database for wide dissemination to the biomedical research community: the Atherosclerosis Risk in Communities (ARIC) study, the Cardiovascular Health Study (CHS), the Cleveland Family Study (CFS), the Cooperative Study of Sickle Cell Disease (CSSCD), the Coronary Artery Risk Development in Young Adults (CARDIA) study, the Framingham Heart Study (FHS), the Jackson Heart Study (JHS), the Multi-Ethnic Study of Atherosclerosis (MESA), and the Sleep Heart Health Study (SHHS). R.S. is partially supported by NIDDK NIH R21 (DK089378). C.C.E is supported by a Rubicon grant from the Netherlands Organization for Scientific Research (NWO). Additional acknowledgements for each cohort are listed in the Supplemental Data. Also see the Supplemental Data for conflict-of-interest disclosures for some of the authors.
Contributor Information
Richa Saxena, Email: rsaxena@chgr.mgh.harvard.edu.
Brendan J. Keating, Email: keatingb@email.chop.edu.
Supplemental Data
Web Resources
The URLs for data presented herein are as follows:
Online Mendelian Inheritance in Man (OMIM), http://www.omim.org
References
- 1.Kaprio J., Tuomilehto J., Koskenvuo M., Romanov K., Reunanen A., Eriksson J., Stengård J., Kesäniemi Y.A. Concordance for type 1 (insulin-dependent) and type 2 (non-insulin-dependent) diabetes mellitus in a population-based cohort of twins in Finland. Diabetologia. 1992;35:1060–1067. doi: 10.1007/BF02221682. [DOI] [PubMed] [Google Scholar]
- 2.Poulsen P., Kyvik K.O., Vaag A., Beck-Nielsen H. Heritability of type II (non-insulin-dependent) diabetes mellitus and abnormal glucose tolerance—A population-based twin study. Diabetologia. 1999;42:139–145. doi: 10.1007/s001250051131. [DOI] [PubMed] [Google Scholar]
- 3.Barakat K., Hitman G.A. Genetic susceptibility to macrovascular complications of type 2 diabetes mellitus. Best Pract. Res. Clin. Endocrinol. Metab. 2001;15:359–370. doi: 10.1053/beem.2001.0151. [DOI] [PubMed] [Google Scholar]
- 4.Lehtovirta M., Pietiläinen K.H., Levälahti E., Heikkilä K., Groop L., Silventoinen K., Koskenvuo M., Kaprio J. Evidence that BMI and type 2 diabetes share only a minor fraction of genetic variance: a follow-up study of 23,585 monozygotic and dizygotic twins from the Finnish Twin Cohort Study. Diabetologia. 2010;53:1314–1321. doi: 10.1007/s00125-010-1746-4. [DOI] [PubMed] [Google Scholar]
- 5.North K.E., Williams J.T., Welty T.K., Best L.G., Lee E.T., Fabsitz R.R., Howard B.V., MacCluer J.W. Evidence for joint action of genes on diabetes status and CVD risk factors in American Indians: The strong heart family study. Int. J. Obes. Relat. Metab. Disord. 2003;27:491–497. doi: 10.1038/sj.ijo.0802261. [DOI] [PubMed] [Google Scholar]
- 6.Cowie C.C., Rust K.F., Byrd-Holt D.D., Gregg E.W., Ford E.S., Geiss L.S., Bainbridge K.E., Fradkin J.E. Prevalence of diabetes and high risk for diabetes using A1C criteria in the U.S. population in 1988-2006. Diabetes Care. 2010;33:562–568. doi: 10.2337/dc09-1524. [DOI] [PMC free article] [PubMed] [Google Scholar]
- 7.Lee J.W., Brancati F.L., Yeh H.C. Trends in the prevalence of type 2 diabetes in Asians versus whites: Results from the United States National Health Interview Survey, 1997-2008. Diabetes Care. 2011;34:353–357. doi: 10.2337/dc10-0746. [DOI] [PMC free article] [PubMed] [Google Scholar]
- 8.Díaz-Apodaca B.A., Ebrahim S., McCormack V., de Cosío F.G., Ruiz-Holguín R. Prevalence of type 2 diabetes and impaired fasting glucose: cross-sectional study of multiethnic adult population at the United States-Mexico border. Rev. Panam. Salud Publica. 2010;28:174–181. doi: 10.1590/s1020-49892010000900007. [DOI] [PubMed] [Google Scholar]
- 9.Bowden D.W., Cox A.J., Freedman B.I., Hugenschimdt C.E., Wagenknecht L.E., Herrington D., Agarwal S., Register T.D., Maldjian J.A., Ng M.C. Review of the Diabetes Heart Study (DHS) family of studies: A comprehensively examined sample for genetic and epidemiological studies of type 2 diabetes and its complications. Rev. Diabet. Stud. 2010;7:188–201. doi: 10.1900/RDS.2010.7.188. [DOI] [PMC free article] [PubMed] [Google Scholar]
- 10.Altshuler D., Hirschhorn J.N., Klannemark M., Lindgren C.M., Vohl M.C., Nemesh J., Lane C.R., Schaffner S.F., Bolk S., Brewer C. The common PPARgamma Pro12Ala polymorphism is associated with decreased risk of type 2 diabetes. Nat. Genet. 2000;26:76–80. doi: 10.1038/79216. [DOI] [PubMed] [Google Scholar]
- 11.Gloyn A.L., Hashim Y., Ashcroft S.J., Ashfield R., Wiltshire S., Turner R.C., UK Prospective Diabetes Study (UKPDS 53) Association studies of variants in promoter and coding regions of beta-cell ATP-sensitive K-channel genes SUR1 and Kir6.2 with Type 2 diabetes mellitus (UKPDS 53) Diabet. Med. 2001;18:206–212. doi: 10.1046/j.1464-5491.2001.00449.x. [DOI] [PubMed] [Google Scholar]
- 12.Sandhu M.S., Weedon M.N., Fawcett K.A., Wasson J., Debenham S.L., Daly A., Lango H., Frayling T.M., Neumann R.J., Sherva R. Common variants in WFS1 confer risk of type 2 diabetes. Nat. Genet. 2007;39:951–953. doi: 10.1038/ng2067. [DOI] [PMC free article] [PubMed] [Google Scholar]
- 13.Winckler W., Weedon M.N., Graham R.R., McCarroll S.A., Purcell S., Almgren P., Tuomi T., Gaudet D., Boström K.B., Walker M. Evaluation of common variants in the six known maturity-onset diabetes of the young (MODY) genes for association with type 2 diabetes. Diabetes. 2007;56:685–693. doi: 10.2337/db06-0202. [DOI] [PubMed] [Google Scholar]
- 14.Winckler W., Burtt N.P., Holmkvist J., Cervin C., de Bakker P.I., Sun M., Almgren P., Tuomi T., Gaudet D., Hudson T.J. Association of common variation in the HNF1alpha gene region with risk of type 2 diabetes. Diabetes. 2005;54:2336–2342. doi: 10.2337/diabetes.54.8.2336. [DOI] [PubMed] [Google Scholar]
- 15.Winckler W., Graham R.R., de Bakker P.I., Sun M., Almgren P., Tuomi T., Gaudet D., Hudson T.J., Ardlie K.G., Daly M.J. Association testing of variants in the hepatocyte nuclear factor 4alpha gene with risk of type 2 diabetes in 7,883 people. Diabetes. 2005;54:886–892. doi: 10.2337/diabetes.54.3.886. [DOI] [PubMed] [Google Scholar]
- 16.Grant S.F., Thorleifsson G., Reynisdottir I., Benediktsson R., Manolescu A., Sainz J., Helgason A., Stefansson H., Emilsson V., Helgadottir A. Variant of transcription factor 7-like 2 (TCF7L2) gene confers risk of type 2 diabetes. Nat. Genet. 2006;38:320–323. doi: 10.1038/ng1732. [DOI] [PubMed] [Google Scholar]
- 17.Guo T., Hanson R.L., Traurig M., Muller Y.L., Ma L., Mack J., Kobes S., Knowler W.C., Bogardus C., Baier L.J. TCF7L2 is not a major susceptibility gene for type 2 diabetes in Pima Indians: Analysis of 3,501 individuals. Diabetes. 2007;56:3082–3088. doi: 10.2337/db07-0621. [DOI] [PubMed] [Google Scholar]
- 18.Saxena R., Voight B.F., Lyssenko V., Burtt N.P., de Bakker P.I., Chen H., Roix J.J., Kathiresan S., Hirschhorn J.N., Daly M.J., Diabetes Genetics Initiative of Broad Institute of Harvard and MIT, Lund University, and Novartis Institutes of BioMedical Research Genome-wide association analysis identifies loci for type 2 diabetes and triglyceride levels. Science. 2007;316:1331–1336. doi: 10.1126/science.1142358. [DOI] [PubMed] [Google Scholar]
- 19.Scott L.J., Mohlke K.L., Bonnycastle L.L., Willer C.J., Li Y., Duren W.L., Erdos M.R., Stringham H.M., Chines P.S., Jackson A.U. A genome-wide association study of type 2 diabetes in Finns detects multiple susceptibility variants. Science. 2007;316:1341–1345. doi: 10.1126/science.1142382. [DOI] [PMC free article] [PubMed] [Google Scholar]
- 20.Sladek R., Rocheleau G., Rung J., Dina C., Shen L., Serre D., Boutin P., Vincent D., Belisle A., Hadjadj S. A genome-wide association study identifies novel risk loci for type 2 diabetes. Nature. 2007;445:881–885. doi: 10.1038/nature05616. [DOI] [PubMed] [Google Scholar]
- 21.Steinthorsdottir V., Thorleifsson G., Reynisdottir I., Benediktsson R., Jonsdottir T., Walters G.B., Styrkarsdottir U., Gretarsdottir S., Emilsson V., Ghosh S. A variant in CDKAL1 influences insulin response and risk of type 2 diabetes. Nat. Genet. 2007;39:770–775. doi: 10.1038/ng2043. [DOI] [PubMed] [Google Scholar]
- 22.Zeggini E., Weedon M.N., Lindgren C.M., Frayling T.M., Elliott K.S., Lango H., Timpson N.J., Perry J.R., Rayner N.W., Freathy R.M., Wellcome Trust Case Control Consortium (WTCCC) Replication of genome-wide association signals in UK samples reveals risk loci for type 2 diabetes. Science. 2007;316:1336–1341. doi: 10.1126/science.1142364. [DOI] [PMC free article] [PubMed] [Google Scholar]
- 23.Bouatia-Naji N., Rocheleau G., Van Lommel L., Lemaire K., Schuit F., Cavalcanti-Proença C., Marchand M., Hartikainen A.L., Sovio U., De Graeve F. A polymorphism within the G6PC2 gene is associated with fasting plasma glucose levels. Science. 2008;320:1085–1088. doi: 10.1126/science.1156849. [DOI] [PubMed] [Google Scholar]
- 24.Voight B.F., Scott L.J., Steinthorsdottir V., Morris A.P., Dina C., Welch R.P., Zeggini E., Huth C., Aulchenko Y.S., Thorleifsson G., MAGIC investigators. GIANT Consortium Twelve type 2 diabetes susceptibility loci identified through large-scale association analysis. Nat. Genet. 2010;42:579–589. doi: 10.1038/ng.609. [DOI] [PMC free article] [PubMed] [Google Scholar]
- 25.Dupuis J., Langenberg C., Prokopenko I., Saxena R., Soranzo N., Jackson A.U., Wheeler E., Glazer N.L., Bouatia-Naji N., Gloyn A.L., DIAGRAM Consortium. GIANT Consortium. Global BPgen Consortium. Anders Hamsten on behalf of Procardis Consortium. MAGIC investigators New genetic loci implicated in fasting glucose homeostasis and their impact on type 2 diabetes risk. Nat. Genet. 2010;42:105–116. doi: 10.1038/ng.520. [DOI] [PMC free article] [PubMed] [Google Scholar]
- 26.So H.C., Gui A.H., Cherny S.S., Sham P.C. Evaluating the heritability explained by known susceptibility variants: a survey of ten complex diseases. Genet. Epidemiol. 2011;35:310–317. doi: 10.1002/gepi.20579. [DOI] [PubMed] [Google Scholar]
- 27.Yasuda K., Miyake K., Horikawa Y., Hara K., Osawa H., Furuta H., Hirota Y., Mori H., Jonsson A., Sato Y. Variants in KCNQ1 are associated with susceptibility to type 2 diabetes mellitus. Nat. Genet. 2008;40:1092–1097. doi: 10.1038/ng.207. [DOI] [PubMed] [Google Scholar]
- 28.Unoki H., Takahashi A., Kawaguchi T., Hara K., Horikoshi M., Andersen G., Ng D.P., Holmkvist J., Borch-Johnsen K., Jørgensen T. SNPs in KCNQ1 are associated with susceptibility to type 2 diabetes in East Asian and European populations. Nat. Genet. 2008;40:1098–1102. doi: 10.1038/ng.208. [DOI] [PubMed] [Google Scholar]
- 29.Tsai F.J., Yang C.F., Chen C.C., Chuang L.M., Lu C.H., Chang C.T., Wang T.Y., Chen R.H., Shiu C.F., Liu Y.M. A genome-wide association study identifies susceptibility variants for type 2 diabetes in Han Chinese. PLoS Genet. 2010;6:e1000847. doi: 10.1371/journal.pgen.1000847. [DOI] [PMC free article] [PubMed] [Google Scholar]
- 30.Shu X.O., Long J., Cai Q., Qi L., Xiang Y.B., Cho Y.S., Tai E.S., Li X., Lin X., Chow W.H. Identification of new genetic risk variants for type 2 diabetes. PLoS Genet. 2010;6:e1001127. doi: 10.1371/journal.pgen.1001127. [DOI] [PMC free article] [PubMed] [Google Scholar]
- 31.Yamauchi T., Hara K., Maeda S., Yasuda K., Takahashi A., Horikoshi M., Nakamura M., Fujita H., Grarup N., Cauchi S. A genome-wide association study in the Japanese population identifies susceptibility loci for type 2 diabetes at UBE2E2 and C2CD4A-C2CD4B. Nat. Genet. 2010;42:864–868. doi: 10.1038/ng.660. [DOI] [PubMed] [Google Scholar]
- 32.Kooner J.S., Saleheen D., Sim X., Sehmi J., Zhang W., Frossard P., Been L.F., Chia K.S., Dimas A.S., Hassanali N., DIAGRAM. MuTHER Genome-wide association study in individuals of South Asian ancestry identifies six new type 2 diabetes susceptibility loci. Nat. Genet. 2011;43:984–989. doi: 10.1038/ng.921. [DOI] [PMC free article] [PubMed] [Google Scholar]
- 33.Lettre G., Palmer C.D., Young T., Ejebe K.G., Allayee H., Benjamin E.J., Bennett F., Bowden D.W., Chakravarti A., Dreisbach A. Genome-wide association study of coronary heart disease and its risk factors in 8,090 African Americans: The NHLBI CARe Project. PLoS Genet. 2011;7:e1001300. doi: 10.1371/journal.pgen.1001300. [DOI] [PMC free article] [PubMed] [Google Scholar]
- 34.Waters K.M., Stram D.O., Hassanein M.T., Le Marchand L., Wilkens L.R., Maskarinec G., Monroe K.R., Kolonel L.N., Altshuler D., Henderson B.E., Haiman C.A. Consistent association of type 2 diabetes risk variants found in europeans in diverse racial and ethnic groups. PLoS Genet. 2010;6:e1001078. doi: 10.1371/journal.pgen.1001078. [DOI] [PMC free article] [PubMed] [Google Scholar]
- 35.Parra E.J., Below J.E., Krithika S., Valladares A., Barta J.L., Cox N.J., Hanis C.L., Wacher N., Garcia-Mena J., Hu P., Diabetes Genetics Replication and Meta-analysis (DIAGRAM) Consortium Genome-wide association study of type 2 diabetes in a sample from Mexico City and a meta-analysis of a Mexican-American sample from Starr County, Texas. Diabetologia. 2011;54:2038–2046. doi: 10.1007/s00125-011-2172-y. [DOI] [PMC free article] [PubMed] [Google Scholar]
- 36.Ramos E., Chen G., Shriner D., Doumatey A., Gerry N.P., Herbert A., Huang H., Zhou J., Christman M.F., Adeyemo A., Rotimi C. Replication of genome-wide association studies (GWAS) loci for fasting plasma glucose in African-Americans. Diabetologia. 2011;54:783–788. doi: 10.1007/s00125-010-2002-7. [DOI] [PMC free article] [PubMed] [Google Scholar]
- 37.Musunuru K., Strong A., Frank-Kamenetsky M., Lee N.E., Ahfeldt T., Sachs K.V., Li X., Li H., Kuperwasser N., Ruda V.M. From noncoding variant to phenotype via SORT1 at the 1p13 cholesterol locus. Nature. 2010;466:714–719. doi: 10.1038/nature09266. [DOI] [PMC free article] [PubMed] [Google Scholar]
- 38.Pulit S.L., Voight B.F., de Bakker P.I. Multiethnic genetic association studies improve power for locus discovery. PLoS ONE. 2010;5:e12600. doi: 10.1371/journal.pone.0012600. [DOI] [PMC free article] [PubMed] [Google Scholar]
- 39.Keating B.J., Tischfield S., Murray S.S., Bhangale T., Price T.S., Glessner J.T., Galver L., Barrett J.C., Grant S.F., Farlow D.N. Concept, design and implementation of a cardiovascular gene-centric 50 k SNP array for large-scale genomic association studies. PLoS ONE. 2008;3:e3583. doi: 10.1371/journal.pone.0003583. [DOI] [PMC free article] [PubMed] [Google Scholar]
- 40.Fajans S.S., Bell G.I., Polonsky K.S. Molecular mechanisms and clinical pathophysiology of maturity-onset diabetes of the young. N. Engl. J. Med. 2001;345:971–980. doi: 10.1056/NEJMra002168. [DOI] [PubMed] [Google Scholar]
- 41.Biddinger S.B., Kahn C.R. From mice to men: Insights into the insulin resistance syndromes. Annu. Rev. Physiol. 2006;68:123–158. doi: 10.1146/annurev.physiol.68.040104.124723. [DOI] [PubMed] [Google Scholar]
- 42.Das S.K., Elbein S.C. The search for type 2 diabetes susceptibility loci: The chromosome 1q story. Curr. Diab. Rep. 2007;7:154–164. doi: 10.1007/s11892-007-0025-3. [DOI] [PubMed] [Google Scholar]
- 43.Clarke R., Peden J.F., Hopewell J.C., Kyriakou T., Goel A., Heath S.C., Parish S., Barlera S., Franzosi M.G., Rust S., PROCARDIS Consortium Genetic variants associated with Lp(a) lipoprotein level and coronary disease. N. Engl. J. Med. 2009;361:2518–2528. doi: 10.1056/NEJMoa0902604. [DOI] [PubMed] [Google Scholar]
- 44.IBC 50K CAD Consortium Large-scale gene-centric analysis identifies novel variants for coronary artery disease. PLoS Genet. 2011;7:e1002260. doi: 10.1371/journal.pgen.1002260. [DOI] [PMC free article] [PubMed] [Google Scholar]
- 45.Talmud P.J., Drenos F., Shah S., Shah T., Palmen J., Verzilli C., Gaunt T.R., Pallas J., Lovering R., Li K., ASCOT investigators. NORDIL investigators. BRIGHT Consortium Gene-centric association signals for lipids and apolipoproteins identified via the HumanCVD BeadChip. Am. J. Hum. Genet. 2009;85:628–642. doi: 10.1016/j.ajhg.2009.10.014. [DOI] [PMC free article] [PubMed] [Google Scholar]
- 46.Fox E.R., Young J.H., Li Y., Dreisbach A.W., Keating B.J., Musani S.K., Liu K., Morrison A.C., Ganesh S., Kutlar A. Association of genetic variation with systolic and diastolic blood pressure among African Americans: the Candidate Gene Association Resource study. Hum. Mol. Genet. 2011;20:2273–2284. doi: 10.1093/hmg/ddr092. [DOI] [PMC free article] [PubMed] [Google Scholar]
- 47.Johnson T., Gaunt T.R., Newhouse S.J., Padmanabhan S., Tomaszewski M., Kumari M., Morris R.W., Tzoulaki I., O'Brien E.T., Poulter N.R. Blood Pressure Loci Identified with a Gene-Centric Array. Am. J. Hum. Genet. 2011;89:688–700. doi: 10.1016/j.ajhg.2011.10.013. [DOI] [PMC free article] [PubMed] [Google Scholar]
- 48.Stark K., Esslinger U.B., Reinhard W., Petrov G., Winkler T., Komajda M., Isnard R., Charron P., Villard E., Cambien F. Genetic association study identifies HSPB7 as a risk gene for idiopathic dilated cardiomyopathy. PLoS Genet. 2010;6:e1001167. doi: 10.1371/journal.pgen.1001167. [DOI] [PMC free article] [PubMed] [Google Scholar]
- 49.Wassel C.L., Lange L.A., Keating B.J., Taylor K.C., Johnson A.D., Palmer C., Ho L.A., Smith N.L., Lange E.M., Li Y. Association of genomic loci from a cardiovascular gene SNP array with fibrinogen levels in European Americans and African-Americans from six cohort studies: the Candidate Gene Association Resource (CARe) Blood. 2011;117:268–275. doi: 10.1182/blood-2010-06-289546. [DOI] [PMC free article] [PubMed] [Google Scholar]
- 50.Lo K.S., Wilson J.G., Lange L.A., Folsom A.R., Galarneau G., Ganesh S.K., Grant S.F., Keating B.J., McCarroll S.A., Mohler E.R., 3rd Genetic association analysis highlights new loci that modulate hematological trait variation in Caucasians and African Americans. Hum. Genet. 2011;129:307–317. doi: 10.1007/s00439-010-0925-1. [DOI] [PMC free article] [PubMed] [Google Scholar]
- 51.Lanktree M.B., Guo Y., Murtaza M., Glessner J.T., Bailey S.D., Onland-Moret N.C., Lettre G., Ongen H., Rajagopalan R., Johnson T., Hugh Watkins on behalf of PROCARDIS. Meena Kumari on behalf of the Whitehall II Study and the WHII 50K Group Meta-analysis of dense genecentric association studies reveals common and uncommon variants associated with height. Am. J. Hum. Genet. 2011;88:6–18. doi: 10.1016/j.ajhg.2010.11.007. [DOI] [PMC free article] [PubMed] [Google Scholar]
- 52.American Diabetes Association Diagnosis and classification of diabetes mellitus. Diabetes Care. 2004;27(Suppl 1):S5–S10. doi: 10.2337/diacare.27.2007.s5. [DOI] [PubMed] [Google Scholar]
- 53.Price A.L., Butler J., Patterson N., Capelli C., Pascali V.L., Scarnicci F., Ruiz-Linares A., Groop L., Saetta A.A., Korkolopoulou P. Discerning the ancestry of European Americans in genetic association studies. PLoS Genet. 2008;4:e236. doi: 10.1371/journal.pgen.0030236. [DOI] [PMC free article] [PubMed] [Google Scholar]
- 54.Price A.L., Patterson N.J., Plenge R.M., Weinblatt M.E., Shadick N.A., Reich D. Principal components analysis corrects for stratification in genome-wide association studies. Nat. Genet. 2006;38:904–909. doi: 10.1038/ng1847. [DOI] [PubMed] [Google Scholar]
- 55.Espeland M.A., Dotson K., Jaramillo S.A., Kahn S.E., Harrison B., Montez M., Foreyt J.P., Montgomery B., Knowler W.C., Look AHEAD Research Group Consent for genetics studies among clinical trial participants: findings from Action for Health in Diabetes (Look AHEAD) Clin. Trials. 2006;3:443–456. doi: 10.1177/1740774506070727. [DOI] [PMC free article] [PubMed] [Google Scholar]
- 56.Pi-Sunyer X., Blackburn G., Brancati F.L., Bray G.A., Bright R., Clark J.M., Curtis J.M., Espeland M.A., Foreyt J.P., Graves K., Look AHEAD Research Group Reduction in weight and cardiovascular disease risk factors in individuals with type 2 diabetes: One-year results of the look AHEAD trial. Diabetes Care. 2007;30:1374–1383. doi: 10.2337/dc07-0048. [DOI] [PMC free article] [PubMed] [Google Scholar]
- 57.Musunuru K., Lettre G., Young T., Farlow D.N., Pirruccello J.P., Ejebe K.G., Keating B.J., Yang Q., Chen M.H., Lapchyk N., NHLBI Candidate Gene Association Resource Candidate gene association resource (CARe): design, methods, and proof of concept. Circ. Cardiovasc. Genet. 2010;3:267–275. doi: 10.1161/CIRCGENETICS.109.882696. [DOI] [PMC free article] [PubMed] [Google Scholar]
- 58.Purcell S., Neale B., Todd-Brown K., Thomas L., Ferreira M.A., Bender D., Maller J., Sklar P., de Bakker P.I., Daly M.J., Sham P.C. PLINK: a tool set for whole-genome association and population-based linkage analyses. Am. J. Hum. Genet. 2007;81:559–575. doi: 10.1086/519795. [DOI] [PMC free article] [PubMed] [Google Scholar]
- 59.Cornelis M.C., Qi L., Zhang C., Kraft P., Manson J., Cai T., Hunter D.J., Hu F.B. Joint effects of common genetic variants on the risk for type 2 diabetes in U.S. men and women of European ancestry. Ann. Intern. Med. 2009;150:541–550. doi: 10.7326/0003-4819-150-8-200904210-00008. [DOI] [PMC free article] [PubMed] [Google Scholar]
- 60.Grarup N., Stender-Petersen K.L., Andersson E.A., Jørgensen T., Borch-Johnsen K., Sandbaek A., Lauritzen T., Schmitz O., Hansen T., Pedersen O. Association of variants in the sterol regulatory element-binding factor 1 (SREBF1) gene with type 2 diabetes, glycemia, and insulin resistance: a study of 15,734 Danish subjects. Diabetes. 2008;57:1136–1142. doi: 10.2337/db07-1534. [DOI] [PubMed] [Google Scholar]
- 61.Eberlé D., Clément K., Meyre D., Sahbatou M., Vaxillaire M., Le Gall A., Ferré P., Basdevant A., Froguel P., Foufelle F. SREBF-1 gene polymorphisms are associated with obesity and type 2 diabetes in French obese and diabetic cohorts. Diabetes. 2004;53:2153–2157. doi: 10.2337/diabetes.53.8.2153. [DOI] [PubMed] [Google Scholar]
- 62.Pereyra F., Jia X., McLaren P.J., Telenti A., de Bakker P.I., Walker B.D., Ripke S., Brumme C.J., Pulit S.L., Carrington M., International HIV Controllers Study The major genetic determinants of HIV-1 control affect HLA class I peptide presentation. Science. 2010;330:1551–1557. doi: 10.1126/science.1195271. [DOI] [PMC free article] [PubMed] [Google Scholar]
- 63.Pociot F., McDermott M.F. Genetics of type 1 diabetes mellitus. Genes Immun. 2002;3:235–249. doi: 10.1038/sj.gene.6363875. [DOI] [PubMed] [Google Scholar]
- 64.She J.X. Susceptibility to type I diabetes: HLA-DQ and DR revisited. Immunol. Today. 1996;17:323–329. doi: 10.1016/0167-5699(96)10014-1. [DOI] [PubMed] [Google Scholar]
- 65.Todd J.A. Etiology of type 1 diabetes. Immunity. 2010;32:457–467. doi: 10.1016/j.immuni.2010.04.001. [DOI] [PubMed] [Google Scholar]
- 66.Saxena R., Hivert M.F., Langenberg C., Tanaka T., Pankow J.S., Vollenweider P., Lyssenko V., Bouatia-Naji N., Dupuis J., Jackson A.U., GIANT consortium. MAGIC investigators Genetic variation in GIPR influences the glucose and insulin responses to an oral glucose challenge. Nat. Genet. 2010;42:142–148. doi: 10.1038/ng.521. [DOI] [PMC free article] [PubMed] [Google Scholar]
- 67.Kathiresan S., Willer C.J., Peloso G.M., Demissie S., Musunuru K., Schadt E.E., Kaplan L., Bennett D., Li Y., Tanaka T. Common variants at 30 loci contribute to polygenic dyslipidemia. Nat. Genet. 2009;41:56–65. doi: 10.1038/ng.291. [DOI] [PMC free article] [PubMed] [Google Scholar]
- 68.Orho-Melander M., Melander O., Guiducci C., Perez-Martinez P., Corella D., Roos C., Tewhey R., Rieder M.J., Hall J., Abecasis G. Common missense variant in the glucokinase regulatory protein gene is associated with increased plasma triglyceride and C-reactive protein but lower fasting glucose concentrations. Diabetes. 2008;57:3112–3121. doi: 10.2337/db08-0516. [DOI] [PMC free article] [PubMed] [Google Scholar]
- 69.Grant S.F., Hakonarson H., Schwartz S. Can the genetics of type 1 and type 2 diabetes shed light on the genetics of latent autoimmune diabetes in adults? Endocr. Rev. 2010;31:183–193. doi: 10.1210/er.2009-0029. [DOI] [PubMed] [Google Scholar]
- 70.Williams R.C., Muller Y.L., Hanson R.L., Knowler W.C., Mason C.C., Bian L., Ossowski V., Wiedrich K., Chen Y.F., Marcovina S. HLA-DRB1 reduces the risk of type 2 diabetes mellitus by increased insulin secretion. Diabetologia. 2011;54:1684–1692. doi: 10.1007/s00125-011-2122-8. [DOI] [PMC free article] [PubMed] [Google Scholar]
- 71.Wellcome Trust Case Control Consortium Genome-wide association study of 14,000 cases of seven common diseases and 3,000 shared controls. Nature. 2007;447:661–678. doi: 10.1038/nature05911. [DOI] [PMC free article] [PubMed] [Google Scholar]
- 72.Rao F., Zhang K., Zhang L., Rana B.K., Wessel J., Fung M.M., Rodriguez-Flores J.L., Taupenot L., Ziegler M.G., O'Connor D.T. Human tyrosine hydroxylase natural allelic variation: Influence on autonomic function and hypertension. Cell. Mol. Neurobiol. 2010;30:1391–1394. doi: 10.1007/s10571-010-9535-7. [DOI] [PMC free article] [PubMed] [Google Scholar]
- 73.Zhang K., Zhang L., Rao F., Brar B., Rodriguez-Flores J.L., Taupenot L., O'Connor D.T. Human tyrosine hydroxylase natural genetic variation: Delineation of functional transcriptional control motifs disrupted in the proximal promoter. Circ. Cardiovasc. Genet. 2010;3:187–198. doi: 10.1161/CIRCGENETICS.109.904813. [DOI] [PMC free article] [PubMed] [Google Scholar]
- 74.Hansen S.K., Gjesing A.P., Rasmussen S.K., Glümer C., Urhammer S.A., Andersen G., Rose C.S., Drivsholm T., Torekov S.K., Jensen D.P. Large-scale studies of the HphI insulin gene variable-number-of-tandem-repeats polymorphism in relation to Type 2 diabetes mellitus and insulin release. Diabetologia. 2004;47:1079–1087. doi: 10.1007/s00125-004-1418-3. [DOI] [PubMed] [Google Scholar]
- 75.Meigs J.B., Dupuis J., Herbert A.G., Liu C., Wilson P.W., Cupples L.A. The insulin gene variable number tandem repeat and risk of type 2 diabetes in a population-based sample of families and unrelated men and women. J. Clin. Endocrinol. Metab. 2005;90:1137–1143. doi: 10.1210/jc.2004-1212. [DOI] [PubMed] [Google Scholar]
- 76.Bengoechea-Alonso M.T., Ericsson J. SREBP in signal transduction: Cholesterol metabolism and beyond. Curr. Opin. Cell Biol. 2007;19:215–222. doi: 10.1016/j.ceb.2007.02.004. [DOI] [PubMed] [Google Scholar]
- 77.Horton J.D., Goldstein J.L., Brown M.S. SREBPs: Activators of the complete program of cholesterol and fatty acid synthesis in the liver. J. Clin. Invest. 2002;109:1125–1131. doi: 10.1172/JCI15593. [DOI] [PMC free article] [PubMed] [Google Scholar]
- 78.Felder T.K., Oberkofler H., Weitgasser R., Mackevics V., Krempler F., Paulweber B., Patsch W. The SREBF-1 locus is associated with type 2 diabetes and plasma adiponectin levels in a middle-aged Austrian population. Int. J. Obes. (Lond.) 2007;31:1099–1103. doi: 10.1038/sj.ijo.0803505. [DOI] [PubMed] [Google Scholar]
- 79.Harding A.H., Loos R.J., Luan J., O'Rahilly S., Wareham N.J., Barroso I. Polymorphisms in the gene encoding sterol regulatory element-binding factor-1c are associated with type 2 diabetes. Diabetologia. 2006;49:2642–2648. doi: 10.1007/s00125-006-0430-1. [DOI] [PMC free article] [PubMed] [Google Scholar]
- 80.Laudes M., Barroso I., Luan J., Soos M.A., Yeo G., Meirhaeghe A., Logie L., Vidal-Puig A., Schafer A.J., Wareham N.J., O'Rahilly S. Genetic variants in human sterol regulatory element binding protein-1c in syndromes of severe insulin resistance and type 2 diabetes. Diabetes. 2004;53:842–846. doi: 10.2337/diabetes.53.3.842. [DOI] [PubMed] [Google Scholar]
Associated Data
This section collects any data citations, data availability statements, or supplementary materials included in this article.