

Abstract
Conduction processes in the vasculature have traditionally been described using cable theory, i.e., locally induced signals decaying passively along the arteriolar wall. The decay is typically quantified using the steady-state length-constant, λ, derived from cable theory. However, the applicability of cable theory to blood vessels depends on assumptions that are not necessarily fulfilled in small arteries and arterioles. We have employed a morphologically and electrophysiologically detailed mathematical model of a rat mesenteric arteriole to investigate if the assumptions hold and whether λ adequately describes simulated conduction profiles. We find that several important cable theory assumptions are violated when applied to small blood vessels. However, the phenomenological use of a length-constant from a single exponential function is a good measure of conduction length. Hence, λ should be interpreted as a descriptive measure and not in light of cable theory. Determination of λ using cable theory assumes steady-state conditions. In contrast, using the model it is possible to probe how conduction behaves before steady state is achieved. As ion channels have time-dependent activation and inactivation, the conduction profile changes considerably during this dynamic period with an initially longer spread of current. This may have implications in relation to explaining why different agonists have different conduction properties. Also, it illustrates the necessity of using and developing models that handle the nonlinearity of ion channels.
Introduction
Passive electrotonic spread of electrical signals is believed to be a basic mode of intercellular communication in the vasculature (1,2). This process is characterized by the spread of current along the vascular wall and has traditionally been described using cable theory (3,4). The derived length-constant, λ, has been used extensively as a convenient measure of conduction length (4–7).
Electrotonic conduction is dependent on plasma membrane resistance (rm) and gap junctional resistance (rj) of cells within the vascular wall. The use of Ohmic approximations to describe electrotonic spread in vessels constitutes a simple characterization of the system and represents a well-established linear model. Moreover, cable theory allows for analytical treatment of electrotonic spread (see below). However, well-known vascular phenomena that involve intercellular communication, e.g., vasomotion with autonomous oscillations in intracellular Ca2+ ([Ca2+]i) and membrane potential (Vm) (8–10), cannot be described by a linear model. The existence of Ca2+- and voltage-gated ion channels in the smooth muscle cell suggests that current dissipation along a stimulated vessel must be considered to be nonlinear. For example, stimuli that change Vm sufficiently to activate, e.g., KV-channels in a local, but not in an upstream area are unlikely to result in constant rm along the vessel even under stationary conditions.
The exact size and form of vascular cells and the morphology of the vessel are also likely to influence conduction. In vascular cells, Vm is thought to equilibrate almost instantaneously. Consequently, larger cells would lead to longer conduction lengths as fewer cell membranes need be crossed in the longitudinal direction. This is neglected in cable theory, which simply assumes a continuum approximation along the length axis of the vessel.
Activation and inactivation processes of a population of a given ion channel follow complex kinetics, described by characteristic timescales. During application of a stimulus, the system may display a complex trajectory decaying toward the new steady state. After removal of the stimulus, the system decays back to the resting conditions. Many experimental protocols apply paracrine or hormonal stimuli in short pulses (timescale ∼1 s), and it is not certain that decay to a new steady state can occur within this time frame. Because λ is defined from steady-state conditions, the appropriateness of using the exponential function from cable theory is questionable.
The apparent competence of the exponential function to fit conduction profiles from experiments as well as simulations, has rendered support to cable theory as the appropriate mechanistic view. We anticipate this function to be directly applicable in some cases. For example, if the myoendothelial coupling is very high, the input resistance becomes very low and the vessel behaves as an electrical syncytium.
However, we hypothesize that the traditional view of passive electrotonic conduction is too simple to fully explain electrical conduction in an arteriole. Recently, a comprehensive model of a rat mesenteric arteriole has been developed (11). We have adapted this model to investigate the applicability of cable theory and the associated length-constant to describe the electrotonic conduction process. We also test the use of cable theory under nonsteady-state conditions.
Cable Theory
Spread of Vm changes in biological cablelike structures is usually described using cable theory. It has been applied to neurons, arrays of cells (12), and to blood vessels (11,13). A graphical representation of a linear cell array coupled electrically through gap junctions is shown in Fig. 1 A. Cylindrical segments of constant radius are connected in series. Each segment is coupled to a grounded extracellular medium through a resistance, rm, and a capacitance, Cm, connected in parallel (see Fig. 1 B). It is generally assumed that the extracellular resistance is negligible, and that the intracellular resistance is dominated by the resistance of the gap junctions (rj). For the cell array, it is further assumed that the cell-size is (approximately infinitely) small, such that a continuum approximation can be applied (14). This leads to the cable equation for a cable with uniform circular cross section and diameter, δ,
| (1) |
where x is a point along the cable, Vm is the transmembrane voltage, Vm,rest is the resting membrane potential, rm is membrane resistance, and rj is gap junctional resistance. The term (Vm – Vm,rest)/rm is current across the cell membrane.
Figure 1.
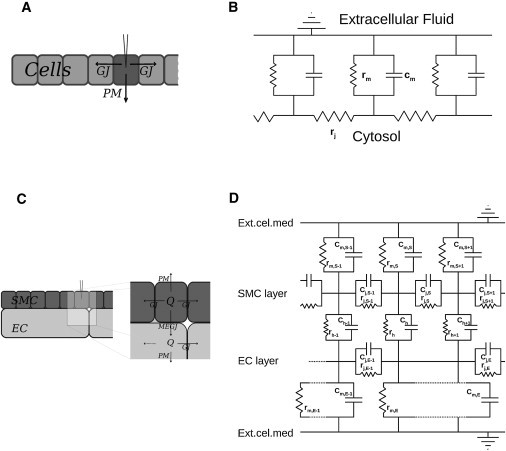
Simplified two-dimensional diagrams showing the possible current flows upon an electrical stimulus (A and C) and their electrical representations (B and D). (A and B) Within a cell array. (C and D) Within an arteriole.
An important set of basic assumptions is usually made when applying cable theory to small blood vessels (for a complete description, see Holt (15)):
-
1.
Intra- and extracellular spaces are one-dimensional and homogeneous.
-
2.
Electrotonic conduction is Ohmic.
-
3.
Membrane resistance (rm) is independent of Vm,rest.
-
4.
Ion channel conductances do not depend on time (or voltage).
-
5.
Intra- and extracellular ionic concentrations are constant.
Length-constant
At steady state, the capacitative current is zero and a membrane potential-clamp in the middle of the cell array or cable results in an exponential decay of transmembrane potential away from the point of stimulation (5). The length-constant describing the electrotonic potential spread in an infinite cable, is approximated by
| (2) |
where Ic is input current. From cable theory, it follows that . If the cable is of finite length with electrically sealed ends, the solution becomes (5)
| (3) |
where y is the position of the stimulation, and l is total length of the cable. For convenience, we call Eq. 3 for the decay function.
Use of cable theory within the microcirculation
In the microcirculation, the cable equation assumptions stated above have several weaknesses:
-
1.
Arterioles consist of at least two cell layers—an endothelial cell (EC), and one or more smooth muscle cell (SMC) layers that are coupled by myoendothelial gap junctions (MEGJ) (see Fig. 1 C). Thus, the intracellular space is neither one-dimensional nor homogeneous (in the Supporting Material, we consider and find solutions to a system of two interacting cables).
-
2.
The orientation and dimensions of vascular cells add to the spatial inhomogeneity (an electrical schematic is shown in Fig. 1 D). Branching of vessels profoundly adds to the morphological nonlinearity (we will not, however, discuss this here).
-
3.
The existence of Ca2+- and voltage-gated ion channels makes it very unlikely that rm or rj values are constant across the physiological range of Vm. With voltage-gated channels, Vm,rest becomes an important parameter in relation to current dissipation.
Although activation/inactivation of ion channels may be nonlinear, the underlying physical mechanism for electrotonic spread is still simple current dissipation and longitudinal spread of current, and at steady state, the complexity of the system is reduced. Of course, longitudinal spread of voltage or electrolytes along the vessel may be approximated through any decaying functions that fits the profile—though such functions may not necessarily have any mechanistic relevance. To compare the performance of Eq. 3 (the decay function) as a measure of conduction, we also apply a purely descriptive function, derived from a sum of exponentials to fit the simulated profiles and use λ2 (λ2 > λ1) as the measure of conduction length. Because vessels of finite length with electrically sealed ends are considered, the (linear) “method of reflections” (16) is employed, yielding the expression
| (4) |
This function resembles Eq. 2 but has no correlation to cable theory. In all simulations below, Eq. 4 is compared with Eq. 3 as a measure of conduction.
Materials and Methods
Modeling
A detailed model of an electrically sealed mesenteric arteriolar segment was developed based on Kapela et al. (11). The model describes endothelial and smooth muscle cell electrophysiology and accounts for the transport and diffusional evolution of [Ca2+], [Na+], [K+], [Cl−], and [IP3] in time. ECs are long and flat and are oriented along the vessel length axis. SMCs are spindle-shaped and wrap around ECs in a perpendicular arrangement. ECs and SMCs were modeled in an overlapping pattern, as shown in Fig. 2. The EC and SMC dimensions are 124 × 7.8 × 1(μm)3 and 62 × 6.2 × 4(μm)3, respectively (17,18). The vessel was 750-μm long with a diameter of 40 μm.
Figure 2.
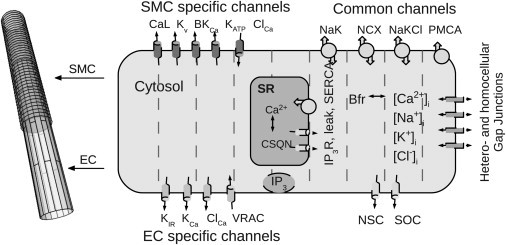
Schematic drawing of a vessel segment and the included electrophysiology. The vessel is composed of two cell layers, endothelial cells (ECs, light shaded) innermost with smooth muscle cells (SMCs, dark shaded) around. The ECs are oriented along the vessel axis, whereas SMCs are oriented perpendicular to ECs. Within each layer, the cells form an overlapping pattern. (Right) Modeled electrophysiology of the EC and SMC. (Dashed lines) Compartmental divisions that allows for diffusion. For abbreviations, please see Table 1.
To implement diffusion, each EC and SMC are compartmentalized into nineteen and eight grid elements, respectively (see Fig. 2). The particular models of ion channels and transporters were adapted from Silva et al. (19) and Kapela et al. (20,21). A complete list of mathematical expressions can be found in Section S4 in the Supporting Material.
Importantly, we assume that Vm equilibrates very fast within the individual cell. Thus, a given cell is only assigned a single Vm using the usual Hodgkin-Huxley formalism
where Ii denotes the individual ionic current of the model.
Due to the compartmentalized approach to diffusion, we applied a finite-difference-method to solve the system. A CVODE solver for stiff ODE systems (SUNDIALS, Lawrence Livermore National Laboratory, Livermore, CA) (22) was used to solve the system of coupled ordinary differential equations with relative and absolute tolerances of 10−4 and 10−9, respectively. A vessel of 750 μm consisted of 136 ECs and 304 SMCs, with a total number of variables of 63,672 (system size).
Electrophysiology
Gap junctional permeability between individual ECs and SMCs, respectively, and also between the two cell types (MEGJs) is central in vascular conduction. Their conductivities on a cellular level are hard to determine experimentally and are thus a matter of debate. In this model, we set myoendothelial coupling resistance to 900 MΩ per SMC, whereas homocellular gap junctional resistances between ECs or SMCs are set to 3 MΩ and 90 MΩ, respectively (resistance is assumed to be homogeneously spread along the borders of the cell) (23).
Stimulation procedures
The vessel was stimulated either by clamping the membrane potential of, or injecting current into, all cells belonging to the initial 62-μm segment of the virtual vessel. Current injection did not, per se, lead to changes in the intracellular concentrations of Ca2+, K+, Na+, or Cl−.
Results
At the myoendothelial conductance used, the two cell layers are isopotential at steady state (see Table S1 in the Supporting Material for physiologically relevant values at steady state). Decreasing myoendothelial conductance is associated with depolarization of SMCs and hyperpolarization of ECs.
Voltage-clamping a segment of the vessel to Vm = −20 mV and allowing the system to reach a pseudo-steady state is a convenient way to assess conduction. We choose the term “pseudo-steady state” in the following as 1.6 s of stimulation time used in this study is not sufficient to reach a true steady state (in vivo or in silico). However, a pseudo-steady state is always used in experimental situations as it is difficult—if not impossible—to maintain a long and steady stimulus (with no drift, polarization, adaptation of tissue, etc.). The brief applications of stimuli (timescale of seconds) are too short to allow true steady-state conditions. In the model, the fast and major transients have decayed after 1.6 s, but some slow decay still ensues due to residual and slowly evolving transients. That is, the system has quickly settled toward a new pseudo-steady state, but a residual motion progresses slowly. This seems to be a common property of highly regulated biological systems (24) (Fig. S2 in the Supporting Material shows how the system decays toward steady state for >15 min upon a constant stimulus). Fig. 3, A and B, show the pseudo-steady-state profiles of Vm along the EC and SMC layers, respectively, in simulations where either the EC layer (solid line) or the SMC layer (dashed line) was stimulated (stimulation of both layers can be seen in Fig. 5).
Figure 3.
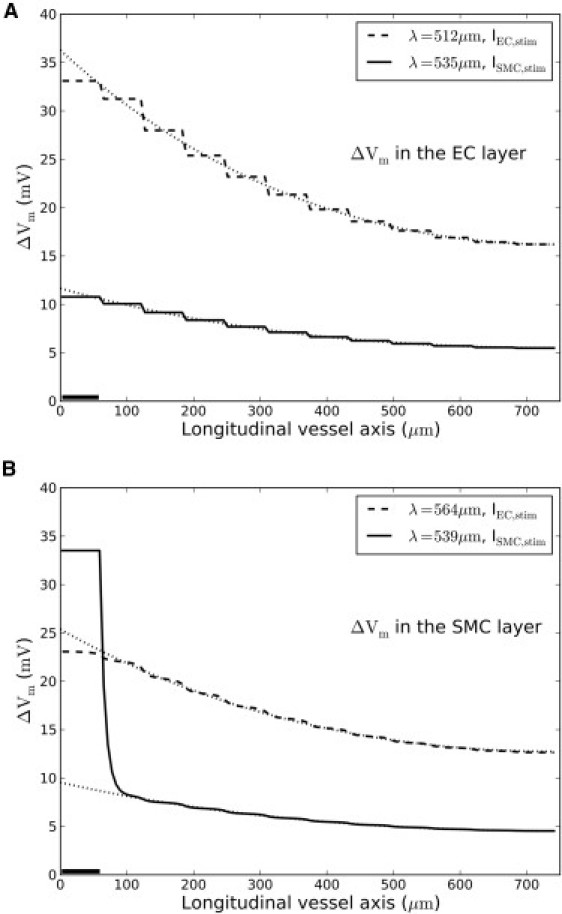
Simulations of a voltage-clamp. (Solid bar) Small segment of either the EC layer (dashed curve) or SMC layer (solid curve) that was voltage-clamped to −20 mV for 1.6 s. (Dotted curves) Associated decay-function fits. (A and B) Voltage spread at pseudo-steady state in the EC layer and SMC layer, respectively. The staircase appearance of particularly the EC profile is a consequence of the cell layout (see Fig. 2).
Figure 5.
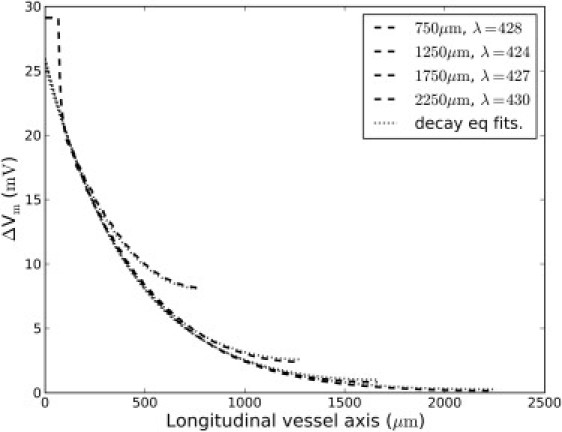
Length-constant is independent of vessel length. Vessels of different length but with identical morphology and electrophysiology were constructed and stimulated identically (dashed lines). Applying the decay function with reflection (Eq. 3) to account for the differences in vessel length led to the same length-constants, with the fits indicated (dotted lines).
Overall, the decay function (Eq. 3, and Fig. 3, dotted lines) fits the corresponding ΔVm-profiles well—except in the case of a stimulus to the SMC layer (Fig. 3 B, solid curve). Depolarization of the SMC layer produces a steep local depolarization associated with high current dissipation across the membrane as opposed to the membrane current dissipation found in the EC layer. This is due to poor current spread within the SMC layer. As a consequence of the poor coupling, the injected current causes a large change in the membrane potential in the stimulated SMCs, leading to a large increase in the membrane current and therefore dissipation of the injected current across the membrane of the stimulated SMCs. This dissipation is not seen in the EC because the cells are better coupled, allowing the injected current to spread efficiently to the neighboring cells.
Thus, ΔVm, and the dissipation of the injected current, is much smaller in the stimulated ECs than in the SMCs. In the SMCs, the voltage spike at the stimulation site cannot be fitted by a single exponential, but is fitted by two exponentials with reflection (i.e., Eq. 4). Note that the applied decay function measure roughly the same length-constant upon stimulation of either the EC or the SMC layer (Fig. 3, A and B), although ΔVm—and hence the physiological response—is very different. This is because current mainly conducts within the EC layer. Upon direct stimulation of the SMC layer (solid curves in Fig. 3), current spreads poorly from SMC to SMC. The conduction observed stems from current flowing through MEGJs into the well-coupled EC layer. Upon EC layer stimulation, this MEGJ bottleneck is bypassed, resulting in a larger ΔVm.
In conclusion, the decay function gives rise to two similar length-constants but of much different ΔVm depending on EC and/or SMC stimulation. Because ΔVm is a mediator of the physiological response, a large length-constant but low ΔVm is of limited physiological relevance. As cable theory considers a single cable only, interpretation of decay function measures may become blurred.
The EC layer is well coupled and largely nonexcitatory; opposed to the SMC layer, it harbors no voltage-gated and only few Ca2+-gated ion channels (e.g., SKCa and CaCC). Although ion channel activity is still nonlinear, the direct effect from voltage-gated channels is avoided. Consequently, the Vm-profile in this layer is well fitted by a single exponential. Hyperpolarizing the stimulation site to Vm = −70 mV led to similar but inverted shapes of the Vm-profiles (not shown). The poor conductance between SMCs leaves long distance signaling a property of the EC layer only.
Fig. 4 A shows the current dissipation from SMCs along the vessel upon EC and SMC stimulation, respectively (corresponds to solid curves in Fig. 3). The theory of electrical cables is based on Ohm's law, V = R · I, which relates voltage, V, across a component with current, I, in a linear fashion. For electrical components, R is a constant independent of V or I. In electrochemical systems, however, I and V also depend on concentration differences. As a consequence, in most cases it is not possible to define a constant Ohmic resistance for the plasma membrane. In Fig. 4 we have defined the plasma membrane resistance as RPM = (Vm – Vm,rest)/IPM), where IPM is the net total current passing through a SMC plasma membrane at the membrane potential Vm at the relevant position along the vessel axis. Vm,rest is the resting potential before application of stimulus. The resulting resistance is clearly not constant but depends on the local Vm. Because RPM is not constant along the vessel, the correlation between cable theory and the decay function is lost, rendering the decay function a phenomenological measure.
Figure 4.
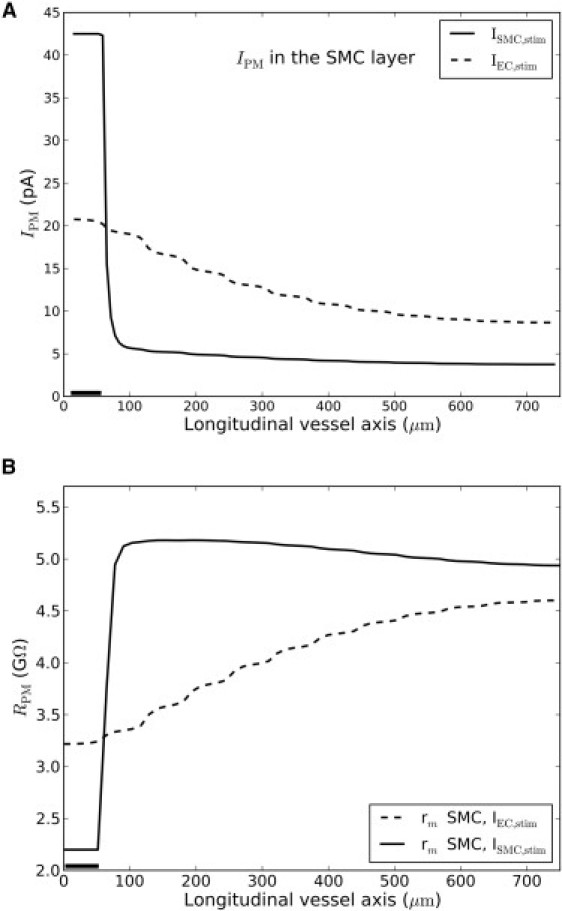
Current dissipation in and membrane resistance of single SMC's along the vessel axis. (Solid bar) Small segment of either the EC layer (dashed curve) or SMC layer (solid curve) that was voltage-clamped to −20 mV for 1.6 s. (A) Sum of dissipative membrane currents. (B) Calculated membrane resistance along the SMC layer, calculated as RPM = (Vm – Vm,rest)/IPM. As seen, resistance changes along the vessel axis.
To ascertain that the linear method of reflection left the measured length-constant of simulations independent of vessel length, vessel models of different lengths but otherwise identical properties were constructed. As shown in Fig. 5, Eq. 3 yielded the same length-constant irrespective of vessel length.
Voltage decay function
To assess the goodness of fits of the decay function, Eq. 3 was applied to simulations of conducted responses with different gap junctional permeabilities. Specifically, MEGJ and SMC-SMC couplings were varied so as to achieve situations with 1), two almost independent cables (low MEGJ coupling); 2), two layers, but a single cable (high MEGJ coupling); and 3), two interacting cables where both cables are capable of longitudinal conduction. We only considered depolarizing voltage-clamps as this would have the largest impact on voltage-gated ion channels.
In Fig. 6 A the decay function (Eq. 3 and a sum of two exponentials with reflection (Eq. 4) were fitted to ΔVm-profiles of the SMC layer with MEGJ coupling scaled to 0.01 or 10.0 times the original value, respectively. If MEGJ coupling is very high, the vessel behaves approximately as a single electrical cable and the decay function fit the profile well (Fig. 6 A, solid curve). With less MEGJ coupling, the input resistance within the SMC layer becomes high and the decay function may only fit either the local stimulation area or the conducted area (Fig. 6 A, shaded curve). Equation 4 fits the profiles in any case and the longer length-constant is virtually identical to a decay function fit to the conducted area of the profile. Again, note that the length-constant to the curve of low MEGJ coupling (Fig. 6 A, shaded curve) is very high, but has a very low conducted ΔVm.
Figure 6.
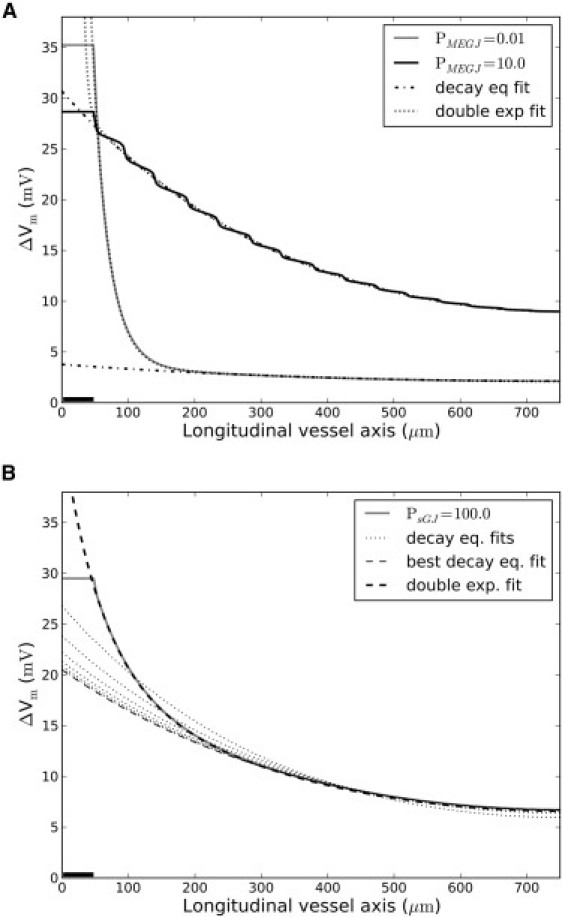
Goodness-of-decay-function fits. The decay function (Eq. 3) and a sum of two exponentials with reflection (Eq. 4) were fitted to simulated conduction profiles in the SMC layer. (Solid bars) Segments voltage-clamped to −20 mV for 1.6 s. (A) MEGJ coupling was either multiplied with 0.01 (shaded curve) or 10.0 (solid curve). With high MEGJ coupling, the vessel behaves virtually as a single cable (no local spike) and the decay function fits the profile well. With low MEGJ coupling, the decay function only fits part of the profile. Equation 4 (dotted lines) fits the profiles well in both cases. Length-constants of Eqs. 3 and 4 were virtually equal. (B) SMC:SMC coupling was multiplied with 102 (shaded curve). (Dotted lines) Decay function fits to increasingly smaller parts of the profile. The first fit starts from the stimulation site; subsequent fits start further and further away. The best decay function fit (light-shaded stippled line) starts 250 μm from the stimulation site. Thus, the decay function fits well to the area, dominated by conduction through the EC layer only. Equation 4 fits the profile well throughout (solid stippled line).
As shown in Fig. 6 B, an increase in SMC-SMC coupling reduces the goodness of a decay function fit. However, the decay function fit improves if applied to profile parts where conduction through the SMC layer taper off and conduction is conveyed through the EC layer only. Thus, neglecting the first ∼350 μm of the profile (i.e., considering conduction in the EC layer exclusively) is associated with a good decay function fit. Application of a sum of two exponentials again fits to the whole conduction profile.
In all cases, ΔVm-profiles of the EC layer fit well to the decay function. This is due to the low input resistance of this cell layer (i.e., the layout of the cells and the rather high EC-EC coupling). We conclude that the decay function may fit well to a conducted signal if 1), the coupling between ECs is much larger than between SMCs (or vice versa), or 2), if the MEGJ permeability is either very high or very low, such that the two layers will behave as either a single or two separate cables, respectively.
Reaching steady state
Experiments assessing conduction uses the decay function for estimation of length-constants but the measured data are usually maximal Vm or dilatation (7,25). As mentioned previously, the decay function is based on steady state. After application of a stimulus, but before pseudo-steady state is reached, the open probability of the ion channels changes dynamically and the decay function measures very different length-constants at intermediary time points. Fig. 7 shows the relative change in length-constants (compared to the smallest length-constant at pseudo-steady state) for depolarizing and hyperpolarizing stimuli, respectively. In both cases, conduction is stronger initially—far from the pseudo-steady state. As activation/inactivation of many ion channels have slower dynamics than the gap junctions (in the model, these are essentially open pores passable by electrolytes), a strong electrical stimulus may initially spread longitudinally through gap junctions before the dissipatory channels become fully activated. Consequently, longer nonsteady-state length-constants are obtained.
Figure 7.
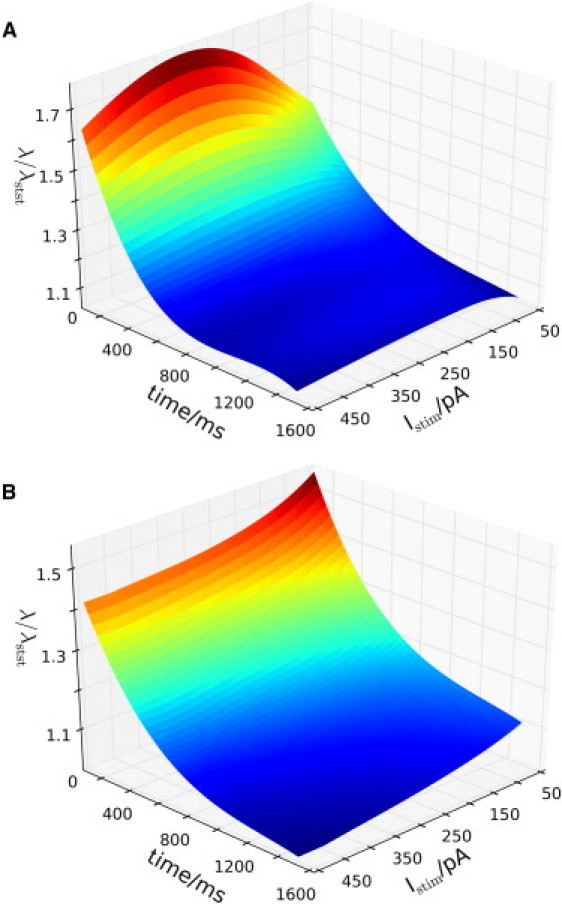
Dynamics of fitted length-constant changes during decay toward pseudo-steady state. A short segment of the EC layer was stimulated with different amounts of depolarizing (A) or hyperpolarizing (B) current for 1.6 ms and the resulting voltage spread was fitted to the decay function at intermediary time points. The figures represent spline curves fitted to (time, Istim, λ/λmin)-points. It is seen that length-constants are longer initially, but as the system approach pseudo-steady state, the size of the length-constants taper off and become relatively independent of stimulation amplitude. Values used for normalization in panels A and B were 401 μm and 389 μm, respectively.
If the applied stimulus is ramped instead of instantaneous, the picture is different, as shown in Fig. 8. Only the shape of stimulation (Fig. 8 A) is different between Fig. 8 B and Fig. 7 A, showing that slow (i.e., ramped) stimuli, initially, conducts shorter compared to fast (i.e., instantaneous) stimuli.
Figure 8.
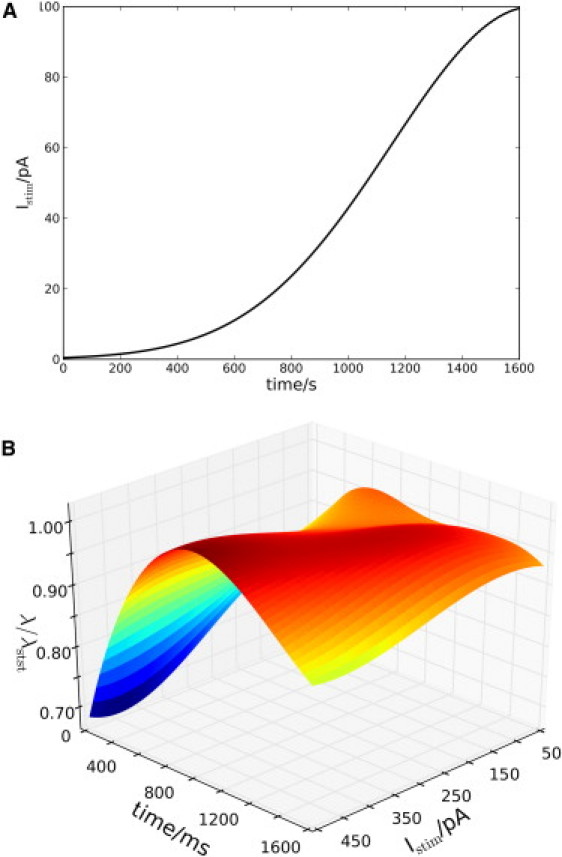
Same as in Fig. 7A, except for the stimulation profile. (A) The ramped stimulation profile used in panel B (here with Imaxstim = 100 pA). (B) Dynamics of fitted length-constant changes. Values scaled according to the longest length-constant of 567 μm.
Moreover, the nonlinearity of the system is evident when considering stimulation amplitude. In Fig. 7 A, stronger stimuli produce fits of larger initial length-constants up to a certain threshold. At very high stimulation levels, the length-constant decreases. This is due to the simultaneous activation of high conductance ion channels as the vessel becomes highly depolarized. At pseudo-steady state, however, the length-constant only changes little in response to stimulation amplitude.
Discussion
In this article, we investigate 1), the applicability of cable theory in microcirculation, and 2), the distinction between the decay function (cable theory) and a phenomenological exponential function to fit conduction profiles. The decay function is basically a single exponential function able to fit adequately to experimental (7) and simulated (11) results of electrotonic spread of voltage along small blood vessels. However, the implied mechanistic of cable theory is actually not applicable in the context of a small arteriole. This limits conclusions and interpretations based on cable theory within the vasculature but does not exclude considerate use of a phenomenological exponential function for characterizing conduction. In the following, we make a distinction between the decay function and an exponential function (even though they are mathematically identical) due to the association of the decay function with cable theory.
To test the cable equation assumptions we employed a comprehensive and morphologically realistic model of rat mesenteric arterioles composed of established models of specific ion channels. The following conclusions were drawn: 1), Most assumptions behind cable theory are violated when applied to arterioles. Most importantly, current dissipation across the membranes (i.e., membrane resistance, rm) depends nonlinearly on Vm and hence, is not constant along the vessel length axis. 2), The exponential function, however, fits rather well to almost all simulation profiles, especially if applied to areas far from the stimulation point, i.e., the conducted region relevant in this context. It is therefore valid as a phenomenological description. 3), Many experiments are conducted without consideration of the steady-state requirement of cable theory. This makes any reference to the decay function problematic. Again, this does not interfere with the ability of an exponential fit to be applicable at pseudo-steady state or during decay to steady state. Furthermore, the simulations suggest that voltage profiles obtained before stationarity is reached, have longer length-constants as compared to the pseudo-steady-state situation. Taken together, violation of the cable theory assumptions reduces the decay function to a phenomenological exponential function and the length-constant to a phenomenological measure. Consequently, one cannot assume, a priori, that the length-constant be independent of stimulation amplitude or resting potential (26). That is, changes in Vm,rest due to, e.g., altered transmural pressure or blood flow, may likely lead to changes of the length-constant.
The ability of an exponential function to fit many experimental and simulated profiles, however, suggests that the conduction process is actually close to being linear. Thus, cable theory does provide a sensible scaffold for the understanding of electrical processes in the vasculature. However, for a mechanistic theory, models that consider the nonlinear nature of most ion channels and electrochemical systems have to be used.
The decay function
The length-constant, λ, derived from cable theory is a widely used measure of conduction due to its relative ease of implementation and its theoretical simplicity. In the literature, the length-constant varies from ∼0.5 to 2.0 mm (see Table S5) depending on type of vessel and agonist/stimulus used. The obtained length-constants from the simulations lies in the lower end of this range, as does the experimentally observed length-constants from rat mesenteric arterioles.
Though calculation of RPM can be ill defined in the case of vascular cells, it is clear that current dissipates nonlinearly along the length of the arteriole. This is also expected given the voltage dependence of many ion channels, e.g., BKCa, KV, and L-type Ca2+ channels.
Furthermore, the decay function is based on a steady-state condition that is rarely (if ever) fulfilled in the ever-changing environment of the adaptive microcirculation. As we show in Fig. 7, an exponential fit may be adequate in the situation where the system is decaying toward the pseudo-steady state—a situation where the decay function theoretically is ill defined.
Why then, does an exponential function tend to produce good fits to conduction data? Although no definitive answer can be given, a number of reasons can be put forth:
-
1.
Because the SMC layer is a low conductance pathway for current spread (as also found in experimental studies (27–30)), conduction is only dependent on a single functional EC layer cable, which, due to the apparent lack of voltage-gated ion channels, will be less nonlinear than the SMC layer.
-
2.
An exponential function is capable of fitting to many decaying datasets and also in mechanistically inappropriate cases. For example, second-order kinetics may, in many parameter ranges, be well characterized by an exponential function even though the mechanism is highly nonlinear (31).
-
3.
The relative changes in membrane resistance along the vessel length axis, i.e., the conducted area fitted by an exponential function in the simulations, are not too big (see Fig. 4 B). Small relative changes reduce the nonlinearities of the system.
Fitting the decay function to the conducted region only is a violation of cable theory that requires an exponential function to fit the whole range from the stimulation site. Moreover, the resulting phenomenological length-constant of the conducted area may be of limited value if ΔVm-data fitted are too small to have physiological impact (Fig. 3 B). Experimentally, a stimulus with a low conducted ΔVm will be undetectable, and only lead to a local response.
Along the same lines of argument, the interpretation of the length-constant is problematic when comparing measurements of different stimulus application times. As the system is in a dynamic state, the conduction profile will change (albeit increasingly slowly), leading to different values of length-constant and ΔVm (see Fig. 7 and Fig. S3).
The decay function has been used as the theoretical basis for estimating approximate length-constants. The appropriateness of its use is hard to verify experimentally as electrode impalement typically does not allow for precise spatial resolution (4,7,32). Moreover, as fits to exponential functions tend to be good, the acceptance of cable theory in arteriolar blood vessels has been straightforward. However, a linear theory can never explain autonomous oscillatory behavior often observed in the vasculature, e.g., Ca2+-waves and vasomotion. Furthermore, it may compromise physiological interpretation or preclusions of certain phenomena. For example, application of acetylcholine (ACh) is found to have longer length-constants than electrical stimuli (7,33). Cable theory predicts that the length-constant be independent of stimulation amplitude. Consequently, it is speculated that passive electrotonic spread cannot explain ACh conduction lengths. Full or partial regeneration of the ACh signal is often put forth to explain the discrepancy (34–36). However, regeneration is a nonlinear property, again illustrating the futility of focusing on a linear model.
Experimental ACh applications are brief and the onsets of hyperpolarization occur consistently within <500 ms, irrespective of distance along the arteriole from the ACh micropipette (33). Thus, we propose that a part of the strong, ACh-induced vasodilatation may arise due to rapid and strong hyperpolarizations at nonsteady state (see Fig. 7 B). The dynamical activation and inactivation of most ion channels and a differential response to fast and strong stimuli, i.e., nonlinearity of the system, may be a simple answer to complex behaviors that cannot be addressed by a linear model. Initial strong conduction of hyperpolarization adds well to the recent finding that unattenuated dilatation is due to a threshold in the dilatation response to hyperpolarization in skeletal muscle arterioles (25).
Experimental recordings of conduction
Experimental investigations of conduction usually record either diameter or Vm changes along the vessel. The decay function is naturally applied only to Vm data, which are recorded using a single or dual microelectrode measurements (4,7) and is thus of limited spatial resolution.
Change of diameter is the physiological response to a conducted electrical signal and is easily recorded (37,38). But diameter change is a highly integrative response, involving changes in [Ca2+]i, Ca2+ sensitivity, etc., and seems to depend nonlinearly on membrane potential (25). It is therefore not easy to make inferences into the mechanisms of conduction by diameter changes alone.
A more recent means of investigating conduction is fluorescent measurements of Ca2+ (39–41). Even though [Ca2+] does not have a linear relationship with ΔVm changes, an exponential function may well be applied to Ca2+ measurement data. Because the assumptions of cable theory fail in arteries and arterioles, an exponential fit to Δ[Ca2+] data or ΔVm data have equal preference. Fluorescence measurements of [Ca2+] can be done with high spatial and temporal resolution, leaving Ca2+ a particularly interesting indicator, at least as applied to conducted vasoconstriction (provided that voltage-gated Ca2+-channels are present in the vessel preparation). Arguably, [Ca2+] is closer to the functional outcome of conduction (vasodilatation or vasoconstriction) than is membrane potential.
Conclusion
In summary, we have used a comprehensive electrophysiological model to show that the linear cable theory is limited in its applicability in the microcirculation. Thus, physiological interpretations of measured length-constants based on cable theory are equally limited. Cable theory should therefore only be viewed as a simple scaffold for understanding conduction processes, and not as an accurate mechanistic model.
Development of theoretical models that integrate electrical and biochemical responses may assist fruitfully in experimental setups that measure, e.g., [Ca2+] to investigate conduction. Models of the relevant electrophysiological system are well suited to capture the mechanistic link between electrophysiology and the observed physiological responses.
Use of exponential fits are in most cases acceptable as phenomenological measures of conduction strength. A sum of exponentials showed especially good fits to conduction profiles irrespective of the ion channel nonlinearity. Furthermore, the model predicts that an instantaneous stimulus conducts strongly initially, i.e., before reaching pseudo-steady state (if gap junctions are open). At pseudo-steady state, however, the model predicts only little dependence of the length-constant on stimulation strength. The fast and slow transients of the system imply that the measured length-constant also depends on time—in particular, the application time of the stimulus. Thus, development of models that incorporate the nonlinearity of microvascular electrophysiology is needed for advancing the understanding of information transfer in the microcirculation. Additionally, this would allow for the use of better-suited experimental techniques for studying conduction processes.
Table 1.
Abbreviations used in the model
| Abbreviation | Name | Abbreviation | Name |
|---|---|---|---|
| Common for EC and SMC | |||
| NCX | Na+-Ca2+ cxchanger current | NKA | Na/K ATPase pump |
| NKCC | Na/K/2Cl cotransport | NSC | Nonselective cation channel |
| SOC | Store-operated cation current | ERleak | ER leakage current |
| IP3R | IP3 ER receptor channel currents | SERCA | SR Ca-ATPase pump |
| PMCA | Plasma membrane Ca2+-ATPase | ClCa | Ca2+-activated chloride channel |
| IP3 | Inositol-tri-phosphate | CSQN | Calsequestrin |
| EC-specific | |||
| Kir | Inward rectifier current | CM | Calmodulin |
| KCa | Ca2+-activated potassium currents | VRAC | Volume-regulated anion channel |
| SMC-specific | |||
| CaL | Large-conductance Ca2+ channel | BKCa | Big Ca2+-activated K+-channel |
| KATP | ATP-dependent K+ channel current | KV | Voltage-gated K+-channel |
| Bfr | Calcium buffers | ||
Acknowledgments
This work was supported by the European Union through Network of Excellence BioSim Contract No. LSHB-CT-2004-005137. B.O.H. was a recipient of a PhD fellowship from the Faculty of Health Sciences, University of Copenhagen.
Supporting Material
References
- 1.Dora K.A., Sandow S.L., Garland C.J. Myoendothelial gap junctions may provide the pathway for EDHF in mouse mesenteric artery. J. Vasc. Res. 2003;40:480–490. doi: 10.1159/000074549. [DOI] [PubMed] [Google Scholar]
- 2.Schmidt V.J., Wölfle S.E., de Wit C. Gap junctions synchronize vascular tone within the microcirculation. Pharmacol. Rep. 2008;60:68–74. [PubMed] [Google Scholar]
- 3.Hodgkin A.L., Rushton W.A.H. The electrical constants of a crustacean nerve fiber. Proc. R. Soc. Med. 1946;134:444–479. doi: 10.1098/rspb.1946.0024. [DOI] [PubMed] [Google Scholar]
- 4.Hirst G.D., Neild T.O. An analysis of excitatory junctional potentials recorded from arterioles. J. Physiol. 1978;280:87–104. doi: 10.1113/jphysiol.1978.sp012374. [DOI] [PMC free article] [PubMed] [Google Scholar]
- 5.Crane G.J., Neild T.O. An equation describing spread of membrane potential changes in a short segment of blood vessel. Phys. Med. Biol. 1999;44:N217–N221. doi: 10.1088/0031-9155/44/10/402. [DOI] [PubMed] [Google Scholar]
- 6.Gustafsson F., Holstein-Rathlou N. Conducted vasomotor responses in arterioles: characteristics, mechanisms and physiological significance. Acta Physiol. Scand. 1999;167:11–21. doi: 10.1046/j.1365-201x.1999.00603.x. [DOI] [PubMed] [Google Scholar]
- 7.Emerson G.G., Neild T.O., Segal S.S. Conduction of hyperpolarization along hamster feed arteries: augmentation by acetylcholine. Am. J. Physiol. Heart Circ. Physiol. 2002;283:H102–H109. doi: 10.1152/ajpheart.00038.2002. [DOI] [PubMed] [Google Scholar]
- 8.Jacobsen J.C.B., Aalkjaer C., Holstein-Rathlou N.H. Heterogeneity and weak coupling may explain the synchronization characteristics of cells in the arterial wall. Philos. Transact. A Math. Phys. Eng. Sci. 2008;366:3483–3502. doi: 10.1098/rsta.2008.0105. [DOI] [PubMed] [Google Scholar]
- 9.Aalkjaer C., Nilsson H. Vasomotion: cellular background for the oscillator and for the synchronization of smooth muscle cells. Br. J. Pharmacol. 2005;144:605–616. doi: 10.1038/sj.bjp.0706084. [DOI] [PMC free article] [PubMed] [Google Scholar]
- 10.Bartlett I.S., Crane G.J., Segal S.S. Electrophysiological basis of arteriolar vasomotion in vivo. J. Vasc. Res. 2000;37:568–575. doi: 10.1159/000054090. [DOI] [PubMed] [Google Scholar]
- 11.Kapela A., Nagaraja S., Tsoukias N.M. A mathematical model of vasoreactivity in rat mesenteric arterioles. II. Conducted vasoreactivity. Am. J. Physiol. Heart Circ. Physiol. 2010;298:H52–H65. doi: 10.1152/ajpheart.00546.2009. [DOI] [PMC free article] [PubMed] [Google Scholar]
- 12.Fall, C. P., E. S. Marland, …, J. J. Tyson, editors. 2002. Computational Cell Biology. Springer-Verlag, New York.
- 13.Crane G.J., Hines M.L., Neild T.O. Simulating the spread of membrane potential changes in arteriolar networks. Microcirculation. 2001;8:33–43. [PubMed] [Google Scholar]
- 14.Keener J., Sneyd J. Springer; New York: 1998. Mathematical Physiology. [Google Scholar]
- 15.Holt, G. 1998. A critical reexamination of some assumptions and implications of cable theory in neurobiology. PhD thesis, California Institute of Technology, Pasadena, CA.
- 16.Jack J., Noble D., Tsien R.W. Oxford University Press; Oxford, UK: 1983. Electric Current Flow in Excitable Cells. [Google Scholar]
- 17.Haas T.L., Duling B.R. Morphology favors an endothelial cell pathway for longitudinal conduction within arterioles. Microvasc. Res. 1997;53:113–120. doi: 10.1006/mvre.1996.1999. [DOI] [PubMed] [Google Scholar]
- 18.Sandow S.L., Hill C.E. Incidence of myoendothelial gap junctions in the proximal and distal mesenteric arteries of the rat is suggestive of a role in endothelium-derived hyperpolarizing factor-mediated responses. Circ. Res. 2000;86:341–346. doi: 10.1161/01.res.86.3.341. [DOI] [PubMed] [Google Scholar]
- 19.Silva H.S., Kapela A., Tsoukias N.M. A mathematical model of plasma membrane electrophysiology and calcium dynamics in vascular endothelial cells. Am. J. Physiol. Cell Physiol. 2007;293:C277–C293. doi: 10.1152/ajpcell.00542.2006. [DOI] [PubMed] [Google Scholar]
- 20.Kapela A., Bezerianos A., Tsoukias N.M. A mathematical model of Ca2+ dynamics in rat mesenteric smooth muscle cell: agonist and NO stimulation. J. Theor. Biol. 2008;253:238–260. doi: 10.1016/j.jtbi.2008.03.004. [DOI] [PubMed] [Google Scholar]
- 21.Kapela A., Bezerianos A., Tsoukias N.M. A mathematical model of vasoreactivity in rat mesenteric arterioles. I. Myoendothelial communication. Microcirculation. 2009;16:694–713. doi: 10.3109/10739680903177539. [DOI] [PMC free article] [PubMed] [Google Scholar]
- 22.Hindmarsh A.C., Brown P.N., Woodward C.S. SUNDIALS: suite of nonlinear and differential/algebraic equation solvers. ACM Trans. Math. Softw. 2005;31:363–396. [Google Scholar]
- 23.Diep H.K., Vigmond E.J., Welsh D.G. Defining electrical communication in skeletal muscle resistance arteries: a computational approach. J. Physiol. 2005;568:267–281. doi: 10.1113/jphysiol.2005.090233. [DOI] [PMC free article] [PubMed] [Google Scholar]
- 24.Chandra F.A., Buzi G., Doyle J.C. Glycolytic oscillations and limits on robust efficiency. Science. 2011;333:187–192. doi: 10.1126/science.1200705. [DOI] [PubMed] [Google Scholar]
- 25.Wölfle S.E., Chaston D.J., Hill C.E. Non-linear relationship between hyperpolarization and relaxation enables long distance propagation of vasodilatation. J. Physiol. 2011;589:2607–2623. doi: 10.1113/jphysiol.2010.202580. [DOI] [PMC free article] [PubMed] [Google Scholar]
- 26.Hald B.O., Jacobsen J.C.B., Jensen L.J. BKCa and KV channels limit conducted vasomotor responses in rat mesenteric terminal arterioles. Pflugers Arch. 2012;463:279–295. doi: 10.1007/s00424-011-1049-8. [DOI] [PubMed] [Google Scholar]
- 27.Hakim C.H., Jackson W.F., Segal S.S. Connexin isoform expression in smooth muscle cells and endothelial cells of hamster cheek pouch arterioles and retractor feed arteries. Microcirculation. 2008;15:503–514. doi: 10.1080/10739680801982808. [DOI] [PMC free article] [PubMed] [Google Scholar]
- 28.Looft-Wilson R.C., Payne G.W., Segal S.S. Connexin expression and conducted vasodilation along arteriolar endothelium in mouse skeletal muscle. J. Appl. Physiol. 2004;97:1152–1158. doi: 10.1152/japplphysiol.00133.2004. [DOI] [PubMed] [Google Scholar]
- 29.Emerson G.G., Segal S.S. Endothelial cell pathway for conduction of hyperpolarization and vasodilation along hamster feed artery. Circ. Res. 2000;86:94–100. doi: 10.1161/01.res.86.1.94. [DOI] [PubMed] [Google Scholar]
- 30.Sandow S.L., Looft-Wilson R., Hill C.E. Expression of homocellular and heterocellular gap junctions in hamster arterioles and feed arteries. Cardiovasc. Res. 2003;60:643–653. doi: 10.1016/j.cardiores.2003.09.017. [DOI] [PubMed] [Google Scholar]
- 31.Atkins P., de Paula J. 9th ed. Oxford University Press; Oxford, UK: 2009. Atkins' Physical Chemistry. [Google Scholar]
- 32.Hirst G.D., Neild T.O. Some properties of spontaneous excitatory junction potentials recorded from arterioles of guinea-pigs. J. Physiol. 1980;303:43–60. doi: 10.1113/jphysiol.1980.sp013269. [DOI] [PMC free article] [PubMed] [Google Scholar]
- 33.Crane G.J., Neild T.O., Segal S.S. Contribution of active membrane processes to conducted hyperpolarization in arterioles of hamster cheek pouch. Microcirculation. 2004;11:425–433. doi: 10.1080/10739680490457836. [DOI] [PubMed] [Google Scholar]
- 34.de Wit C. Different pathways with distinct properties conduct dilations in the microcirculation in vivo. Cardiovasc. Res. 2010;85:604–613. doi: 10.1093/cvr/cvp340. [DOI] [PubMed] [Google Scholar]
- 35.Figueroa X.F., Duling B.R. Dissection of two Cx37-independent conducted vasodilator mechanisms by deletion of Cx40: electrotonic versus regenerative conduction. Am. J. Physiol. Heart Circ. Physiol. 2008;295:H2001–H2007. doi: 10.1152/ajpheart.00063.2008. [DOI] [PMC free article] [PubMed] [Google Scholar]
- 36.Figueroa X.F., Paul D.L., Duling B.R. Central role of connexin40 in the propagation of electrically activated vasodilation in mouse cremasteric arterioles in vivo. Circ. Res. 2003;92:793–800. doi: 10.1161/01.RES.0000065918.90271.9A. [DOI] [PubMed] [Google Scholar]
- 37.Gustafsson F., Holstein-Rathlou N.H. Angiotensin II modulates conducted vasoconstriction to norepinephrine and local electrical stimulation in rat mesenteric arterioles. Cardiovasc. Res. 1999;44:176–184. doi: 10.1016/s0008-6363(99)00174-1. [DOI] [PubMed] [Google Scholar]
- 38.de Wit C., Roos F., Pohl U. Impaired conduction of vasodilation along arterioles in connexin40-deficient mice. Circ. Res. 2000;86:649–655. doi: 10.1161/01.res.86.6.649. [DOI] [PubMed] [Google Scholar]
- 39.McSherry I.N., Spitaler M.M., Dora K.A. Endothelial cell Ca2+ increases are independent of membrane potential in pressurized rat mesenteric arteries. Cell Calcium. 2005;38:23–33. doi: 10.1016/j.ceca.2005.03.007. [DOI] [PubMed] [Google Scholar]
- 40.Tallini Y.N., Brekke J.F., Kotlikoff M.I. Propagated endothelial Ca2+ waves and arteriolar dilation in vivo: measurements in Cx40BAC GCaMP2 transgenic mice. Circ. Res. 2007;101:1300–1309. doi: 10.1161/CIRCRESAHA.107.149484. [DOI] [PubMed] [Google Scholar]
- 41.Braunstein T.H., Inoue R., Jensen L.J. The role of L- and T-type calcium channels in local and remote calcium responses in rat mesenteric terminal arterioles. J. Vasc. Res. 2009;46:138–151. doi: 10.1159/000151767. [DOI] [PubMed] [Google Scholar]
Associated Data
This section collects any data citations, data availability statements, or supplementary materials included in this article.