

Abstract
Store-operated calcium entry (SOCE) is a ubiquitous mechanism that is mediated by distinct SOC channels, ranging from the highly selective calcium release-activated Ca2+ (CRAC) channel in rat basophilic leukemia and other hematopoietic cells to relatively Ca2+-selective or non-selective SOC channels in other cells. Although the exact composition of these channels is not yet established, TRPC1 contributes to SOC channels and regulation of physiological function of a variety of cell types. Recently, Orai1 and STIM1 have been suggested to be sufficient for generating CRAC channels. Here we show that Orai1 and STIM1 are also required for TRPC1-SOC channels. Knockdown of TRPC1, Orai1, or STIM1 attenuated, whereas overexpression of TRPC1, but not Orai1 or STIM1, induced an increase in SOC entry and ISOC in human salivary gland cells. All three proteins were co-localized in the plasma membrane region of cells, and thapsigargin increased co-immunoprecipitation of TRPC1 with STIM1, and Orai1 in human salivary gland cells as well as dispersed mouse submandibular gland cells. In aggregate, the data presented here reveal that all three proteins are essential for generation of ISOC in these cells and that dynamic assembly of TRPC1-STIM1-Orai1 ternary complex is involved in activation of SOC channel in response to internal Ca2+ store depletion. Thus, these data suggest a common molecular basis for SOC and CRAC channels.
Store-operated Ca2+ entry (SOCE)6 is stimulated in response to depletion of Ca2+ from intracellular Ca2+ stores (primarily the endoplasmic reticulum (ER)) and is mediated via the activation of specific plasma membrane channels, termed store-operated calcium (SOC) channels. SOCE is ubiquitously expressed in all cell types and critically regulates a variety of cellular functions ranging from T-lymphocyte activation, smooth muscle contraction, platelet aggregation, fluid and protein secretion, to regulation of cell growth and proliferation (1–3). Despite intense focus on SOCE over the past two decades neither the mechanism(s) by which the status of Ca2+ in the ER is transmitted to the plasma membrane, to activate or inactivate SOC channels, nor the molecular components of the channels have yet been identified. Interestingly, the characteristics of these channels in different cell types are quite distinct, suggesting diversity in the channel components (2,4–6). The first SOC channel to be identified was the highly Ca2+-selective, calcium release-activated calcium (CRAC) channel, which is found in T-lymphocytes, RBL, and other hematopoietic cells (7, 8). However, similar measurements in other cell types such as salivary gland, endothelial, and smooth muscle cells have demonstrated the presence of different types SOC channels, which range from non-selective to relatively Ca2+-selective (2, 4–6, 9). Although the physiological significance of such diversity in SOC channels is not clear, it is important to consider whether all these channels are activated by the same signal generated in response to internal Ca2+ store depletion or whether internal Ca2+ store depletion induces multiple intracellular signals that act on different channels.
Members of the transient receptor potential canonical (TRPC) family of channels have been proposed as components of SOC channels (2–4, 9–11). Although several TRPC members, e.g. TRPC4, TRPC3, and TRPC7, have been reported to be activated by internal Ca2+ store depletion, the data are most consistent for TRPC1. This protein has been shown to be required for SOCE in several different cell types, including salivary gland, HEK293, smooth muscle, endothelial, DT 40 cells, and platelets (4, 9, 12–15). These findings have been further substantiated by studies demonstrating that TRPC1 contributes to the Ca2+ permeability of SOC channels in several cell types, including salivary gland and smooth muscle cells (2,4,10, 11, 16, 17). With the exception of a few studies that implicate TRPCs in CRAC function in lymphocytes (7, 8, 18) the molecular components of the CRAC channel are largely unknown. Recently two new proteins have emerged as candidate components of SOCE: STIM1 and Orai1. STIM1 is a single-transmembrane protein that has an unpaired EF-hand domain in the N terminus, which has been predicted to be localized in the ER lumen (19). Knockdown of STIM1 expression using siRNA significantly reduced SOCE in HEK293, SH-SY5Y, Jurkat T, and HeLa cells (20, 21). In contrast, overexpression of STIM1 only modestly enhanced SOCE in HEK293 cells (22). Additionally, STIM1 was relocalized into punctae in the subplasma membrane region following stimulation by thapsigargin (Tg) (20). The EF-hand domain of STIM1 has been suggested to function as the ER-Ca2+ sensor regulating SOCE (20). However, the exact mechanism by which STIM1 regulates SOCE is not yet known. The second protein, Orai1, is a four-transmembrane domain protein that was initially suggested to be a plasma membrane-localized regulatory protein for ICRAC. Mutations in Orai1 have been genetically linked to severe combined immunodeficiency, and T-lymphocytes isolated from patients with severe combined immunodeficiency displayed decreased ICRAC activity (23). Knockdown of Orai1 decreases SOCE, whereas expression of Orai1 with mutations in conserved negatively charged residues changes the Ca2+ selectivity of CRAC channel (24–27). Co-expression of Orai1 with STIM1 greatly enhances CRAC channel activity (28 –30). Because Orai1 and STIM1 can reconstitute the ICRAC current, it has been suggested that they are sufficient for the formation of this channel.
We have previously reported that TRPC1 is an essential component of the SOC channels in salivary gland cells (13, 16, 31–33). Our data demonstrated that knockdown of TRPC1 decreases SOCE, overexpression increases the activity, whereas expression of TRPC1 with mutations in the proposed pore region of this protein alters the Ca2+ permeability of the channel. In the present study, we have investigated the possible role of STIM1 and Orai1 in TRPC1-dependent SOCE. The data presented here reveal that all three proteins are essential for generation of TRPC1-SOC channels. We show that STIM1 regulation of TRPC1-SOC is similar to its regulation of ICRAC. Further, we report that dynamic assembly of a TRPC1-STIM1-Orai1 complex is involved in activation of Ca2+ entry. These data reveal common components of SOC and CRAC channels that contribute toward their store-dependent regulation and function.
Experimental Procedures
Materials
Fura-2AM and thapsigargin (Tg) were obtained from Calbiochem (San Diego, CA). Glass-bottomed 35-mm Petri dishes were obtained from MatTek Corp. (Ashland, MA), and glass coverslips were from Fischer Scientific (Pittsburgh, PA). Anti-STIM1 antibody was obtained from BD Biosciences (San Jose, CA), anti-Myc antibody was from Cell Signaling Technology (Danvers, MA), anti-HA antibody was from Roche Applied Science (Indianapolis, IN), and anti-FLAG antibody was from Sigma-Aldrich. Cy5- and fluorescein isothiocyanate- and TRITC-tagged secondary antibodies were obtained from Jackson ImmunoResearch (West Grove, PA). STIM1 and Orai1 siRNAs were obtained from Dharmacon (Lafayette, CO).
Cell Culture and Transient Transfection
HSG, RBL-2H3, HEK-293, and A7r5 cells were cultured as described previously (6, 22). Cells were transfected with the required vector as described previously (33) and used for experiments after 48 h Vectors encoding green fluorescent protein were co-transfected (1:5 ratio of cDNA) to allow selection of cells for all functional experiments. Cells were transfected with siRNAs using the DharmaFECT transfection reagent as per the manufacturer's instructions and used after 48 h. Sequences for the shRNA targeting human TRPC1 were similar to previously described siRNA sequence (15). The sense sequence (5′-CACCGGG-TGACTTTATATGGTTCGAAAACCATATAATAGTCA-CCC-3′) and antisense sequence (5′-AAAAGGGTGACTA-TTATATGGTTTTCGAACCATATAATAGTCACCC-3′) was obtained from Integrated DNA Technologies (Coralville, IA), hybridized in equal molar ratio, and ligated into pENTR/U6 vector (Invitrogen). 1 μg/ml TRPC1-shRNA (shTRPC1) plasmid was transfected into HSG cells. Construction of TRPC1 mutants has been reported earlier (16). For live cell-imaging experiments, cells were plated on glass-bottomed MatTek tissue culture dishes. For patch clamp measurement and TIRF microscopy, cells were plated on glass coverslips.
RNA Isolation, Synthesis of First-strand cDNA, and RT-PCR Analysis
RNA isolation, synthesis of first-strand cDNA, and RT-PCR analysis were conducted using methods described previously (23, 32). Sequences of primers (Integrated DNA Technologies), used to detect the Orai1 transcript, were as follows: 5′-CAGCAGCCAACGTCAGCACCA-3′ and 3′-CAGCTGG-TCCTGTAAGCGGGCAAA-5′. In Fig. 1, -ve control indicates the buffer control, whereas +ve control indicates the human cDNA aliquot provided in the RT-PCR kit, FastStart High Fidelity PCR system from Roche Applied Sciences. The PCR product was sequenced and confirmed to be the Orai1 transcript.
FIGURE 1. Effect of knockdown of TRPC1,Orai1, or STIM1 on SOC channel function.

Cells were transfected with shTRPC1 (A), STIM1 siRNA(B),or Orai1 siRNA (C), and Tg-stimulated SOCE was measured 48 h after transfection. [Ca2+]i was measured in Fura-2AM-loaded cells and is expressed as 340/380 ratio (black traces, cells transiently transfected with control vector; red traces, shRNA or siRNA vectors). D, current traces in this and subsequent figures represent the amplitude at –80 mV (inward current) and 80 mV (outward current) recorded during voltage ramps (1 s between –90 mV to 90mV) that were applied every 4 s as described under “Experimental Procedures.” E, I-V relationship of macroscopic currents induced by Tg in control cells and STIM1 siRNA-transfected cells (trace shown is the maximum current recorded in D). F, Western blot showing expression of STIM1 protein (indicated by arrow) in crude membrane fractions isolated from RBL and HSG cells as well as in rat brain (25 μg of proteins were loaded in each lane, note that all three were run on the same gel). G, Western blot showing knockdown of endogenous STIM1 protein in HSG cells treated with STIM1 siRNA. “Con” indicates cells treated with non-targeting siRNA. H, RT-PCR detection of Orai1 expression in HSG cell (-ve control indicates sample with no cDNA; +ve control was done with the human cDNA aliquot provided in the RT-PCR kit; see “Experimental Procedures”). I and J, Tg-induced ISOC measured in cells transfected with Orai1 siRNA. I shows the pattern obtained in 6/11 cells while J shows the pattern (transient currents) obtained in 4/11 cells. 1/11 cells did not display any effect of Orai1 siRNA. K, I-V relationship of the currents shown in I and J (black and red traces, respectively; red trace shows the maximum current measured in J).
[Ca2+]i Measurements
Measurements of [Ca2+]i were performed by imaging Fura-2AM-loaded cells using an Olympus 50× microscope (Olympus, Center Valley, PA), with an ORCA-ER camera (Hamamatsu, Tokyo, Japan) attached to a Polychrome IV (Till Photonics LLC, Pleasanton, CA). MetaFluor (Molecular Devices, Downingtown, PA) was used to acquire images and processing the data. Other details have been provided elsewhere (33). In the case of transfected cells, green fluorescent protein was used to select the transfected cells. Measurements were made in standard extracellular solution (145 mM NaCl, 5 mM KCl, 1 mM MgCl2, 10 mM HEPES, 10 mM glucose, pH 7.4 (NaOH)) with additions of Ca2+ as indicated (16). Relative changes in 340/380 ratios (representing [Ca2+]i) are shown in the figures (traces are average of at least 50–100 cells in each experiment).
Electrophysiological Measurements
Whole cell-attached patch clamp measurement was performed using Axopatch 200B amplifier (Molecular Devices) as described previously (6, 33). Patch pipette resistance was 3–6 mΩ filled with the following solution: 145 mM cesium methanesulfonate, 8 mM NaCl, 10 mM MgCl2, 10 mM HEPES, 10 mM EGTA, pH 7.2 (CsOH). SOCE was activated by either including inositol 1,4,5-trisphosphate (10 μm) in the pipette solution or by including Tg (1 μm) in the external solution (as indicated in the figures). Standard external solution was used with 10 mM CaCl2. For Na+ current measurements the external solution (divalent cation-free) was composed as follows: 165 mM NaCl, 5 mM CsCl, 10 mM EDTA, 10 mM HEPES, 10 mM glucose, pH 7.4 (NaOH). Development of the current was assessed from the current amplitudes at potentials of –80 mV and +80 mV recorded during voltage ramps ranging from –90 to 90 mV (over a period of 1 s, imposed every 4 s) from a holding potential of 0 mV, and digitized at a rate of 1 kHz. A liquid-junction potential of less than 8 mV was not corrected, capacitative currents and series resistance were determined and minimized. The first ramp was used for leak subtraction in the subsequent current records.
Western Blotting and Immunoprecipitation
Cells, grown to 80% confluence, were harvested, and crude membrane fraction (used where indicated) was prepared as described previously (33,34). This preparation was solubilized in SDS-sample buffer and analyzed by SDS-PAGE and Western blotting (25-50 μg of protein were loaded per lane; details as described in Refs. 33 and 34). Where indicated, cells were treated with 1 μm Tg or vehicle for 3 min in a Ca2+-containing standard extracellular solution, lysed with radioimmune precipitation assay buffer containing proteolytic inhibitors. The lysates were centrifuged at 50,000 × g for 30 min, and the supernatants were precleared and used for immunoprecipitation (IP) as described previously (33,34) using 1:100 or 1:200 dilution of antibodies. Immunoprecipitates were released by solubilization in an SDS sample and resolved by Western blotting. Where indicated, band intensities were quantified in an image analyzer, Gel DocTM XR, using Quality One software (Bio-Rad). Results are expressed as means ± S.E. Statistical analyses in this and other experiments were done using Student's t test.
Purification of GST-N- and GST-C-TRPC1 Proteins and GST Pull-down Assays
The N and C termini of TRPC1 were cloned into pGEX5.1 (Amersham Biosciences) vector and expressed as a GST fusion protein. GST pull-down assays were conducted as described previously (33, 35). Briefly, 500 ml of Escherichia coli (BL-21) expressing either GST or GST-N-TRPC1 or GST-C-TRPC1 protein were induced with 0.2 mM isopropyl 1-thio-β-d-galactopyranoside. Proteins were purified after lysing the cells by French press at 1200 pounds/square inch. Cell debris was removed by centrifugation at 10,000 × g for 10 min. The supernatant was loaded onto a GST-agarose affinity column, washed five times with PBS containing 1% Triton ×-100, 5 mm EDTA, 0.01% β-mercaptoethanol, and protease inhibitors, and eluted using 10 mm reduced glutathione. 2.2 μm of the individual GST-purified proteins were incubated with 500 μg of HSG cell lysates (lysed either using radioimmune precipitation assay buffer or octylglucoside plus 500 mm potassium iodide containing proteolytic inhibitors; see Refs. 33 and 34) for 60 min. Interacting proteins were pulled down using 100 μl of GST beads, washed five times with high salt buffer, and incubated with SDS sample buffer. Proteins were resolved on a 10% SDS-PAGE gel, and Western blots were performed as described above.
Preparation of Dispersed Mouse Submandibular Gland Cells
Cells were prepared from the mouse submandibular gland as described previously (31). Briefly, submandibular glands were removed, cleaned, minced, and digested in standard extracellular solution buffer containing 0.02% soybean trypsin inhibitor and 0.1% bovine serum albumin containing collagenase P (2.5 mg/8 ml) for 15-20 min at 37 °C, washed twice with the external solution, and resuspended in 5 ml of standard extracellular solution buffer. The cell suspension was then treated with Tg for 60 s and centrifuged, and the pellets were solubilized in radioimmune precipitation assay buffer for 30 min at 4 °C. Lysates were obtained after centrifugation, precleared, and used for immunoprecipitation as above. All mice were maintained according to guidelines approved by the NIDCR, National Institutes of Health, Animal Care and Use Committee.
Immunofluorescence and Confocal Microscopy
Cells were fixed and permeabilized as described previously (31, 32) and then treated with the required antibody (indicated in each case) at 1:100 dilution. Samples were washed and then treated with Cy5- and fluorescein isothiocyanate- or TRITC-tagged secondary antibodies as required (1:100 dilution). Images were collected using a Leica confocal microscope. Images were analyzed using MetaMorph software (Molecular Devices). Control experiments were done without primary antibody.
TIRF Microscopy Imaging
TIRF microscopy imaging was conducted using an Olympus IX81 motorized inverted microscope (Olympus). Excitation light was provided by a 20-milli-watt argon-krypton laser. The 488 nm laser was directed into an Olympus TIRF illuminator attached to the rear port of the microscope and through a 488 band pass filter (BP 10 nm) to a TIRF-optimized Olympus Plan APO ×60 (1.45 numerical aperture) oil immersion objective. Emitted light was collected through a 525 band pass filter (BP 50 nm). Images were collected every 0.5 s using a Hamamatsu EM C9100 back-thinned camera (Hamamatsu) controlled using the Openlab modular imaging software (Improvision, Lexington, MA). Cells were bathed in a Ca2+-containing standard extracellular solution (ingredients as described above). Solution changes were accomplished by selecting flow from a multichambered valve-controlled mechanical fed reservoir.
Results
Effect of Knockdown of TRPC1, Orai1, or STIM1 on SOCE and Generation of ISOC
Knockdown of endogenous TRPC1, STIM1, or Orail using shTRPC1, STIM1 siRNA, or Orai1 siRNA reduced Tg-stimulated Ca2+ influx as compared with that in cells transfected with the relevant control vector or siRNA (Fig. 1, A–C, red and black traces, respectively). Internal Ca2+ release was not altered. (Note that shTRPC1 was used, because attempts to knock down TRPC1 with several different siRNAs, either commercially available or custom made, were not very successful even after 72 h of transfection). Consistent with the effect on Ca2+ influx, the store-operated current, ISOC, which we have previously described in HSG cells (6,16,36) was greatly attenuated in cells transfected with STIM1 siRNA (Fig. 1, D and E, red traces) as compared with the currents in cells transfected with non-targeting siRNA or in untransfected cells (black traces in the figures). shTRPC1 also reduced ISOC (data not shown), the decrease was similar to what we have previously reported in cells treated with antisense TRPC1 (13, 16). Endogenous STIM1 protein was detected in crude membrane preparations from RBL and HSG cells and rat brain (Fig. 1F). STIM1 was detected as a doublet in RBL and HSG cells and as a single band in the brain samples. Notably, knockdown of protein expression in HSG cells using STIM1 siRNA (confirmed by Western blotting), showed reduction in both bands in siRNA-treated samples as compared with controls (Fig. 1G). Whether the two bands represent different glycosylated states of STIM1 is not known. Orai1 transcript was detected in HSG cells by RT-PCR (Fig. 1H, markers as well as positive and negative controls are shown) and expression of Orai1 siRNA significantly reduced ISOC. Most cells (6/11) displayed a >90% inhibition of the current (Fig. 1I). However, some Orai siRNA-treated cells (4/11) displayed transient ISOC current, and the amplitude of these transients decreased with time (Fig. 1J). 1/11 cells displayed very little effect of Orai siRNA (data not shown). Fig. 1K shows the current-voltage (I-V) relationship of the currents shown in I and J (maximum currents detected in I and J were used for plotting the I-V curves; black and red traces, respectively). Together, these data suggest that TRPC1, STIM1, and Orai1 are required for SOCE and SOC channel function in HSG cells.
Effect of Overexpression of TRPC1, Orai1, or STIM1 on SOCE and ISOC
Similar to our previous findings, overexpression of TRPC1 induced ∼2-fold increase in SOCE and ISOC (Fig. 2, A–C). Overexpression of STIM1 (YFP-STIM1) or Myc-Orai1 did not change Tg-stimulated Ca2+ release or significantly increase Ca2+ influx or ISOC currents (Fig. 2, D–F and I–K, respectively). Further, STIM1 with mutations in the EF-hand domain (YFP-STIM1D76A) induced constitutive activation of SOCE. Expression of YFP-STIM1D76A in HSG cells increased basal Ca2+ entry to a level similar to that seen after Tg stimulation (Fig. 2G, black trace). This entry was inhibited by 1 μm Gd3+ (Fig. 2G, red trace, basal entry in control cells was similar to that seen in the presence of Gd3+). Further, expression of this mutant of STIM1 did not change Tg-induced internal Ca2+ release (Fig. 2H). Thus, as suggested for CRAC channels (24, 25, 29, 37, 38), the SOC channel in HSG cells is activated by STIM1. The effect of store depletion on STIM1 localization in HSG cells was also consistent with the pattern seen in other cell types (supplemental Fig. S1). YFP-STIM1 had a uniform distribution throughout the cells, whereas the EF-hand mutant, YFP-STIM1D76A, was detected in the subplasma membrane region. Further, although YFP-STIM1 relocated to punctae in the subplasma membrane region after Tg treatment, YFP-STIM1D76A localization was not changed by Tg. Additionally, expression of STIM1 C terminus, but not STIM1 lacking the C terminus, induced spontaneous activation of SOCE (activation was ∼50% of maximum, data not shown), suggesting that STIM1 C terminus is involved in regulation of SOCE (data not shown). Similar findings have been reported by Huang et al. (37). Importantly, Orai1 overexpression did not alter the magnitude or characteristics of Tg-stimulated Ca2+ entry or ISOC in HSG cells in contrast to that seen in HEK293 cells where Orai1 expression decreased endogenous SOCE (27, 30).
FIGURE 2. Effect of overexpression of TRPC1, STIM1, and Orai1 on SOC channel function.
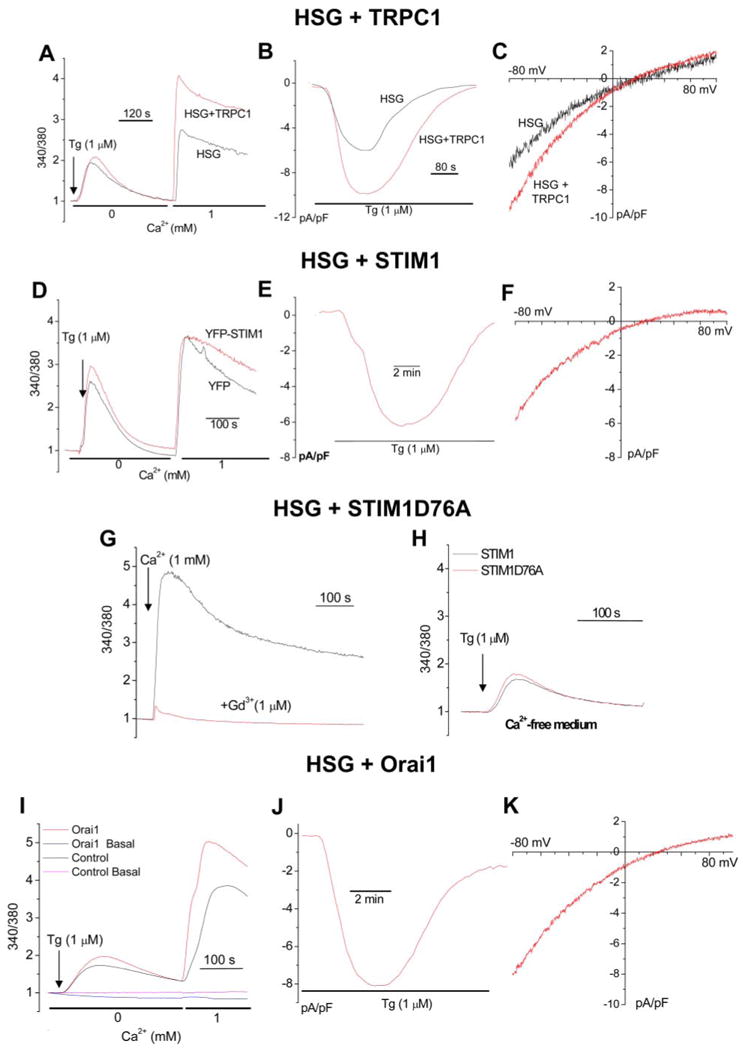
Cells were transfected with the respective vectors encoding TRPC1,STIM1, or Orai1 (red traces) or the control vectors (black trace) for 48 h after which they were used for Fura-2AM or whole cell patch clamp measurements. [Ca2+]i measurements (A) and ISOC (B and C) were measured in control HSG cells and cells overexpressing TRPC1. [Ca2+]i measurements (D) and ISOC (E and F) in cells overexpressing YFP-STIM1. Basal Ca2+ entry was not altered by TRPC1 or STIM1 overexpression (data not shown). G, effect of YFP-STIM1D76A expression on basal Ca2+ entry. Ca2+ was added where indicated in both black and red traces. 1 μm Gd3+ was added to cells prior to Ca2+ addition in the red trace. Basal entry in control cells, not shown, was similar to that seen in the presence of 1 μm Gd3+. H, effect of YFP-STIM1D76A expression on Tg-stimulated internal Ca2+ release. 1 μm Tg was added to control (black) and transfected cells (red) bathed in Ca2+-free medium. All other additions are shown in the figure. Effect of Orai1 expression on Tg-stimulated [Ca2+]i increases (I) and on ISOC (J and K). Each analog plot showing Ca2+ release and Ca2+ entry is representative of at least four experiments, with each trace showing the average for at least 50 cells. Plots showing channel events and I-V relationships are representative of at least three to four experiments (10–15 cells) with each trace showing the plot obtained with a single representative cell.
Effect of TRPC1 Overexpression on ICRAC in RBL Cells
Although Orai1 and STIM1 appear to be sufficient for generation of CRAC channels, the data presented above demonstrate that STIM1, Orai1, and TRPC1 are required for SOC channel function in HSG cells. We, therefore, assessed the effect of TRPC1 on CRAC channel activity in RBL cells, which display a classic ICRAC when intracellular Ca2+ stores are depleted (2, 8). Compared with the characteristics of ICRAC (shown in Fig. 3A) transient expression of TRPC1 (48 h after transfection) induced a left shift in the reversal potential generating a current that was more ISOC-like (Fig. 3, compare traces in B with those in A) in Ca2+-containing (Ca2+ plus Na+) and divalent cation free external medium. TRPC1 expression did not alter the magnitude of the currents in either condition (Fig. 3, C and D, also see H and I for average change in reversal potential and current amplitudes). Thus, TRPC1 appears to modify ICRAC. To further examine this, mutants of TRPC1, previously shown to alter SOC permeability in HSG cells (16), were expressed in RBL cells. Simultaneous substitutions of seven acidic amino acids in the S5–S6 region (Asp → Asn and Glu → Gln, mut pore) or single mutation, D581K, also altered cation permeability of CRAC (Fig. 3, E and F, respectively). Average reversal potentials measured in each, Erev, as well as current densities are shown in Fig. 3, H and I, respectively. Additionally, expression of TRPC1 truncated after the 5th transmembrane (no-pore), induced dominant suppression and dramatic changes in ICRAC (Fig. 3, G–I). Interestingly, and in contrast to its effect on ISOC in HSG cells, antisense TRPC1 did not affect ICRAC (trace not shown, see average data in Fig. 3, H and I). The latter finding agrees well with a lack of endogenously expressed TRPC1 in these cells (Fig. 3J). Similar effects of TRPC1, mutants of TRPC1, or antisense-TRPC1 on store-operated calcium entry in RBL cells were also detected by Fura-2AM fluorescence measurements (Fig. 3, K and L). In aggregate, the data shown in Fig. 3 suggest that, although TRPC1 is likely not an endogenous component of CRAC in RBL cells, it can interact with the core components of this channel and modify its properties. This is specially illustrated by the dominant negative effect induced by TRPC1 lacking the pore domain. Orai1 has been suggested to contribute to the pore of CRAC channels (24–26), although the effect of Orai1 siRNA on ICRAC in RBL cells has not yet been demonstrated. Thus, the data shown in Fig. 3 demonstrate the potential of TRPC1 to interact with CRAC channel components. It is interesting to note that the effect of expression of Orai1 mutants on CRAC channel activity are very similar to the effects induced by expression of TRPC1-mutants on ICRAC (data in Fig. 3) and ISOC reported earlier (16).
FIGURE 3. Effect of overexpressing TRPC1 and its mutants on CRAC activity in RBL cells.
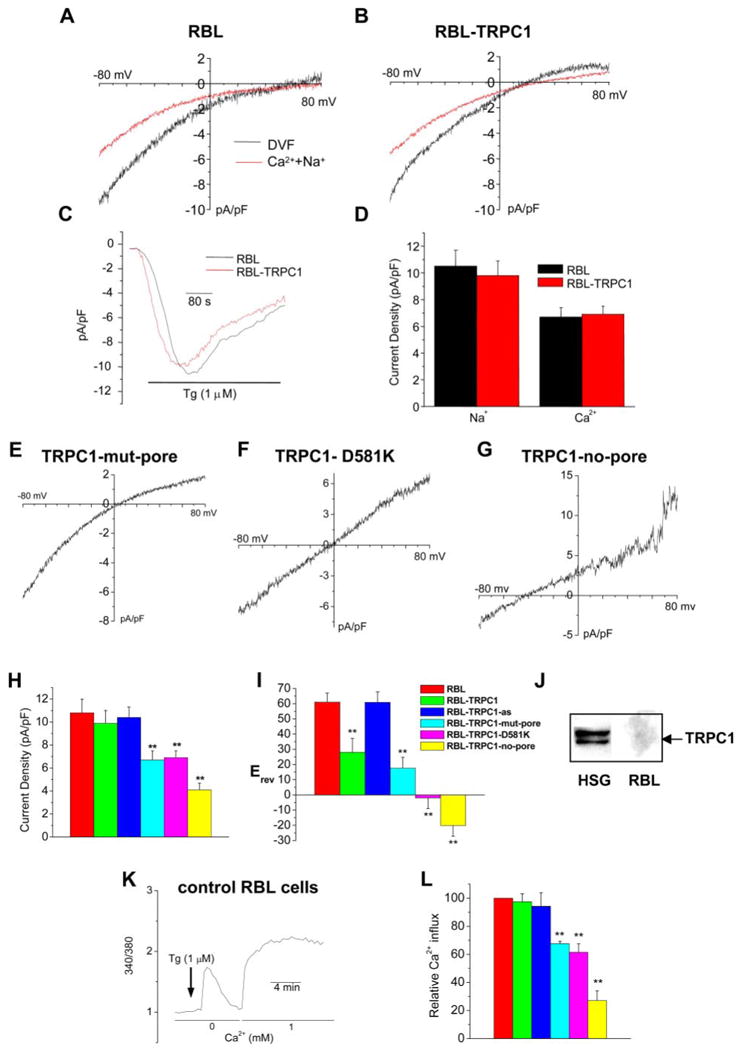
A–D, ICRAC was measured in control RBL cells (A) and RBL cells transiently expressing TRPC1 (B–D) in Ca2+ plus Na+ medium (Ca2+ current, red traces) or divalent cation-free (DVF) medium (Na+ current, black traces). A and B show I-V curves while C shows a time course of the current. Average data of recorded current densities are shown in D. E–G, I-V relationship of ICRAC measured in cells expressing TRPC1 mutants TRPC1-mut-pore in which all negatively charged residues in the S5–S6 region were simultaneously mutated, Asp to Asn and Glu to Gln (E), TRPC1-D581K (F), or TRPC1-no-pore in which the protein was truncated after the 5th transmembrane (G). H and I, average data for reversal potential and current densities obtained in control RBL cells and RBL cells overexpressing TRPC1 and its mutants. Effect of antisense TRPC1 (TRPC1-as) on reversal potential and current density is shown in H and I (current trace not shown). Values marked with double stars are significantly different from unmarked values (p < 0.025; n ≥ 6 cells in each case; Student's t test). J, Western blot showing TRPC1 expression in HSG cells but not in RBL cells (crude membrane preparations, 25 μg of protein, from the respective cells were used for this blot, and anti-TRPC1 antibody was used to detect endogenous TRPC1).K, effect of TRPC1 and mutant TRPC1 proteins (described above) on Tg-stimulated internal Ca2+ entry. K shows typical changes in [Ca2+]i in control RBL cells. L, average data of relative Ca2+ entry, i.e. [Ca2+]i increase seen after re-addition of 1 mM Ca2+ to Tg-treated cells. Tg-induced Ca2+ release was not altered in these experiments. Values marked with double stars are significantly different from unmarked values (p < 0.025; n ≥ 6 cells in each case; Student's t test). The color key for the histograms is given in I.
Association of TRPC1, STIM1, and Orai1
To examine the possible interaction of TRPC1, STIM1, and Orai1, we first determined their localization in HSG cells. Fig. 4A shows co-localization of STIM1 (green signal) and TRPC1 (red signal) (panel i), STIM1 (green signal) and Orai1 (red signal) (panel ii), and TRPC1 (red signal) and Orai1 (green signal; the yellow color indicates overlap in the localization of the proteins in all the panels) (panel iii). STIM1 was diffusely localized in the cytosolic region of the cells (Fig. 4A, i and ii); Orai1 was primarily detected in the plasma membrane region (Fig. 4A, ii and iii). TRPC1 was found in the internal region of the cells as well as the plasma membrane (i and iii) and strongly co-localized with Orai1 (iii). Following stimulation with Tg, there was increase in the co-localization of TRPC1 and STIM1 in the plasma membrane region (see right panel in i) as well as STIM1 and Orai1 (ii, right panel), but no further change in the co-localization of TRPC1 and Orai1 (iii, right panel). Note that, although STIM1 localization in Tg-treated cells appears to be somewhat punctate (Fig. 4 A, i and ii, right panels) this is more clearly detected using TIRF microscopy (see supplemental Fig. S1B).
FIGURE 4. Co-localization of TRPC1, Orai1, and STIM1 in HSG cells.

A, localization of TRPC1 and STIM1 (red, FLAG-TRPC1; green, CFP-STIM1; yellow; overlap of the two signals) (i); Orai1 and STIM1 (red, Myc-Orai1; green, YFP-STIM1; yellow, overlap) (ii); Orai1 and TRPC1 (green, Myc-Orai1; red, FLAG-TRPC1; yellow, overlap) (iii) in resting and Tg-stimulated (3 min) HSG cells. Confocal imaging was used to detect protein localization (antibody concentrations and other details are given under “Experimental Procedures.”) TRPC1 was overexpressed, because the signal of the endogenous protein was relatively lower that those of expressed YFP STIM1 or Myc-Orai1; note that similar findings were obtained with HA-tagged or FLAG-tagged TRPC1 and CFP- or YFP-STIM1). B, co-immunoprecipitation of STIM1 (upper panel) with endogenous TRPC1 (lower panel) from lysates of HEK293 cells. C, co-immunoprecipitation of TRPC1 (upper panel) with STIM1 (lower panel) from lysates of A7r5 cells. In each case cells were either transfected with empty vector (control) or with STIM1-encoding vector (STIM1). “Inp” indicates input levels of proteins in lysate, and “IP” indicates immunoprecipitated proteins. TRPC1 in the IP fraction was not changed by Tg stimulation (data not shown). Antibodies for IP and immuno-blotting (IB) are indicated. 2 mg of cell lysates was used for IP. D, pulldown of STIM1 from HSG cells lysates by GST fusion protein of the C and N termini of TRPC1 (GST-C-TRPC1 and GST-N-TRPC1, respectively) is shown in the upper blot. “GST” indicates the control GST protein alone. The lower blots show the amount of the fusion proteins or control GST protein used.
Possible interaction between TRPC1, STIM1, and Orai1 were further examined by immunoprecipitation experiments. The data in Fig. 4 (B and C) show association between TRPC1 and STIM1 in HEK293 and A7r5 cells, respectively (controls and cells transiently transfected with STIM1 cDNA). Both cell types endogenously express TRPC1, and furthermore TRPC1 has been shown to be involved in SOCE in both cases (9, 15). Either anti-TRPC1 (HEK293 cells) or anti-STIM1 (A7r5 cells) was used for IP, and proteins in the immunoprecipitated fraction were detected using either anti-STIM1 or TRPC1 antibodies (IB). In HEK293 cells, STIM1 was co-immunoprecipitated with TRPC1 from control and STIM1-overexpressing cells (upper panel, note there is more STIM1 in the latter). The lower panel shows the immunoprecipitation of TRPC1, which was similar in both sets of cells. Similarly, in A7r5 cells, endogenous TRPC1 was co-immunoprecipitated with STIM1 (Figs. 4C, upper panel, anti-STIM1 antibody was used for the immunoprecipitation). The lower panel shows levels of STIM1 in the immunoprecipitates from both samples. Note that the amount of TRPC1 immunoprecipitated with STIM1 is determined by the levels of STIM1 expressed in the cells (more STIM1 and TRPC1 are seen in the IP fraction from cells overexpressing STIM1).
We also used GST fusion proteins of the N and C termini of TRPC1 (GST-N-TRPC1 and GST-C-TRPC1, respectively) to further examine the STIM1-TRPC1 association. STIM1 from HSG cell lysates bound to GST-C-TRPC1 but not to either GST alone or GST-N-TRPC1 (Fig. 4D, upper panel). The lower panel shows the amounts of GST fusion proteins of N-TRPC1 and C-TRPC1 used.
Effect of Thapsigargin Stimulation on TRPC1-STIM1-Orai1 Complex
Fig. 5 shows the effect of Tg on the interaction of TRPC1, STIM1, and Orai1 in salivary gland cells. Interaction of endogenous STIM1 (indicated by a star) or overexpressed YFP-STIM1 (indicated by double stars) with endogenous TRPC1 increased following stimulation of HSG cells with 1 μm Tg (Fig. 5 (A and B) shows results of IP with anti-TRPC1 antibody and IB with anti-STIM1). Note that expression of YFP-STIM1 also increased the association of endogenous STIM1 with TRPC1 (Fig. 5B) likely due to heteromerization between the exogenous and endogenous STIM1 proteins. The increase in STIM1-TRPC1 interaction following Tg stimulation was also seen in acutely dispersed mouse submandibular gland cells (Fig. 5C). Additionally, exogenously expressed Myc-Orai1 interacted with endogenous TRPC1 as well as endogenous STIM1 in HSG cells. More importantly, the association of TRPC1 and STIM1 with Myc-Orai1 increased following Tg treatment (Fig. 5D, left panel shows IP with anti-Myc; 1.5 ± 0.18- and 1.36 ± 0.1-fold, respectively, n = 3). In the reverse experiments, IP of endogenous TRPC1 (Fig. 5D, right panel) pulled down Myc-Orai1, which was increased (1.8 ± 0.22-fold, n = 3) when cells were stimulated with Tg. Endogenous STIM1 was also increased in the IP fraction (1.4 ± 0.1-fold, n = 3) suggesting that STIM1 continued to interact with TRPC1 in these Myc-Orai1-expressing cells and that there is no apparent competition between Orai1 and TRPC1 for STIM1. Tg-induced increases in the levels of TRPC1 and STIM1 with Myc-Orai1 and of Myc-Orai1 and STIM1 with TRPC1 were similar (based on the quantitation of the blots shown in Fig. 5D). These important data demonstrate that internal store depletion promotes association between TRPC1, Orai1, and STIM1.
FIGURE 5. Effect of Tg stimulation on TRPC1-STIM1-Orai1 interaction.
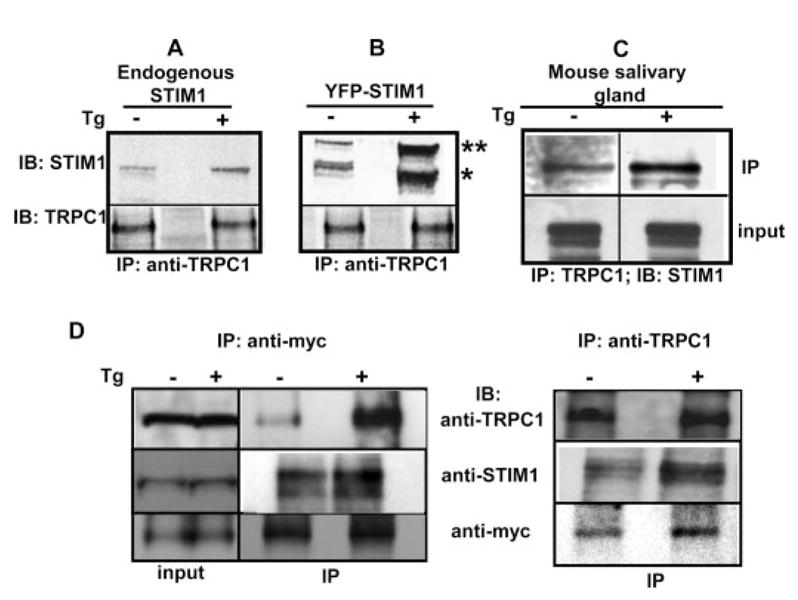
A and B, co-immunoprecipitation of TRPC1 with endogenous STIM1 and YFP-STIM1, respectively, from lysates of unstimulated (–) and stimulated cells ( + ) (3 min with 1 μm Tg). YFP-STIM1 (double stars) is detected as a band above the endogenous STIM1 (single star). IP and IB antibodies are indicated. C, co-immunoprecipitation of endogenous STIM1 with TRPC1 from mouse salivary gland cell preparations (see “Experimental Procedures” for details). “IP” indicates immunoprecipitated proteins, input shows protein in the lysate. D, association of TRPC1 with STIM1 and Myc-Orai1 in unstimulated and Tg-stimulated HSG cells transfected with Myc-Orai1. Left panel, proteins in IP using anti-Myc; right panel, proteins in IP of TRPC1 using anti-TRPC1 from the same cell lysate. Input levels of proteins and IB antibodies are shown in the blot.
Discussion
Our previous studies have established that TRPC1 determines the cation permeability of SOC channel and thus is required for SOCE in salivary gland cells (16). Here we report that that Orai1 and STIM1 contribute to TRPC1-dependent SOC channel function. Orai1 and Stim1 have garnered much attention recently as the elusive molecular components of CRAC channels based on the observation that co-expression of the two proteins is sufficient for generation of ICRAC (23–25, 28–30, 38). The data presented above demonstrate that, in addition to TRPC1, Orai1 and STIM1 are also required for SOCE and SOC channel activity in HSG cells. Consistent with recent reports (39) we show that STIM1 is the ER-Ca2+ sensor involved in regulation of SOCE in HSG cells. Knockdown of STIM1 induced a dramatic inhibition (>90%) of ISOC in HSG cells while expression of a STIM1 EF-hand mutant, which lacks Ca2+ sensitivity, generated spontaneous SOCE. Further, STIM1 relocated in the subplasma membrane region of HSG cells in response to Tg-induced internal Ca2+ store depletion. Thus, regulation of STIM1 by internal Ca2+ store depletion is similar in cells expressing ICRAC and those with TRPC1-dependent ISOC.In aggregate, these findings demonstrate that STIM1 in the ER is likely to be an upstream channel regulator of both SOC and CRAC channels. The more significant, and somewhat unexpected, finding of our study is that Orai1 also contributes to TRPC1-SOC channel function. We have shown that knockdown of Orai1 reduced (by >90%) ISOC. Importantly, we show that internal Ca2+ store depletion induced dynamic assembly of a TRPC1-STIM1-Orai1 ternary complex. Together, these novel findings suggest that TRPC1, Orai1, and STIM1 concertedly determine SOCE and contribute to SOC channel activity in HSG cells. Thus, these data suggest similarities in the molecular components of CRAC and SOC channels. It will be important to determine whether this is true for different SOC channels that have been identified in various cell types and especially those involving TRPC1.
Reports demonstrating that Orai1and STIM1 are essential components of SOCE (as discussed above) rule out the contribution of TRPCs to SOCE based on lack of effect of siRNAs (20, 21, 25) as well as lack of mutations in TRPC proteins in T lymphocytes from SCID patients (20, 21, 25). However, as noted above TRPC channels have been suggested as SOCE components in various cell types (2–4, 10, 11). Our previous studies have clearly established TRPC1 as a poreforming component of SOC channel in HSG and other salivary gland cells (10, 13, 34). It should be also noted that, although our present study indicates that siRNA might not be very effective in reducing TRPC1 in HSG cells even after treatment for 24 or 48 h, shRNA as well as antisense RNA were very effective in reducing TRPC1 levels, which was accompanied by a decrease in function. Notably, several earlier reports have implicated a role for TRPCs in SOCE in the same cell types that were used for the Orai1 and STIM1 studies; e.g. TRPC3 in T-lymphocytes (18); TRPC1, TRPC3, and TRPC7 in HEK293 cells (15); and TRPC1 in DT-40 cells (14). In this context, it is important to emphasize that over-expressed STIM1 or Orai1 can interact with endogenous TRPC1 (see Fig. 5) and further, overexpressed TRPC1 can modify CRAC channel activity, likely by interacting with the channel components (Fig. 3). An association between STIM1 and TRPC1 has been convincingly demonstrated in HEK293 cells and platelets (37, 40). Further, Huang et al. (37) have shown that STIM1 selectively interacts with TRPC proteins: TRPC1, TRPC2, and TRPC4 interacted with STIM1, whereas TRPC3, TRPC6, and TRPC7 did not. Whether this difference is related to the ability of these TRPCs to form SOCs is not yet known. Together, these findings provide evidence for an association between TRPC1 and the CRAC channel components, Orai1 and STIM1. The present findings not only substantiate previous suggestions made by us and others that TRPC channels function as molecular components of SOC channels (2–4, 10, 11) but also demonstrate for the first time that TRPC1, Orai1, and STIM1 are concertedly involved in SOCE.
Although we have not directly assessed whether Orai1 contributes to the Ca2+ permeability of SOC, based on recent reports suggesting that it is a pore-forming subunit of CRAC channels, it is possible that it also contributes to SOC channel permeability in HSG cells. Although exactly how two potentially distinct pore-forming proteins; i.e. TRPC1 and Orai1, contribute to SOC channel activity is presently not clear, our data identify a requirement for both TRPC1 and Orai1 in SOCE and generation of ISOC in HSG cells. As discussed in a recent review by Smyth et al. (39), TRPC1/ STIM1 and Orai1/STIM1 could function as distinct channels and contribute independently to SOCE. Our data argue against the suggestion that Orai1 and STIM1 generate an independent CRAC channel in HSG cells. Knockdown or overexpression of Orai1 or TRPC1 does not change the characteristics of the ISOC in HSG cells. If TRPC1/STIM1 and Orai1/STIM1 formed independent channels in HSG cells, knockdown of TRPC1 would have generated an ICRAC-like current due to the residual Orai1/STIM1-CRAC channel activity, and knockdown of Orai1 would have decreased the contribution of ICRAC to the total currents. Further, as discussed above, TRPC1 has the potential to interact with core components of the CRAC channel. Thus we have proposed that TRPC1, Orai1, and STIM1 together form the functional SOC channel in HSG cells (see model in Fig. 6). However, further studies will be required to determine the exact molecular composition of this channel and how it is regulated by internal Ca2+ store depletion.
FIGURE 6. Model depicting proposed interactions of TRPC1, STIM1, and Orai1 in unstimulated and stimulated cells.
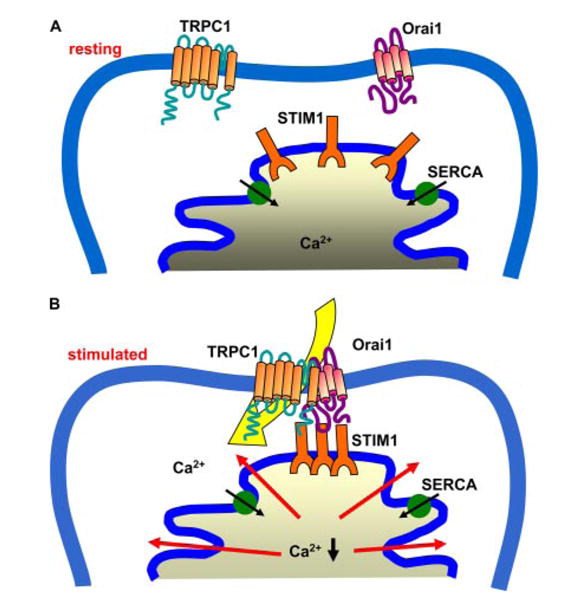
Our model predicts that TRPC1 and Orai1 are likely in the plasma membrane while STIM1 is in the ER. Internal Ca2+ store depletion induces a change in Ca2+ binding to STIM1 in the ER lumen. This leads to aggregation of the protein and by an as yet unrecognized mechanism transmits a signal to Orai1 and TRPC1, which results in recruitment of the proteins into a ternary complex and activation of SOC channel.
The currently accepted concept for activation of CRAC channels is that internal Ca2+ store depletion induces relocation of STIM1 into aggregates in ER. Formation of STIM1 aggregates in the subplasma membrane regions, and its likely interaction with Orai1 in the plasma membrane, appear to be prerequisite for activation of the channel (25, 28, 30, 38, 39, 41). Although an increase in co-localization of these two proteins in the subplasma membrane region has been shown in several cell types, there are no data to directly demonstrate an interaction between the two proteins. We and others have previously suggested that regulation of TRPC1-dependent SOC channels is determined within functionally specific microdomains in the cells (10, 42). Both ER and plasma membrane components are involved in channel regulation, and this is achieved by the close apposition of the intracellular membrane with the surface membrane. Consistent with this suggestion TRPC1 and STIM1 were shown to redistribute into the same punctae locations in the subplasma membrane region in response to internal Ca2+ store depletion (37). Further, an increase in endogenous STIM1-TRPC1 interaction following thapsigargin treatment was shown in platelets (40), although no increase in protein association was detected with the overexpressed proteins in HEK293 cells (37). Here we have shown that, upon internal Ca2+ store depletion STIM1 relocates into punctae in the ER, which co-localize with Orai1 and TRPC1 in the plasma membrane region. Further, there is increased association of STIM1 with Orai1 and TRPC1 in stimulated cells. Thus, we suggest that STIM1 in junctional ER associates with TRPC1 and Orai1 in specific plasma membrane microdomains during activation of SOCE.
In summary, the data we have described above demonstrate that TRPC1 can associate with two critical components that have been shown to regulate/generate ICRAC, Orai1 and STIM1. Further, we have shown that all three proteins are required for SOCE and SOC channel function. Together, our data provide evidence for similarities in the molecular components of SOC and CRAC channels. A major finding in this study is that dynamic assembly of a TRPC1-STIM1-Orai1 ternary complex is associated with activation of SOCE. An important question that needs to be addressed is how Orai1, STIM1, and TRPC1 assemble to form SOC channel(s). Our previous studies, and those of several other groups, have demonstrated that TRPC1 is assembled in a macromolecular signaling complex along with key Ca2+-signaling proteins, e.g. SERCA, PMCA, PLCβ, inositol 1,4,5-trisphosphate receptor, and calmodulin. In addition roles for Homer (43), Rho-GTPase (44), caveolin-1, as well as plasma membrane lipid raft domains (34,45) have been suggested in the regulation of TRPC-associated SOCE. It is interesting that inositol 1,4,5-trisphosphate receptors have also been recently shown to relocate into punctae in the subplasma region of cells (46). Further studies will be required to resolve the exact molecular rearrangements that govern the interactions between TRPC1, Orai1, and STIM1 and to define the specific individual functions of the accessory proteins involved in SOCE.
Supplementary Material
Acknowledgments
We thank Dr. Tobias Meyer for kindly providing us with the CFP-STIM1, YFP-STIM1, and YFP-STIM1D76a DNAs and Drs. James Russell and Vincent Schram for their assistance in TIRF, which was performed at the Microscopy and Imaging Core (NICHD, National Institutes of Health).
Footnotes
This work was supported in part by National Institutes of Health (NIH) Grant DE017102 (to B. B. S.).
The on-line version of this article (available at http://www.jbc.org) contains supplemental Fig. S1.
The abbreviations used are: SOCE, store-operated Ca2+ entry; SOC, store-operated Ca2+; ER, endoplasmic reticulum; CRAC, calcium release-activated Ca2+; siRNA, small interference RNA; Tg, thapsigargin; TRITC, tetramethylrhodamine isothiocyanate; HA, hemagglutinin; GST, glutathione S-transferase; HSG, human salivary gland; TRPC, transient receptor potential canonical; sh, short hairpin; IP, immunoprecipitation; IB, immunoblotting; RBL, rat basophilic leukemia; TIRF, total internal reflection fluorescence.
References
- 1.Berridge MJ, Bootman MD, Roderick HL. Nat Rev Mol Cell Biol. 2003;4:517–529. doi: 10.1038/nrm1155. [DOI] [PubMed] [Google Scholar]
- 2.Parekh AB, Putney JW., Jr Physiol Rev. 2005;85:757–810. doi: 10.1152/physrev.00057.2003. [DOI] [PubMed] [Google Scholar]
- 3.Venkatachalam K, van Rossum DB, Patterson RL, Ma HT, Gill DL. Nat Cell Biol. 2002;4:E263–E272. doi: 10.1038/ncb1102-e263. [DOI] [PubMed] [Google Scholar]
- 4.Beech DJ. Pflugers Arch. 2005;451:53–60. doi: 10.1007/s00424-005-1441-3. [DOI] [PubMed] [Google Scholar]
- 5.Bolotina VM. Sci STKE 2004. 2004:pe34. doi: 10.1126/stke.2432004pe34. [DOI] [PubMed] [Google Scholar]
- 6.Liu X, Groschner K, Ambudkar IS. J Membr Biol. 2004;200:93–104. doi: 10.1007/s00232-004-0698-3. [DOI] [PubMed] [Google Scholar]
- 7.Lewis RS. Annu Rev Immunol. 2001;19:497–521. doi: 10.1146/annurev.immunol.19.1.497. [DOI] [PubMed] [Google Scholar]
- 8.Parekh AB, Penner R. Physiol Rev. 1997;77:901–930. doi: 10.1152/physrev.1997.77.4.901. [DOI] [PubMed] [Google Scholar]
- 9.Brueggemann LI, Markun DR, Henderson KK, Cribbs LL, Byron KL. J Pharmacol Exp Ther. 2006;317:488–499. doi: 10.1124/jpet.105.095067. [DOI] [PubMed] [Google Scholar]
- 10.Ambudkar IS. Trends Pharmacol Sci. 2006;27:25–32. doi: 10.1016/j.tips.2005.11.008. [DOI] [PubMed] [Google Scholar]
- 11.Montell C. Sci STKE 2005. 2005:re3. doi: 10.1126/stke.2722005re3. [DOI] [PubMed] [Google Scholar]
- 12.Brownlow SL, Sage SO. Thromb Haemost. 2005;94:839–845. doi: 10.1160/TH05-06-0391. [DOI] [PubMed] [Google Scholar]
- 13.Liu X, Wang W, Singh BB, Lockwich T, Jadlowiec J, O'Connell B, Wellner R, Zhu MX, Ambudkar IS. J Biol Chem. 2000;275:3403–3411. doi: 10.1074/jbc.275.5.3403. [DOI] [PubMed] [Google Scholar]
- 14.Mori Y, Wakamori M, Miyakawa T, Hermosura M, Hara Y, Nishida M, Hirose K, Mizushima A, Kurosaki M, Mori E, Gotoh K, Okada T, Fleig A, Penner R, Iino M, Kurosaki T. J Exp Med. 2002;195:673–681. doi: 10.1084/jem.20011758. [DOI] [PMC free article] [PubMed] [Google Scholar]
- 15.Zagranichnaya TK, Wu X, Villereal ML. J Biol Chem. 2005;280:29559–29569. doi: 10.1074/jbc.M505842200. [DOI] [PubMed] [Google Scholar]
- 16.Liu X, Singh BB, Ambudkar IS. J Biol Chem. 2003;278:11337–11343. doi: 10.1074/jbc.M213271200. [DOI] [PubMed] [Google Scholar]
- 17.Xu SZ, Beech DJ. Circ Res. 2001;88:84–87. doi: 10.1161/01.res.88.1.84. [DOI] [PubMed] [Google Scholar]
- 18.Philipp S, Strauss B, Hirnett D, Wissenbach U, Mery L, Flockerzi V, Hoth M. J Biol Chem. 2003;278:26629–26638. doi: 10.1074/jbc.M304044200. [DOI] [PubMed] [Google Scholar]
- 19.Williams RT, Senior PV, Van Stekelenburg L, Layton JE, Smith PJ, Dziadek MA. Biochim Biophys Acta. 2002;1596:131–137. doi: 10.1016/s0167-4838(02)00211-x. [DOI] [PubMed] [Google Scholar]
- 20.Liou J, Kim ML, Heo WD, Jones JT, Myers JW, Ferrell JE, Jr, Meyer T. Curr Biol. 2005;15:1235–1241. doi: 10.1016/j.cub.2005.05.055. [DOI] [PMC free article] [PubMed] [Google Scholar]
- 21.Roos J, DiGregorio PJ, Yeromin AV, Ohlsen K, Lioudyno M, Zhang S, Safrina O, Kozak JA, Wagner SL, Cahalan MD, Velicelebi G, Stauderman KA. J Cell Biol. 2005;169:435–445. doi: 10.1083/jcb.200502019. [DOI] [PMC free article] [PubMed] [Google Scholar]
- 22.Spassova MA, Soboloff J, He LP, Xu W, Dziadek MA, Gill DL. Proc Natl Acad Sci U S A. 2006;103:4040–4045. doi: 10.1073/pnas.0510050103. [DOI] [PMC free article] [PubMed] [Google Scholar]
- 23.Feske S, Gwack Y, Prakriya M, Srikanth S, Puppel SH, Tanasa B, Hogan PG, Lewis RS, Daly M, Rao A. Nature. 2006;441:179–185. doi: 10.1038/nature04702. [DOI] [PubMed] [Google Scholar]
- 24.Yeromin AV, Zhang SL, Jiang W, Yu Y, Safrina O, Cahalan MD. Nature. 2006;443:226–229. doi: 10.1038/nature05108. [DOI] [PMC free article] [PubMed] [Google Scholar]
- 25.Prakriya M, Feske S, Gwack Y, Srikanth S, Rao A, Hogan PG. Nature. 2006;443:230–233. doi: 10.1038/nature05122. [DOI] [PubMed] [Google Scholar]
- 26.Vig M, Beck A, Billingsley JM, Lis A, Parvez S, Peinelt C, Koomoa DL, Soboloff J, Gill DL, Fleig A, Kinet JP, Penner R. Curr Biol. 2006;16:2073–2079. doi: 10.1016/j.cub.2006.08.085. [DOI] [PMC free article] [PubMed] [Google Scholar]
- 27.Vig M, Peinelt C, Beck A, Koomoa DL, Rabah D, Koblan-Huberson M, Kraft S, Turner H, Fleig A, Penner R, Kinet JP. Science. 2006;312:1220–1223. doi: 10.1126/science.1127883. [DOI] [PMC free article] [PubMed] [Google Scholar]
- 28.Mercer JC, Dehaven WI, Smyth JT, Wedel B, Boyles RR, Bird GS, Putney JW., Jr J Biol Chem. 2006;281:24979–24990. doi: 10.1074/jbc.M604589200. [DOI] [PMC free article] [PubMed] [Google Scholar]
- 29.Peinelt C, Vig M, Koomoa DL, Beck A, Nadler MJ, Koblan-Huberson M, Lis A, Fleig A, Penner R, Kinet JP. Nat Cell Biol. 2006;8:771–773. doi: 10.1038/ncb1435. [DOI] [PMC free article] [PubMed] [Google Scholar]
- 30.Soboloff J, Spassova MA, Tang XD, Hewavitharana T, Xu W, Gill DL. J Biol Chem. 2006;281:20661–20665. doi: 10.1074/jbc.C600126200. [DOI] [PubMed] [Google Scholar]
- 31.Singh BB, Zheng C, Liu X, Lockwich T, Liao D, Zhu MX, Birnbaumer L, Ambudkar IS. FASEB J. 2001;15:1652–1654. doi: 10.1096/fj.00-0749fje. [DOI] [PubMed] [Google Scholar]
- 32.Wang WC, O'Connell B, Dykeman R, Sakai T, Delporte C, Swaim W, Zhu X, Birnbaumer L, Ambudkar IS. Am J Physiol. 1999;276:C969–C979. doi: 10.1152/ajpcell.1999.276.4.C969. [DOI] [PubMed] [Google Scholar]
- 33.Liu X, Bandyopadhyay BC, Singh BB, Groschner K, Ambudkar IS. J Biol Chem. 2005;280:21600–21606. doi: 10.1074/jbc.C400492200. [DOI] [PubMed] [Google Scholar]
- 34.Lockwich TP, Liu X, Singh BB, Jadlowiec J, Weiland S, Ambudkar IS. J Biol Chem. 2000;275:11934–11942. doi: 10.1074/jbc.275.16.11934. [DOI] [PubMed] [Google Scholar]
- 35.Singh BB, Patel HH, Roepman R, Schick D, Ferreira PA. J Biol Chem. 1999;274:37370–37378. doi: 10.1074/jbc.274.52.37370. [DOI] [PubMed] [Google Scholar]
- 36.Liu X, O'Connell A, Ambudkar IS. J Biol Chem. 1998;273:33295–33304. doi: 10.1074/jbc.273.50.33295. [DOI] [PubMed] [Google Scholar]
- 37.Huang GN, Zeng W, Kim JY, Yuan JP, Han L, Muallem S, Worley PF. Nat Cell Biol. 2006;8:1003–1010. doi: 10.1038/ncb1454. [DOI] [PubMed] [Google Scholar]
- 38.Luik RM, Wu MM, Buchanan J, Lewis RS. J Cell Biol. 2006;174:815–825. doi: 10.1083/jcb.200604015. [DOI] [PMC free article] [PubMed] [Google Scholar]
- 39.Smyth JT, Dehaven WI, Jones BF, Mercer JC, Trebak M, Vazquez G, Putney JW., Jr Biochim Biophys Acta. 2006;1763:1147–1160. doi: 10.1016/j.bbamcr.2006.08.050. [DOI] [PubMed] [Google Scholar]
- 40.Lopez JJ, Salido GM, Pariente JA, Rosado JA. J Biol Chem. 2006;281:28254–28264. doi: 10.1074/jbc.M604272200. [DOI] [PubMed] [Google Scholar]
- 41.Wu MM, Buchanan J, Luik RM, Lewis RS. J Cell Biol. 2006;174:803–813. doi: 10.1083/jcb.200604014. [DOI] [PMC free article] [PubMed] [Google Scholar]
- 42.Kiselyov K, Kim JY, Zeng W, Muallem S. Pflugers Arch. 2005;451:116–124. doi: 10.1007/s00424-005-1442-2. [DOI] [PubMed] [Google Scholar]
- 43.Yuan JP, Kiselyov K, Shin DM, Chen J, Shcheynikov N, Kang SH, Dehoff MH, Schwarz MK, Seeburg PH, Muallem S, Worley PF. Cell. 2003;114:777–789. doi: 10.1016/s0092-8674(03)00716-5. [DOI] [PubMed] [Google Scholar]
- 44.Mehta D, Ahmmed GU, Paria BC, Holinstat M, Voyno-Yasenetskaya T, Tiruppathi C, Minshall RD, Malik AB. J Biol Chem. 2003;278:33492–33500. doi: 10.1074/jbc.M302401200. [DOI] [PubMed] [Google Scholar]
- 45.Brazer SC, Singh BB, Liu X, Swaim W, Ambudkar IS. J Biol Chem. 2003;278:27208–27215. doi: 10.1074/jbc.M301118200. [DOI] [PMC free article] [PubMed] [Google Scholar]
- 46.Hisatsune C, Mikoshiba K. Sci STKE 2005. 2005:pe53. doi: 10.1126/stke.3132005pe53. [DOI] [PubMed] [Google Scholar]
Associated Data
This section collects any data citations, data availability statements, or supplementary materials included in this article.