

Abstract
P-glycoprotein-ATPase is an efflux transporter of broad specificity that counteracts passive allocrit influx. Understanding the rate of allocrit transport therefore matters. Generally, the rates of allocrit transport and ATP hydrolysis decrease exponentially with increasing allocrit affinity to the transporter. Here we report unexpectedly strong down-modulation of the P-glycoprotein-ATPase by certain detergents. To elucidate the underlying mechanism, we chose 34 electrically neutral and cationic detergents with different hydrophobic and hydrophilic characteristics. Measurement of the P-glycoprotein-ATPase activity as a function of concentration showed that seven detergents activated the ATPase as expected, whereas 27 closely related detergents reduced it significantly. Assessment of the free energy of detergent partitioning into the lipid membrane and the free energy of detergent binding from the membrane to the transporter revealed that the ratio, q, of the two free energies of binding determined the rate of ATP hydrolysis. Neutral (cationic) detergents with a ratio of q = 2.7 ± 0.2 (q > 3) followed the aforementioned exponential dependence. Small deviations from the optimal ratio strongly reduced the rates of ATP hydrolysis and flopping, respectively, whereas larger deviations led to an absence of interaction with the transporter. P-glycoprotein-ATPase inhibition due to membrane disordering by detergents could be fully excluded using 2H-NMR-spectroscopy. Similar principles apply to modulating drugs.
Introduction
P-glycoprotein (P-gp-ATPase, MDR1, ABCB1) transports or flops a wide variety of allocrits at different rates using the energy of ATP hydrolysis (1). The activity cycle of P-gp has been extensively studied (for review, see Zolnerciks et al. (2)) and can be described by a minimum of four steps: 1), binding of the allocrit from the cytosolic membrane leaflet to the transmembrane domains (TMDs); 2), binding of ATP to the nucleotide binding domains (NBDs), which induces NBD dimerization and transition from the binding-competent to the release-competent conformation; 3), flopping of the allocrit to the extracellular membrane leaflet and release into the extracellular leaflet or the aqueous phase; and 4), ATP hydrolysis, including Pi and ADP release, which resets the transporter to the binding-competent conformation. It has been proposed that the rate of ATP hydrolysis directly correlates with the rate of effective transport by P-gp using as allocrits either vinblastine (3) or permanently charged spin-labeled verapamil (4). The latter is unable to diffuse passively across the membrane, and the former diffuses only slowly. For more rapidly diffusing compounds, the direct correlation between ATP hydrolysis and transport is not obvious (5) but can still be proven by taking into account passive diffusion of allocrits across the membrane (6,7) (for review, see Seelig (8)). The kinetic analysis of a large number of allocrits, including many drugs (9) and detergents such as Tween 80, TritonX-100 (10), and C12EOn (with n = 4–10) (11), revealed that the rate of ATP hydrolysis by P-gp (log scale) decreases linearly with increasing affinity of the allocrit from water to the transporter, suggesting that step 3 (allocrit transport and release) is rate-limiting, in agreement with previous investigations (4,5).
Recently, we observed that certain detergents, such as C12EOn (with n = 3 and n = 2), induced much lower rates of ATP hydrolysis than expected based on the aforementioned exponential dependence (9). Low rates were also reported, e.g., for n-octyl-β-D-glucopyranoside (12) and particularly for n-dodecyl-β-D-maltopyranoside (13,14). Considering that the latter detergents are closely related to those mentioned above, the observation was unexpected, and it prompted us to unravel the mechanism responsible for the kinetic slowdown of the P-gp-ATPase.
For this purpose, we focused on the detergents' amphiphilicity, which reflects the balance between the hydrophobic and hydrophilic parts of a molecule. Qualitatively, amphiphilicity has long been known to be a hallmark of P-gp allocrits (for review, see Ambudkar et al. (15)), but in quantitative terms, its role is still elusive. We have recently shown that the polar part of the allocrit interacts with the transmembrane domains of the transporter, whereas the hydrophobic part seems to remain associated with the lipid membrane (11). This raised the question to what extent the interplay between the two types of interaction influence the rate of allocrit flopping. By choosing 34 detergents with systematically varying polar and hydrophobic contributions, including n-alkyl trimethyl ammonium chlorides (Cm-TAC), n-alkyl-β-D-glucopyranosides (Cm-gluc), and n-alkyl-β-D-maltopyranosides (Cm-malt), cyclohexyl-alkyl-β-D-maltopyranosides (Cymal-m, where the suffix m indicates the number of carbon atoms in the linear alkyl chain), and moreover thio-analogs of glucopyranosides, fluorinated analogs of maltopyranosides, and methyl-6-O-(N-heptylcarbamoyl)-α-D-glucopyranoside (Anameg-7), we were able to obtain very subtle changes in the hydrophobic and hydrophilic contributions (for structures, see Table S1 in the Supporting Material). Because the slowdown of the P-gp-ATPase by n-dodecyl-β-D-maltopyranoside in particular (13) and by detergents in general (for review, see Seelig and Gerebtkoff (16)) has often been attributed to membrane disordering, we also investigated the membrane-disordering power of the detergents.
First, we measured the detergent-induced ATPase activity in inside-out plasma membrane vesicles of MDR1-transfected mouse embryo fibroblasts, NIH-MDR1-G185, as a function of the detergent concentration and derived the free energy of binding from water to the transporter, (17). Second, we measured the Gibbs adsorption isotherm of the detergents to investigate their amphiphilicity and the detergent's free energy of lipid-water partitioning, , which reflects the hydrophobic interactions of the detergents with the lipid membrane, using surface-activity measurements and isothermal titration calorimetry (ITC). The free energy of binding from the lipid membrane to the first binding region of the transporter, , which reflects the hydrophilic interactions of the detergents with that region, were then determined as the difference between the two free energies, and (17). Third, we measured the order-parameter decrease of deuterated lipid membranes at the detergent concentrations inducing half-maximum P-gp-ATPase activation and inhibition using deuterium nuclear magnetic resonance (2H-NMR) spectroscopy (for review, see Seelig and Seelig (18)).
Membrane disordering as a cause of inhibition could be fully excluded. The analysis revealed that the rate of ATP hydrolysis by the P-gp-ATPase is highly sensitive to the balance between the hydrophobic anchor's affinity to the lipid membrane and the hydrophilic headgroup's affinity to the transporter. Small deviations from the optimal ratio lead to very low ATPase activity and flopping rates, whereas larger deviations lead to a lack of interaction in the case of detergents. An analogous analysis with modulators among drugs showed similar optimal ratios. In addition to yielding further insight into the activity cycle of the P-gp-ATPase, the analysis may also help in choosing the appropriate detergents in drug formulations (19) and ABC transporter purification, reconstitution, and crystallization.
Materials and Methods
Compounds
1-palmitoyl-2-oleoyl-sn-glycero-3-phosphocholine (POPC) and 1-palmitoyl (D31)-2-oleoyl-sn-glycero-3-phosphocholine were purchased from Avanti Polar Lipids (Alabaster, AL). Glucose, sucrose, trehalose, maltose, isopropyl-β-D-thiogalactopyranoside, and verapamil; n-hexyl-, n-heptyl-, n-octyl-β-D-glucopyranoside (Cm-gluc, m = 6–8), n-octyl-β-D-thioglucopyranoside (C8-Tgluc), and sucrose monolaurate (for all, purity ≥98%) were obtained from Sigma-Aldrich (Sternheim, Germany). n-Nonyl-, n-decyl-, and n-dodecyl-β-D-glucopyranoside (Cm-gluc, m = 9, 10, 12), methyl-6-O-(N-heptylcarbamoyl)-α-D glucopyranoside (Anameg-7), n-heptyl-, and n-nonyl-β-D-thioglucopyranoside (Cm-Tgluc, m = 7, 9), 3-cyclohexyl-1-propyl-β-D-glucopyranoside (Cyglu-3), n-hexyl-, n-octyl-, n-nonyl-, n-decyl-, n-undecyl-, n-dodecyl-, n-tridecyl, and n-tetradecyl-β-D-maltopyranoside (Cm-malt, m = 6, 8–14), cyclohexyl-methyl-, 2-cyclohexyl-1-ethyl-, 3-cyclohexyl-1-propyl-, 4-cyclohexyl-1-butyl-, 5-cyclohexyl-1-pentyl-, 6-cyclohexyl-1-hexyl-, and 7-cyclohexyl-1-hexyl-β-D-maltopyranoside (Cymal-m, m = 1–7), and (1H, 1H, 2H, 2H-perfluorooctyl)-β-D-maltopyranoside (FC8-malt) (for all, purity ≥99%), decyl trimethylammonium chloride (De-TAC, C10-TAC), dodecyl trimethylammonium chloride (DTAC, C12-TAC), tetradecyl trimethylammonium chloride (TTAC, C14-TAC), hexadecyl trimethylammonium chloride (HTAC, C16-TAC), and octadecyl trimethylammonium chloride (OTAC, C18-TAC) (for all, purity ≥95%) were purchased from Anatrace (Maumee, OH). Octanoylsucrose was purchased from Merck (Darmstadt, Germany) (purity ≥99%).
Cell line and plasma membrane preparation
MDR1-transfected mouse embryo fibroblasts (NIH-MDR1-G185) were a generous gift from Dr. M. M. Gottesman and Dr. S. V. Ambudkar (National Institutes of Health, Bethesda, MD). The crude plasma membrane vesicles were prepared as described previously (9,10).
Phosphate-release measurements
The P-gp-ATPase activity was determined by quantifying the release of inorganic phosphate using a colorimetric assay. Experiments were carried out in 96-well microtiter plates (Nunc F96 MicroWell plate, nontreated, Thermo Scientific, Waltham, MA) with reaction volumes of 60 μL containing 5 μg of protein. The release assay buffer (25 mM Tris-HCl with 50 mM KCl, 3 mM ATP, 2.5 mM MgSO4, 3 mM DTT, 0.5 mM EGTA, 2 mM ouabain, and 3 mM sodium azide) was adjusted to pH 7.0 at 37°C. Background experiments with vanadate were performed in parallel and the results obtained were subtracted from measurements. For the present investigation the basal P-gp-ATPase activity in the absence of drugs and detergents was 8.52 ± 1.5 nmol Pi min−1 mg−1. The allocrit-induced activities relative to the basal values were highly reproducible (for details, see Aanismaa and Seelig (9).
Kinetic data evaluation
The bell-shaped P-gp-ATPase activity curves were analyzed using the model proposed by Litman et al. (20,17). The model assumes transporter activation if one allocrit molecule is bound to the transporter and slowdown of transport (inhibition) if a second allocrit molecule is bound to the transporter and is based on uncompetitive inhibition. The rate of transport, Vs, as a function of allocrit concentration in aqueous solution, Cs, is expressed as
| (1) |
where V0 is the basal activity in the absence of allocrits, V1 is the maximum transporter activity (if only activation occurred), V2 is the activity at infinite allocrit concentration, K1 is the concentration of half-maximum activation, and K2 is the concentration of half-maximum inhibition. The equation was fitted to the experimental data using a least-squares method.
Surface activity measurements and ITC
The air-water partition coefficient, Kaw, and the cross-sectional area, AD, of compounds were determined by surface activity measurements using a Fromherz trough (21), as described previously for other compounds (22,23).
ITC was performed with a VP ITC instrument (Microcal, Northampton, MA) at 25°C and 37°C. Buffer solutions (10 mM Tris with 100 mM NaCl or 50 mM Tris with 114 mM NaCl) were freshly prepared and adjusted to pH 7.4 at 25°C and 37°C. Aliquots (5–10 μl) of a suspension of large (100-nm) unilamellar vesicles (LUVs) were injected into the reaction cell (1.4037 ml or 1.4147 ml) containing degassed detergent solution at a concentration half the critical micelle concentration (CMC), C ≤ CMC/2 (for CMCs, see Table 1). Large (100-nm) and small (∼30 nm) unilammelar vesicles (LUVwere prepared as described previously (24,25).
Table 1.
Thermodynamic and kinetic constants
| Compound | Kaw(M−1) | CMC(M) | Klw apparent(M−1) | ΔH0(kJ/mol) | K1(M) | rb(1) | V1(%) | K2(M) | rb(2) | ‖‖ |
|---|---|---|---|---|---|---|---|---|---|---|
| C10-TAC | 2.16 × 10³ | 5.32 × 10⁻² | 4.17 × 101§ | n.m | 2.68 × 10⁻³‖ | 1.12 × 10⁻¹ | 372‖ | n.d. | n.d. | 3.2 |
| C12-TAC | 1.54 × 10⁴ | 7.15 × 10⁻³ | 3.50 × 10²§§ | −9.74§§ | 1.59 × 10⁻⁴‖ | 1.39 × 10⁻¹ | 344‖ | n.d. | n.d. | 4.1 |
| C14-TAC | 2.11 × 10⁵ | 7.00 × 10⁻⁴ | 3.70 × 10³§§ | −8.51§§ | 3.02 × 10⁻⁵‖ | 1.12 × 10⁻¹ | 247‖ | n.d. | n.d. | 4.9 |
| C16-TAC | 1.50 × 10⁶ | 9.42 × 10⁻⁵ | 1.70 × 10⁴§§ | −4.81§§ | 4.40 × 10⁻⁶‖ | 7.48 × 10⁻² | 153∗∗ | n.d. | n.d. | 5.7 |
| C18-TAC | 1.35 × 10⁷ | 1.40 × 10⁻⁵ | 1.50 × 10⁵§§ | −0.76§§ | — | — | — | — | — | 6.6 |
| C6-gluc | 3.97 × 10² | 2.50 × 10⁻¹‡ | 7.20 × 100§ | n.m. | 2.17× 10⁻² | 1.32 × 10⁻¹ | 125 | 3.64 × 10⁻² | 2.22 × 10⁻¹ | 2.3 |
| C7-gluc | 1.85 × 10³ | 7.90 × 10⁻² | 3.00 × 101§ | n.m. | 2.16 × 10⁻³ | 6.48 × 10⁻² | 309 | 8.14 × 10⁻³ | 2.44 × 10⁻¹ | 2.8 |
| C8-gluc | 1.02 × 10⁴ | 2.30 × 10⁻²∗ | 1.20 × 10²† | 6.70† | 1.75 × 10⁻⁴ | 2.10 × 10⁻² | 110† | 3.54× 10⁻³ | 4.25 × 10⁻¹ | 3.2 |
| C9-gluc | 1.68 × 10⁴ | 6.50 × 10⁻³ | 5.20 × 10²¶¶ | 5.40¶¶ | n.d. | n.d. | 100 | 7.92 × 10⁻⁴ | 4.12 × 10⁻¹ | 3.7 |
| C10-gluc | 9.76 × 10⁴ | 2.20 × 10⁻³ | 1.60 × 10³∗ | 4.90∗ | n.d. | n.d. | 100 | 3.26 × 10⁻⁴ | 5.22 × 10⁻¹ | 4.2 |
| C12-gluc | 1.48 × 10⁶ | 1.12 × 10⁻⁴ | 2.26 × 10⁴§ | −0.70‡‡ | n.d. | n.d. | n.d. | n.d. | n.d. | 5.1 |
| C7-Tgluc | n.m. | 2.90 × 10⁻²‡ | 6.00 × 101¶ | n.m. | n.d. | n.d. | 100 | 6.35 × 10⁻³ | 3.81 × 10⁻¹ | n.d. |
| C8-Tgluc | 2.11 × 10⁴ | 9.00 × 10⁻³‡ | 2.40 × 10²† | −0.34† | n.d. | n.d. | 100 | 1.46 × 10⁻³ | 3.50 × 10⁻¹ | n.d. |
| C9-Tgluc | 4.41 × 10⁴ | 2.20 × 10⁻³ | 1.04 × 10³§ | n.m. | n.d. | n.d. | 113 | 2.20 × 10⁻⁴ | 2.50 × 10⁻¹ | n.d. |
| Anameg-7 | 7.87 × 10³ | 1.95 × 10⁻²‡ | 100†† | 0.80†† | 3.59 × 10⁻⁴ | 3.59 × 10⁻² | 260 | 1.60 × 10⁻³ | 1.60 × 10⁻¹ | 2.7 |
| Cyglu-3 | n.m. | 2.80 × 10⁻²‡ | n.m. | n.m. | n.d. | n.d. | 114 | 8.40 × 10⁻³ | n.d. | n.d. |
| C6-malt | 6.84 × 10² | 2.10 × 10⁻¹‡ | n.m. | n.m. | n.d. | n.d. | 100 | 3.30 × 10⁻² | 4.82 × 10⁻² | 0.9 |
| C8-malt | 7.55 × 10³ | 2.34 × 10⁻² | 2.50 × 101∗ | 10.00∗ | n.d. | n.d. | 106 | 2.89 × 10⁻³ | 7.32 × 10⁻² | 1.4 |
| C9-malt | 4.39 × 10⁴ | 6.00 × 10⁻³‡ | 1.00 × 10²∗ | n.m. | n.d. | n.d. | 100 | 2.86 × 10⁻⁴ | 2.86 × 10⁻² | 1.7 |
| C10-malt | 1.55 × 10⁵ | 2.02 × 10⁻³ | 2.00 × 10²∗ | 14.00∗ | n.d. | n.d. | 100 | 1.60 × 10⁻⁴ | 3.20 × 10⁻² | 1.9 |
| C11-malt | n.m. | 5.90 × 10⁻⁴‡ | 7.68 × 10²‡‡ | 4.77‡‡ | n.d. | n.d. | 100 | 3.24 × 10⁻⁵ | 2.49 × 10⁻² | 2.2 |
| C12-malt | 9.76 × 10⁵ | 1.70 × 10⁻⁴ | 5.00 × 10³∗ | 4.00∗ | n.d. | n.d. | 100 | 2.53 × 10⁻⁵ | 1.26 × 10⁻¹ | 2.5 |
| C13-malt | 4.08 × 10⁶ | 4.10 × 10⁻⁵ | 1.40 × 10⁴‡‡ | 0.27‡‡ | 5.04 × 10⁻⁷ | 7.06 × 10⁻³ | 154 | 1.75 × 10⁻⁶ | 2.45× 10⁻² | 2.7 |
| C14-malt | 1.27 × 10⁷ | 1.30 × 10⁻⁵‡ | 4.60 × 10⁴‖‖ | n.m. | n.d. | n.d. | 100 | n.d. | n.d. | 3.0 |
| Cymal -1 | n.m. | 3.60 × 10⁻¹‡ | n.m. | n.m. | n.d. | n.d. | 100 | 8.61 × 10⁻² | n.d. | n.d. |
| Cymal -2 | n.m. | 1.04 × 10⁻¹‡ | n.m. | n.m. | n.d. | n.d. | 100 | 3.13 × 10⁻² | n.d. | n.d. |
| Cymal -3 | n.m. | 2.90 × 10⁻²‡ | 2.90 × 101¶ | n.m. | n.d. | n.d. | 100 | 4.44 × 10⁻³ | 1.29 × 10⁻¹ | n.d. |
| Cymal -4 | n.m. | 7.30 × 10⁻³‡ | 1.04 × 10²¶ | n.m. | n.d. | n.d. | 100 | 1.10 × 10⁻³ | 1.14 × 10⁻¹ | n.d. |
| Cymal -5 | n.m. | 2.20 × 10⁻³‡ | 3.50 × 10²†† | 1.05†† | n.d. | n.d. | 100 | 2.85 × 10⁻⁴ | 9.98 × 10⁻² | n.d. |
| Cymal -6 | n.m. | 5.60 × 10⁻⁴‡ | 1.50 × 10³†† | −0.46†† | n.d. | n.d. | 100 | 9.33 × 10⁻⁵ | 1.40 × 10⁻¹ | n.d. |
| Cymal -7 | n.m. | 1.90 × 10⁻⁴‡ | 4.50 × 10³†† | −0.31†† | n.d. | n.d. | 100 | 2.75 × 10⁻⁵ | 1.24 × 10⁻¹ | n.d. |
| FC8-malt | n.m. | 1.02 × 10⁻³‡ | 4.00 × 10²†† | 2.01†† | n.d. | n.d. | 100 | 3.54 × 10⁻⁴ | 1.42× 10⁻¹ | n.d. |
| Octanoylsucrose | n.m. | 1.12 × 10⁻⁴ | n.m. | n.m. | n.d. | n.d. | 100 | 7.79 × 10⁻⁴ | n.d. | n.d. |
| Sucrose monol. | 1.10 × 10⁶ | 2.14 × 10⁻⁴ | n.m. | n.m. | n.d. | n.d. | 100 | 2.63 × 10⁻⁵ | n.d. | n.d. |
n.m., not measured; n.d., not determined.
Data taken from Heerklotz (38).
Data taken from Wenk and Seelig (39).
Anatrace catalog.
Determined from surface activity measurements.
Obtained from linear regression of as a function of alkyl chain length, m.
Evaluated from simple Michaelis-Menten equation.
Maximum P-gp activity taken directly from measurement data.
Measured for LUVs (100 nm) at 37°C.
Measured for LUVs (100 nm) at 25°C.
Measured for SUVs (30 nm) at 37°C.
Measured for SUVs (30 nm) at 28°C.
Calculated from incremental values, except for Anameg-7.
The molar binding enthalpy of detergent binding to lipid vesicles (25) and the detergent/lipid molar ratio after i injections, was determined as
| (2) |
where is the molar amount of bound detergent after i injections and is the total molar amount of lipid. The partition coefficient, Klw, describes a linear relation between the equilibrium concentration of the detergent free in solution, Ceq, and the detergent/lipid molar ratio, rb,
| (3) |
For most compounds, it can be assumed that the aqueous concentration, Ceq, in Eq. 3 corresponds to the concentration in aqueous solution, Cs (Eq. 1). The detergent/lipid molar ratio, rb, in the cytosolic membrane leaflet at the concentration of half-maximum activation, K1, can thus be estimated as (26,7),
| (4) |
2H-NMR measurements
Lipid bilayers composed of perdeuterated 1-palmitoyl (D31)-2-oleoyl-sn-glycero-3-phosphocholine (POPC) and nondeuterated POPC (molar ratio of 1:4) were prepared by mixing the lipids in chloroform, which was subsequently removed under high vacuum. The dried lipid mixture (8–10 mg) was suspended in deuterium-depleted water (∼300 μl). Detergents were added (5–15 μl) to obtain the required final detergent/lipid molar ratio using Eq. 4. The suspension was vortexed, freeze-thawed for at least five cycles, filled into the NMR tube, and sealed. Experiments were performed on a Bruker Avance 400 MHz spectrometer (Bruker, Billerica, MA). 2H-NMR spectra were recorded at 61 MHz using a pulse-acquire sequence. Sixty thousand scans were acquired with an excitation pulse length of 5 μs and a recycle delay of 250 ms. The molecular order parameter, Smol, was derived from the quadrupole splitting, Δνq (18).
Results
P-gp-ATPase activity as a function of detergent concentration
The P-gp-ATPase activity was monitored by measuring the rate of phosphate release in inside-out plasma membrane vesicles of NIH-MDR1-G185 cells. The detergents were applied in the concentration range C ≤ 0.001 CMC to C ∼ 0.5 CMC and experiments were performed under steady-state conditions at 37°C and pH 7.0. Fig. 1, A–C, shows the P-gp-ATPase activity measured as a function of the concentration for the three series of detergents Cm-TAC, Cm-gluc, and Cm-malt exhibiting different anchor lengths. Analogous titrations were performed with Cymal-m (m = 1–7) (not shown). The P-gp-ATPase activity curves were bell-shaped, as seen previously for drugs. Fig. 1 D displays the comparison of the P-gp-ATPase activity-versus-concentration curves for detergents with identical anchor length and different headgroups (C7-gluc, Cyglu-3, C7-Tgluc, and Anameg-7). The total number of C-atoms in the hydrophobic anchor of Cyglu-m and Cymal-m (including the cyclohexyl ring) correspond to m + 6, where m is the number of C-atoms in the linear alkyl chain. However, the length of the anchors corresponds approximately to m + 4 C-atoms. The solid lines in Fig. 1, A–D, are fits to the data using Eq. 1. The resulting kinetic parameters are summarized in Table 1.
Figure 1.
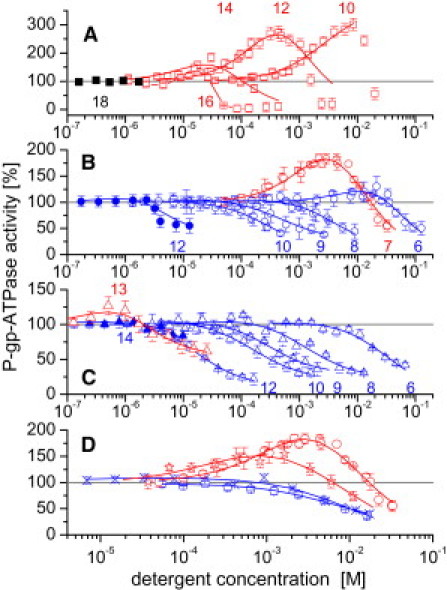
P-gp-ATPase activity measured in plasma membrane vesicles of NIH-MDR1-G185 cells as a function of the detergent concentration for Cm-TAC (red open and black solid squares), m = 10–18 with increments of 2 (A); Cm-gluc (red open, blue open, and blue solid circles), m = 6–10, 12 (B); Cm-malt (red open, blue open, and blue solid triangles), m = 6, 8–10, and 12–14 (C); and detergents with different headgroups and an anchor length of seven carbon atoms: C7-gluc (red open circles), Anameg-7 (red stars), Cyglu-3 (blue exes), and C7-Tgluc (blue pentagons) (D). Measurements were performed at pH 7.0 and T = 37°C. Detergent concentrations remained always below 0.5 × CMC. Red symbols indicate compounds with an optimal ratio and blue symbols indicate analogs for which the free-energy ratio, , is higher or lower. The latter compounds downregulate or inhibit the P-gp-ATPase. The analogs with the longest alkyl chains showed only a reduced (blue solid circles and blue solid triangles) or no interaction (black solid squares). Data are expressed as the average of two measurements. Solid lines represent fits to data using Eq. 1. Gray horizontal line represents basal P-gp-ATPase activity taken as 100% (ln100 = 4.605).
A detailed inspection of Fig. 1, A–C, shows that the concentration of half-maximum activation, K1, and inhibition, K2, decreased with increasing anchor length for each of the three series of detergents. The maximum activity, V1, and minimum activity, V2, showed, in contrast, no simple anchor-length dependence. The analogs exhibiting the highest activity in each series, C10-TAC, C7-gluc, and C13-malt, carried anchors of different lengths. The analogs with shorter or longer anchors showed less activity or only inhibited the P-gp-ATPase. The analogs with the longest anchors did not interact with P-gp (C18-TAC), or only to a reduced extent (C12-gluc and C14-malt). As seen in Fig. 1 D, C7-gluc activated, whereas Cyglu-3 and C7-Tgluc inhibited, the ATPase. Due to the slight increase in hydrophobicity in the latter two cases, the concentration of half-maximum activation, K1, as well as the maximum activity, V1, decreased (Table 1). In that regard, it is interesting to note that Anameg-7, which also showed a reduced K1 value compared to C7-gluc, still significantly activated the P-gp-ATPase.
For control, the P-gp-ATPase activity in inside-out plasma membrane vesicles of NIH-MDR1-G185 cells was measured as a function of glucose (0–223 mM), sucrose (0–182 mM), trehalose (0–133 mM), maltose (0–6 mM), and isopropyl-β-D-thiogalactopyranoside (0–1.08 mM) concentrations, respectively. Under the conditions measured, no effects on P-gp-ATPase activity were observed, demonstrating that an interaction with P-gp requires a hydrophobic anchor of a certain length that pulls the sugar moieties into the headgroup region of the lipid bilayer.
Air-water and lipid-water partitioning of detergents
The surface pressure, π, was measured as a function of the detergent concentration (Gibbs adsorption isotherm) in a monolayer trough (Fig. 2, A–D). The surface pressure increased with the detergent concentration up to the CMC and then reached a plateau. The detergents were strongly surface active, which is typical for highly amphiphilic compounds, and all exhibited a maximum surface pressure of π ∼ 40 mN/m. No simple correlation between P-gp-ATPase activation/inhibition (Figs. 1, A–C, and 2, A–C, respectively) surface activity was observed.
Figure 2.
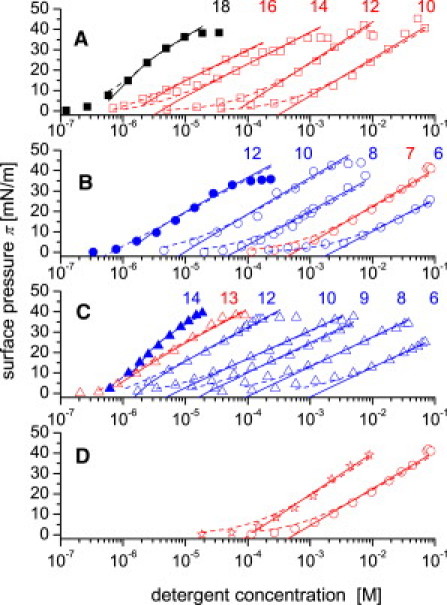
Surface activity measured as a function of the detergent concentration for Cm-TAC (red open and black solid squares), m = 10–18 (A); Cm-gluc (red open, blue open, and blue solid circles), m = 6–8, 10, 12 (B); Cm-malt, (red open, blue open, and blue solid triangles), m = 6, 8–10, 12–14 (C); and Anameg-7 (red stars) and C7-gluc (red open circles) (D). Measurements were performed at pH 7.4 (50 mM Tris/HCl, 114 mM NaCl), T = 24°C. Solid lines represent fits to data using Gibbs adsorption isotherm; dashed line represents the binding isotherm calculated with the Szyszkowski equation (22,23). Color code, see legend to Fig. 1.
Analysis of the Gibbs adsorption isotherm yielded the air-water partition coefficient, Kaw, the CMC (Table 1), and the cross-sectional area, AD, of the molecule in its amphiphilic orientation at the air-water interface. The cross-sectional areas were determined as AD = 54.0 ± 4.4 Å2, AD = 56.5 ± 3.5 Å2, and AD = 64.0 ± 3.8 Å2 for Cm-TAC, Cm-gluc, and Cm-malt, respectively.
The parameters Kaw and CMC were used for assessing the concentration range for P-gp-ATPase activity measurements (27). Under conditions where ITC was not sensitive enough, as, e.g., for C10-TAC, C6-Gluc, and C12-Gluc, the parameters Kaw and AD were further used to assess the lipid-water partition coefficient, Klw, (17,22),
| (5) |
where kT is the thermal energy/molecule, πM is the lateral packing density of the membrane, Ψ is the surface potential of the membrane, z is the molecular charge, F is the Faraday constant and RT is thermal energy/mole. The lateral packing density in POPC membranes at 37°C was assumed to correspond to the lateral packing density of a monolayer with a surface pressure of πM = 30 mN/m. This is somewhat lower than the lateral packing density of POPC bilayers at room temperature (28) but identical to that determined for NIH-MDR1-G185 plasma cell membranes (17). The surface potential of the cytosolic membrane leaflet, Ψ, is negative in the absence of cations (e.g., magnesium and drugs) but can become neutral or even positive in the presence of cations. The lipid-water partition coefficient for charged compounds was therefore calculated for a neutral membrane (Ψ = 0 mV) (Table1), as well as for a membrane with a negative surface potential of Ψ = −30 mV (Table S3).
The binding constants of the remaining detergents were determined by ITC. To this purpose the lipid vesicles were titrated into detergent solutions, which provided the enthalpy of membrane partitioning, . Partitioning was exothermic for the cationic Cm-TAC and essentially endothermic for the nonionic detergents (except for the longer analogs) at 25°C or 37°C (Table 1). The enthalpy, , showed no linear chain-length dependence upon detergent partitioning into the lipid membrane, most likely due to the superposition of several processes, including 1), the release of ordered water molecules (i.e., desolvation), which increases with increasing chain length; 2), cavity formation in the lipid membrane, which essentially depends on the cross-sectional area of the detergent, not on the chain length (29,22); and 3), membrane disordering, which is inversely proportional to the length of the detergent (30). Despite the lack of linearity, partitioning of the shorter analogs was clearly more endothermic, and thus more entropy driven, than partitioning of the longer analogs (see also (31,32)). The detergent/lipid molar ratios, rb, and the corresponding lipid-water partition coefficients, Klw, were determined using Eqs. 2 and 3, respectively (Table1).
The lipid-water partition coefficient, Klw, determined for an electrically neutral membrane according to Eq. 3 is concentration-independent for electrically neutral detergents. However, for Cm-TAC, the lipid-water partition coefficient, Klw, decreased with increasing concentration because the cationic headgroup induced a positive membrane surface potential. For C12-TAC, a concentration-independent partition coefficient that reflects the hydrophobic interactions of the detergent at infinitely low concentration has been determined previously by taking into account the charge effects using the Gouy-Chapman theory ( = 3.5 × 10³ M−1 at 35°C) (24). It is about one order of magnitude higher than the apparent partition coefficient, Klw calculated at the concentration of half-maximum P-gp-ATPase activation, K1 (Table 1). Here, we used the apparent Klw for POPC because the concentration of half-maximum activation, K1, is also an apparent value.
The detergent/lipid molar ratio, rb(1), at the concentration of half-maximum activation, K1, was determined according to Eq. 4. An analogous equation was used to calculate the detergent/lipid molar ratio at the concentration of half-maximum inhibition, K2, rb(2). For a given series of detergents, the detergent/lipid molar ratios rb(1) and rb(2) are rather constant, because the concentrations of half-maximum activation and inhibition, K1 and K2, respectively, decrease with increasing lipid-water partition coefficient, Klw, whereas the transporter-lipid binding constant, Ktl, remains constant for a given headgroup (Table 1).
Free energy of detergent partitioning into the air-water, lipid-water, and lipid-transporter interfaces
The concentrations of half-maximum activation and inhibition, K1, and K2, obtained from kinetic P-gp-ATPase activity measurements were considered as constants of dissociation from the first and the second binding regions, respectively, and the inverse as transporter-water binding constants to the first and the second binding regions, and , respectively (17). For simplicity, the free energy of air-water partitioning, , the free energy of lipid-water partitioning, , and the free energy of binding to the first, , and second, , binding regions of the transporter are abbreviated as ,
| (6) |
where Cw is the concentration of water (Cw = 55.3 M at 37°C) and Kx represents the corresponding partition coefficient or binding constant, with the dimension M−1.
The free energy of binding from the lipid membrane to the first binding region of the transporter, was determined as the difference between the free energy of binding from water to the transporter, and the free energy of lipid-water partitioning, ,
| (7) |
An analogous equation can be formulated for the second binding region. Fig. 3, A–C, displays the allocrit's free energy of lipid-water partitioning, , free energy of transporter-water binding to the first (second) binding region, , and the free energy of transporter-lipid binding to the first (second) binding region, as a function of the lengths, m, of the detergents' hydrophobic anchors. In the case of Cm-TAC (Fig. 3 A), binding to the first binding region is shown, and in the case of Cm-gluc (Fig. 3 B), Cm-malt, and Cymal-m (Fig. 3 C), binding to the second binding region is shown. The slopes of the curves reveal the free-energy contributions per methylene group to allocrit partitioning into the membrane and allocrit binding from water to the first binding region of the transporter. They were determined as = −2.61 ± 0.09 kJ/mol and = −2.89 ± 0.18 kJ/mol for Cm-TAC, = −3.34 ± 0.19 kJ/mol and = −3.07 ± 0.17 kJ/mol for Cm-gluc, and = −3.38 ± 0.28 kJ/mol and = −3.25 ± 0.30 kJ/mol for Cm-malt. The free-energy contributions per methylene group in Cymal-m were very similar to those of Cm-malt (Fig. 3 C). The present values are also in good agreement with literature data from Li-Blatter and Seelig ((11) and references therein) and Beck (24). The free energy of transporter-lipid binding, and , respectively (determined according to Eq. 7), was independent of the anchor length. The free energy of air-water partitioning, , and the free energy of self-association, , were also plotted versus the number of carbon atoms in the hydrophobic anchors (data not shown), which revealed similar free-energy contributions per methylene group (Table S2).
Figure 3.
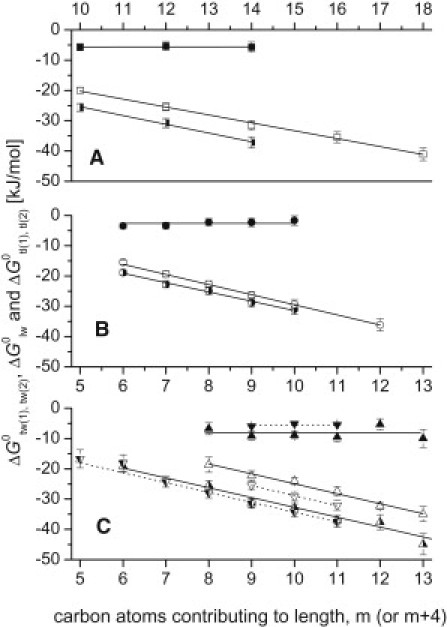
Free energy of allocrit binding from water to the first (second) binding region of the transporter (half-filled symbols), free energy of membrane partitioning, (open symbols), and free energy of allocrit binding from the lipid membrane to the first (second) binding region of the transporter (solid symbols) plotted as a function of the number of carbon atoms contributing to the length of the hydrophobic anchor, m (and m + 4 in the case of Cymal-m). (A) Cm-TAC (half-filled, open, and solid squares). (B) Cm-gluc (half-filled, open, and solid circles). (C) Cm-malt (half-filled, open, and solid triangles) and Cymal-m (half-filled, open, and solid inverted triangles and dashed lines). Linear fits to data are shown for and . Excluded from the fits are the free energies of lipid-water partitioning, , for C6- and C7-gluc and free energies of transporter-water binding, for Cymal-1 and Cymal-2. The values were calculated according to Eq. 7 (average of data).
The intercepts in Fig. 3, A–C, and analogous plots for and reflect the free energies of partitioning of the polar headgroups into the different interfaces in the hypothetical absence of the hydrophobic anchor. For the trimethyl ammonium moiety, the free energy of partitioning into the air-water interface, , was slightly negative, whereas the free energy of self-association or micelle formation, , of lipid-water partitioning, , and of binding from water to the transporter, , respectively, were positive. For the glucose and the maltose moieties, the free energies of partitioning into the air-water interface, , were negative and similar. The free energies of micelle formation, , were also similar but positive, which reflects the mutual repulsion between sugar moieties exhibiting similar cross-sectional areas. However, the free energy of partitioning into the lipid-water interface, , was about twice as large for the maltose as for the glucose moiety, despite the fact that the cross-sectional areas of the two were similar, as determined from surface activity measurements. This suggests that the headgroups inserted into the lipid membrane as indeed demonstrated previously for Cm-gluc (33) and may explain why Cm-malts are stronger detergents than Cm-glucs (25). The free energy of partitioning of the glucose and maltose moieties from water into the second binding region of the transporter, , was close to zero. Except for Cm-TAC (for which the intercepts are least precise because of the far extrapolation), the free energies of binding from the membrane to the transporter, (or ) were estimated to be in good agreement with the values determined according to Eq. 7 (for details see Table S2).
The detergents with different sugar headgroups also allowed us to test whether the interaction with the transporter depends on the stereochemistry of the molecule. The similarity of K2 and CMC values (the latter correlating with lipid-water partition coefficients (25)) for C12-malt and sucrose monolaurate, on one hand, and C8-malt and octanoylsucrose, on the other (Table 1), suggest that P-gp is highly permissive with respect to stereoisomerism.
Membrane disordering by detergents measured by 2H-NMR
To assess the membrane disordering effect of C12-TAC, C8-malt, and C12-malt at the relevant concentrations, we measured the order parameter, Smol (18), of perdeuterated POPC bilayers using 2H-NMR at 35°C up to a detergent/lipid molar ratio of rb = 0.4 (see Fig. S1, for example). A plot of the order parameter, Smol, of the C-2 segment of the fatty acyl chains as a function of detergent/lipid molar ratio, rb, is shown in Fig. 4, A–C. Detergent partitioning into the lipid bilayer leads to membrane disordering. The order-parameter decrease relative to the order parameter in the absence of detergents, taken as 100%, was determined as 2.5% for C12-TAC at the detergent/lipid molar ratio, rb(1), and as 3.8% for C8-malt and 3.5% for C12-malt, both at the detergent/lipid molar ratio rb(2). Because Cm-malt exhibits a high affinity to the transporter, the detergent/lipid molar ratio rb(2) was relatively low (Table 1) and membrane disordering was therefore also relatively low, despite the fact that Cm-malt detergents are stronger than, e.g., Cm-gluc (25).
Figure 4.
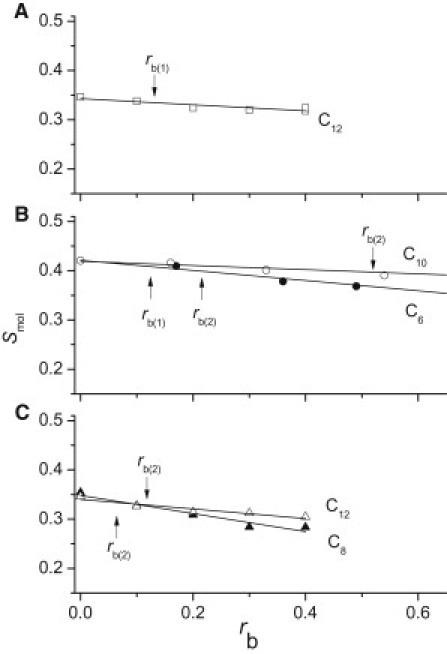
Variation of the molecular order parameter, Smol, at the segment C-2 in the fatty acyl chain of lipids as a function of the bound detergent/lipid ratio, rb, for C12-TAC (open squares) in POPC at 35°C (A), C6-gluc (solid circles) and C10-gluc (open circles) in DPPC at 45°C (taken from Meier and Seelig (30)) (B), and C8-malt (solid triangles), and C12-malt (open triangles) in POPC at 35°C (C). Solid lines represent the linear regressions.
Membrane disordering by Cm-gluc was monitored previously in 1,2-dipalmitoyl-sn-glycero-3-phosphocholine bilayers (DPPC) selectively deuterated at the C-2, C-7, and C-16 segments of the acyl chains (30). Experiments were performed at 45°C, slightly above the crystalline-to-liquid-crystalline phase transition (Fig. 4 B). Insertion of Cm-gluc led to selective disordering of the membrane wherein the headgroup region remained largely unaffected. The order parameter of the lipid bilayer decreased with increasing concentration of detergents, and the decrease was more pronounced for detergents with shorter than for those with longer chain lengths. The percentages of reduction of the molecular order parameter, Smol, at the C-2 segment upon addition of C6-gluc, C7-gluc, and C8-gluc at the detergent/lipid molar ratios rb(1) and rb(2) were 2.5%, 1.2%, and 0.4%, and 4.2%, 4.6% and 8.1%, respectively. The most P-gp-ATPase-activating detergent of the three (C7-gluc) had a higher membrane-disordering effect at detergent/lipid molar ratio rb(1) than the least P-gp-ATPase-activating detergent (C8-gluc) (30). Moreover, the most P-gp-ATPase-inhibiting detergent, C12-malt (see above), was less membrane-disordering at the detergent/lipid molar ratio rb(2) than the least P-gp-ATPase inhibiting detergents Cm-gluc (m = 6–8). It should be noted that these reductions are small compared to the 24.6% reduction of the order parameter in POPC at the C2 segment upon insertion of C8-gluc at the critical detergent/lipid molar ratio ( = 1.3) (33).
Discussion
Membrane disordering as the cause of P-gp inhibition can be excluded
Using 2H-NMR, we provided direct evidence for the negligibly small membrane-disordering effect of detergents examined in this study at concentrations relevant for P-gp-ATPase activity (Fig. 4, A–C). The lack of a positive correlation between the extent of P-gp-ATPase inhibition and membrane disordering makes it possible to exclude membrane disordering as the cause of P-gp-ATPase inhibition. Membrane partitioning of drugs such as verapamil leads to similar or even more pronounced membrane-disordering effects (34). Membrane-embedded transporters such as P-gp thus seem to cope well with small packing-density fluctuations in their environment (see also Aanismaa et al. (35)).
Allocrit amphiphilicity as such is not sufficient for P-gp-ATPase activation
We investigated the amphiphilicity of different detergents by means of surface activity measurements. All detergents were highly surface active and reached a similar maximum surface pressure, indicating that all detergents were strongly amphiphilic (Fig. 2, A–C). Nevertheless, they stimulated the P-gp-ATPase to very different extents. The observation that amphiphilicity as such was not sufficient to activate the P-gp-ATPase raised the question of whether a certain balance between hydrophobic and hydrophilic forces was required for optimal P-gp-ATPase activity.
The correlation between binding affinity and rate of transport
To get further insight into the mechanism underlying the large variations in the detergent-induced P-gp-ATPase activities we quantified the affinity of binding of detergents to the lipid membrane and to the transporter. Binding of the detergents discussed in this study to the lipid membrane was driven by the hydrophobic effect, with free-energy contributions per methylene group determined as ≈ −2.6 kJ/mol for the cationic Cm-TAC and as ≈ −3.3 kJ/mol for the electrically neutral Cm-gluc and Cm-malt. The free-energy contributions from polar headgroups were positive (Table S2). Binding of the detergents to the transporter is due exclusively to weak electrostatic interactions (i.e., hydrogen bonding or cation-π interactions) between the TMDs and the polar headgroups, whereas the hydrophobic part remained associated with the lipids, as shown previously for CmEOn (11).
Fig. 5 A displays the rate of ATP hydrolysis, V1 (log scale), as a function of the detergent's free energy of binding from water to the first binding region of the transporter, . For 7 of 34 detergents measured (Cm-TAC (m = 10–16), C7-gluc, Anameg-7, and C13-malt), the rate of ATP hydrolysis (log scale) decreased linearly with decreasing free energy of binding from water to the transporter, , as observed previously for drugs (9) and other detergents (10,11). Although structurally closely related, the remaining 27 detergents reduced the ATPase activity of P-gp much more than expected on the basis of their free energy of binding from water to the transporter, . For 6 of 27 molecules (C12EO3, C6-gluc, C8-gluc, C12-malt, and C14-malt), K1 and V1 values could still be determined (Fig. 5 A). For the remaining 21 detergents only K2 and V2 values are available (Table 1). The V2 values dropped to ∼20% for all detergents. None of the compounds inhibited the ATPase activity completely below the CMC, which suggests that detergents were still flopped at a low rate.
Figure 5.

P-gp-ATPase activity, V1 (log scale) (where V1 is expressed as rate relative to basal activity, taken as 100%), versus free energy of allocrit binding from water to the first binding region of the transporter, (A), and versus the ratio, (B and C). For Cm-TAC (squares), Cm-gluc (circles), and Cm-malt (triangles), and Anameg-7 (stars), where numbers represent the alkyl chain length, m. Previously measured polyoxyethylene alkyl ethers (asterisks) were added for comparison: Triton X-100 (tr), Tween-80 (tw) (10), and C12EOn (E, where numbers correspond to n) (11). The gray horizontal line represents basal P-gp-ATPase activity. For each series, Cm-TAC, Cm-gluc, and Cm-malt (B), and C12EOn (C), values for the different compounds in a series are connected with dotted lines. Red symbols indicate compounds that activate the P-gp-ATPase as expected, because they exhibit an optimal ratio, and blue symbols indicate analogs that downregulate or inhibit the P-gp-ATPase because the free-energy ratio, , is either too high or too low.
Compared to the activating C7-gluc, the closely related inhibitory analogs revealed a more negative free energy of lipid-water partitioning. The reduction was determined as ≈ −3.3 kJ/mol (C8-gluc), ≈ −2.7 kJ/mol (Cyglu-3) (estimated from the CMCs (25)), and ≈ −1.8 kJ/mol) (C7-Tgluc). This group of modulators (C8-gluc, Cyglu-3, and Tgluc) thus showed a higher affinity to the membrane relative to C7-gluc. The second group of modulators (C8-malt and Cymal-3) exhibited almost the same affinity to the membrane as C7-gluc (Table 1) but a higher affinity to the transporter, due to the duplication of the sugar moiety (Table S1). Duplication of the sugar moiety in detergents may be compared with duplication of the hydrogen-bond-donor motifs in drugs, which also lead to a shift from activation to inhibition of the P-gp-ATPase (36). Enhancing the affinity to the membrane (at constant affinity to the transporter) or enhancing the affinity to the transporter (at constant affinity to the membrane) thus caused a slowdown of the ATPase activity. Increasing both affinities as in Anameg-7 (Fig. 2 D) preserved the optimal balance found for C7-gluc. Anameg-7 therefore behaved like an ideal P-gp allocrit (Fig. 2 D).
Fast hydrolysis—slow hydrolysis—no hydrolysis: a matter of balance between affinities of allocrit to the lipid membrane and the transporter
The above data suggest that the balance between the affinity of the detergent's hydrophobic anchor to the lipid membrane and the detergent's polar headgroup to the TMDs is crucial for the rate of ATP hydrolysis and transport by P-gp. To illustrate the role of the balance between the two affinities, we plotted the P-gp-ATPase activity (log scale) as a function of the ratio q of the two free energies of binding, for the series Cm-TAC, Cm-gluc, Cm-malt, and C12EOn (Fig. 5 B). For the electrically neutral compounds, Cm-gluc, Cm-malt, C12EOn, and CmEO8 (not included for clarity), the optimal ratio was consistently around q = 2.7 ± 0.2. This is remarkable considering the fact that the concentration of half-maximum activity of the most activating Cm-gluc (m = 7) is about four orders of magnitude higher than the concentration of half-maximum activity, K1, of the most activating Cm-malt (m = 13) (Fig. 1 C). The same optimum ratio was also observed for Anameg-7. The optimum ratio q for the permanently charged Cm-TAC is higher than that for the neutral compounds, suggesting that the cationic charge has an additional repulsive function and may support the flopping process. The ATPase activity of the series varying in alkyl chain lengths (Cm-TAC, Cm-gluc, and Cm-malt) (Fig. 5 B) revealed a steeper dependence on the ratio q than the series varying in the number of ethoxyl groups (C12EOn) (Fig. 5 C). A high affinity of the detergent's alkyl chain to the lipid relative to the affinity of the detergent's headgroup to the TMDs and vice versa seems to reduce the rate of flopping. These data further support (4,5) the idea that allocrit transport is the rate-limiting step.
Beyond a certain alkyl chain length the inhibitory potency of the detergents decreased and finally even disappeared (Fig. 1). The limiting length of the hydrophobic anchor was m = 18 for Cm-TAC, m > 12 for Cm-gluc, and m > 14 for Cm-malt. In the case of CmEO8, a reduced inhibition was also observed for m = 14 and no interaction was seen for m = 16 (11). Since there are differences not only among the limiting lengths of the hydrophobic anchors, but in the entire molecular length, a steric length constraint seems unlikely. The lack of an interaction with the P-gp-ATPase therefore seems due instead to the lipid affinity being too high relative to the transporter affinity. This prevents occlusion of the transport pathway and imparts selectivity to transport by P-gp.
Similar principles for detergents and drugs
The neutral detergents are ideal model systems because they are highly soluble and yield precise binding data (which are difficult to obtain with neutral drugs). Moreover, they allow a systematic investigation of the role of hydrophilic and hydrophobic interactions in the absence of charge effects. The analysis of charged molecules is more complex, because charged compounds change the surface potential of the membrane. The lipid-water partition coefficients, Klw, of drugs were therefore calculated for two different surface potentials (Ψ = 0 mV and Ψ = −30 mV) according to Eq. 5, using published air-water partition coefficients, Kaw, cross-sectional areas, AD, and ionization constants, pKa (17). The transporter-lipid binding constants, Ktl, were for P-gp in inside-out plasma membrane vesicles of NIH-MDR1-G185 cells (9). For the comparison presented here, we selected typical modulators exhibiting relatively low pKa values (Table S3). The modulators can be divided into two groups: 1), modulators (generally called inhibitors) cyclosporin A, PSC833, and XR9576, with a ratio of q ≈ 1; and 2), modulators with an average ratio of q > 2–3, including phenothiazines, progesterone, and OC144-093. The phenothiazines and progesterone exhibit the ideal ratio and show bell-shaped curves, whereas OC144-093 no longer activates because it is very hydrophobic. As for detergents, the best modulators thus exhibit either a relatively low or a relatively high ratio. For detergents, small changes in the free energy of lipid-water partitioning, , and the free energy of transporter-lipid binding, , e.g., upon replacing oxygen by sulfur in, e.g., Cm-TGluc, was sufficient to tip the balance from activation toward inhibition (or down-modulation) of ATP hydrolysis. The same phenomenon was observed upon replacing a tertiary amide with a tertiary thioamide group in rhodamine/rosamine analogs (37).
Conclusion
Membrane disordering as the cause of P-gp-ATPase down-modulation can be excluded. Detergents and drugs are both handled as allocrits in a very similar manner. For efficient flopping, the P-gp-ATPase requires an optimal ratio of the allocrit's affinity to the membrane and to the transporter. Outside this range, flopping is decelerated. This further supports that step 3 in the activity cycle (flopping and release) is rate-limiting and implies that the rate of flopping directly correlates with the rate of ATP hydrolysis by P-gp. The allocrit does not engage in the flopping process if the affinity to the lipid membrane relative to the affinity to the transporter is too high. The latter two factors impart a certain selectivity to transport by P-gp.
Acknowledgments
This work was supported by the Swiss National Science Foundation (Grant No. 31003A-129701).
Supporting Material
References
- 1.Higgins C.F., Gottesman M.M. Is the multidrug transporter a flippase? Trends Biochem. Sci. 1992;17:18–21. doi: 10.1016/0968-0004(92)90419-a. [DOI] [PubMed] [Google Scholar]
- 2.Zolnerciks J.K., Andress E.J., Linton K.J. Structure of ABC transporters. Essays Biochem. 2011;50:43–61. doi: 10.1042/bse0500043. [DOI] [PubMed] [Google Scholar]
- 3.Ambudkar S.V., Cardarelli C.O., Stein W.D. Relation between the turnover number for vinblastine transport and for vinblastine-stimulated ATP hydrolysis by human P-glycoprotein. J. Biol. Chem. 1997;272:21160–21166. doi: 10.1074/jbc.272.34.21160. [DOI] [PubMed] [Google Scholar]
- 4.Omote H., Al-Shawi M.K. A novel electron paramagnetic resonance approach to determine the mechanism of drug transport by P-glycoprotein. J. Biol. Chem. 2002;277:45688–45694. doi: 10.1074/jbc.M206479200. [DOI] [PubMed] [Google Scholar]
- 5.Al-Shawi M.K., Omote H. The remarkable transport mechanism of P-glycoprotein: a multidrug transporter. J. Bioenerg. Biomembr. 2005;37:489–496. doi: 10.1007/s10863-005-9497-5. [DOI] [PMC free article] [PubMed] [Google Scholar]
- 6.Seelig A. The role of size and charge for blood-brain barrier permeation of drugs and fatty acids. J. Mol. Neurosci. 2007;33:32–41. doi: 10.1007/s12031-007-0055-y. [DOI] [PubMed] [Google Scholar]
- 7.Nervi P., Li-Blatter X., Seelig A. P-glycoprotein substrate transport assessed by comparing cellular and vesicular ATPase activity. Biochim. Biophys. Acta. 2010;1798:515–525. doi: 10.1016/j.bbamem.2009.11.022. [DOI] [PubMed] [Google Scholar]
- 8.Seelig A. Toward understanding P-glycoprotein structure-activity relationships. In: van de Waterbeemd H., Testa B., editors. Drug Bioavailability. Estimation of Solubility, Permeability, Absorption and Bioavailability. 2nd ed. Wiley; Weinheim, Germany: 2009. pp. 497–520. [Google Scholar]
- 9.Aanismaa P., Seelig A. P-Glycoprotein kinetics measured in plasma membrane vesicles and living cells. Biochemistry. 2007;46:3394–3404. doi: 10.1021/bi0619526. [DOI] [PubMed] [Google Scholar]
- 10.Li-Blatter X., Nervi P., Seelig A. Detergents as intrinsic P-glycoprotein substrates and inhibitors. Biochim. Biophys. Acta. 2009;1788:2335–2344. doi: 10.1016/j.bbamem.2009.07.010. [DOI] [PubMed] [Google Scholar]
- 11.Li-Blatter X., Seelig A. Exploring the P-glycoprotein binding cavity with polyoxyethylene alkyl ethers. Biophys. J. 2010;99:3589–3598. doi: 10.1016/j.bpj.2010.10.033. [DOI] [PMC free article] [PubMed] [Google Scholar]
- 12.Doige C.A., Yu X., Sharom F.J. The effects of lipids and detergents on ATPase-active P-glycoprotein. Biochim. Biophys. Acta. 1993;1146:65–72. doi: 10.1016/0005-2736(93)90339-2. [DOI] [PubMed] [Google Scholar]
- 13.Callaghan R., Berridge G., Higgins C.F. The functional purification of P-glycoprotein is dependent on maintenance of a lipid-protein interface. Biochim. Biophys. Acta. 1997;1328:109–124. doi: 10.1016/s0005-2736(97)00079-5. [DOI] [PubMed] [Google Scholar]
- 14.Orlowski S., Selosse M.A., Garrigos M. Effects of detergents on P-glycoprotein atpase activity: differences in perturbations of basal and verapamil-dependent activities. Cancer Biochem. Biophys. 1998;16:85–110. [PubMed] [Google Scholar]
- 15.Ambudkar S.V., Dey S., Gottesman M.M. Biochemical, cellular, and pharmacological aspects of the multidrug transporter. Annu. Rev. Pharmacol. Toxicol. 1999;39:361–398. doi: 10.1146/annurev.pharmtox.39.1.361. [DOI] [PubMed] [Google Scholar]
- 16.Seelig A., Gerebtzoff G. Enhancement of drug absorption by noncharged detergents through membrane and P-glycoprotein binding. Expert Opin. Drug Metab. Toxicol. 2006;2:733–752. doi: 10.1517/17425255.2.5.733. [DOI] [PubMed] [Google Scholar]
- 17.Gatlik-Landwojtowicz E., Aanismaa P., Seelig A. Quantification and characterization of P-glycoprotein-substrate interactions. Biochemistry. 2006;45:3020–3032. doi: 10.1021/bi051380+. [DOI] [PubMed] [Google Scholar]
- 18.Seelig J., Seelig A. Lipid conformation in model membranes and biological membranes. Q. Rev. Biophys. 1980;13:19–61. doi: 10.1017/s0033583500000305. [DOI] [PubMed] [Google Scholar]
- 19.Akhtar N., Ahad A., Talegaonkar S. The emerging role of P-glycoprotein inhibitors in drug delivery: a patent review. Expert Opin Ther Pat. 2011;21:561–576. doi: 10.1517/13543776.2011.561784. [DOI] [PubMed] [Google Scholar]
- 20.Litman T., Zeuthen T., Stein W.D. Structure-activity relationships of P-glycoprotein interacting drugs: kinetic characterization of their effects on ATPase activity. Biochim. Biophys. Acta. 1997;1361:159–168. doi: 10.1016/s0925-4439(97)00026-4. [DOI] [PubMed] [Google Scholar]
- 21.Fromherz P. Instrumentation for handling monomolecular films at an air-water interface. Rev. Sci. Instrum. 1975;46:1380–1385. [Google Scholar]
- 22.Fischer H., Gottschlich R., Seelig A. Blood-brain barrier permeation: molecular parameters governing passive diffusion. J. Membr. Biol. 1998;165:201–211. doi: 10.1007/s002329900434. [DOI] [PubMed] [Google Scholar]
- 23.Gerebtzoff G., Li-Blatter X., Seelig A. Halogenation of drugs enhances membrane binding and permeation. ChemBioChem. 2004;5:676–684. doi: 10.1002/cbic.200400017. [DOI] [PubMed] [Google Scholar]
- 24.Beck A., Li-Blatter X., Seelig J. On the interaction of ionic detergents with lipid membranes. Thermodynamic comparison of n-alkyl-+N(CH) and n-alkyl-SO. J. Phys. Chem. B. 2010;114:15862–15871. doi: 10.1021/jp107088d. [DOI] [PubMed] [Google Scholar]
- 25.Heerklotz H., Seelig J. Correlation of membrane/water partition coefficients of detergents with the critical micelle concentration. Biophys. J. 2000;78:2435–2440. doi: 10.1016/S0006-3495(00)76787-7. [DOI] [PMC free article] [PubMed] [Google Scholar]
- 26.Seelig A., Landwojtowicz E., Li Blatter X. Drug Bioavailability. Estimation of Solubility, Permeability and Absorption. Wiley/VCH; Weinheim, Germany: 2003. Towards P-glycoprotein structure-activity relationships; pp. 461–492. [Google Scholar]
- 27.Seelig A., Landwojtowicz E. Structure-activity relationship of P-glycoprotein substrates and modifiers. Eur. J. Pharm. Sci. 2000;12:31–40. doi: 10.1016/s0928-0987(00)00177-9. [DOI] [PubMed] [Google Scholar]
- 28.Seelig A. Local anesthetics and pressure: a comparison of dibucaine binding to lipid monolayers and bilayers. Biochim. Biophys. Acta. 1987;899:196–204. doi: 10.1016/0005-2736(87)90400-7. [DOI] [PubMed] [Google Scholar]
- 29.Boguslavsky V., Rebecchi M., McLaughlin S. Effect of monolayer surface pressure on the activities of phosphoinositide-specific phospholipase C-β1, -γ1, and -δ1. Biochemistry. 1994;33:3032–3037. doi: 10.1021/bi00176a036. [DOI] [PubMed] [Google Scholar]
- 30.Meier M., Seelig J. Lipid and peptide dynamics in membranes upon insertion of n-alkyl-β-D-glucopyranosides. Biophys. J. 2010;98:1529–1538. doi: 10.1016/j.bpj.2009.12.4286. [DOI] [PMC free article] [PubMed] [Google Scholar]
- 31.Seelig J., Ganz P. Nonclassical hydrophobic effect in membrane binding equilibria. Biochemistry. 1991;30:9354–9359. doi: 10.1021/bi00102a031. [DOI] [PubMed] [Google Scholar]
- 32.Beschiaschvili G., Seelig J. Peptide binding to lipid bilayers. Nonclassical hydrophobic effect and membrane-induced pK shifts. Biochemistry. 1992;31:10044–10053. doi: 10.1021/bi00156a026. [DOI] [PubMed] [Google Scholar]
- 33.Wenk M.R., Alt T., Seelig J. Octyl-β-D-glucopyranoside partitioning into lipid bilayers: thermodynamics of binding and structural changes of the bilayer. Biophys. J. 1997;72:1719–1731. doi: 10.1016/S0006-3495(97)78818-0. [DOI] [PMC free article] [PubMed] [Google Scholar]
- 34.Meier M., Blatter X.L., Seelig J. Interaction of verapamil with lipid membranes and P-glycoprotein: connecting thermodynamics and membrane structure with functional activity. Biophys. J. 2006;91:2943–2955. doi: 10.1529/biophysj.106.089581. [DOI] [PMC free article] [PubMed] [Google Scholar]
- 35.Aanismaa P., Gatlik-Landwojtowicz E., Seelig A. P-glycoprotein senses its substrates and the lateral membrane packing density: consequences for the catalytic cycle. Biochemistry. 2008;47:10197–10207. doi: 10.1021/bi800209h. [DOI] [PubMed] [Google Scholar]
- 36.Sauna Z.E., Andrus M.B., Ambudkar S.V. Biochemical basis of polyvalency as a strategy for enhancing the efficacy of P-glycoprotein (ABCB1) modulators: stipiamide homodimers separated with defined-length spacers reverse drug efflux with greater efficacy. Biochemistry. 2004;43:2262–2271. doi: 10.1021/bi035965k. [DOI] [PubMed] [Google Scholar]
- 37.Gannon M.K., 2nd, Holt J.J. Rhodamine inhibitors of P-glycoprotein: an amide/thioamide “switch” for ATPase activity. J. Med. Chem. 2009;52:3328–3341. doi: 10.1021/jm900253g. [DOI] [PMC free article] [PubMed] [Google Scholar]
- 38.Heerklotz H. Interactions of surfactants with lipid membranes. Q. Rev. Biophys. 2008;41:205–264. doi: 10.1017/S0033583508004721. [DOI] [PubMed] [Google Scholar]
- 39.Wenk M.R., Seelig J. Interaction of octyl-β-thioglucopyranoside with lipid membranes. Biophys. J. 1997;73:2565–2574. doi: 10.1016/S0006-3495(97)78285-7. [DOI] [PMC free article] [PubMed] [Google Scholar]
Associated Data
This section collects any data citations, data availability statements, or supplementary materials included in this article.