Abstract
Objective
To examine the role of MAGEA2 in the tumorigenesis of head and neck squamous cell carcinoma (HNSCC).
Design
Primary tissue microarray data and quantitative reverse transcription–polymerase chain reaction (RT-PCR) showed that MAGEA2 is differentially over-expressed in HNSCC. Functional analyses were then performed using MAGEA2 transfections and small-interfering RNA knockdowns with subsequent anchorage-dependent growth studies and cell cycle analyses. Quantitative RT-PCR was used to evaluate expression changes in p53 downstream targets after transfection of MAGEA2 into normal upper aerodigestive cell lines.
Results
MAGEA2 is differentially overexpressed in HNSCC. In addition, MAGEA2 promotes growth in normal oral keratinocytes, whereas knockdown of MAGEA2 in HNSCC cells decreases growth. Using the HCT116 p53 wt and null cell line system, transfection of MAGEA2 induced growth in the p53 wt cell line while providing no growth advantage in the p53 mutant cells. Subsequently, transfection of MAGEA2 induced a decrease in messenger RNA expression of the p53 downstream targets CDKN1A and BAX and decreased G1 arrest in cells allowed to remain confluent for longer than 48 hours.
Conclusions
These data suggest that MAGEA2 is differentially expressed in HNSCC and functions, in part, through the p53 pathway by increasing cellular proliferation and abrogating cell cycle arrest. This improved understanding of MAGEA2 function and expression patterns will potentially allow for the improved ability to use MAGEA2 for detection, surveillance, and targeted therapeutics.
In 2008, MORE THAN 47 500 NEW cases of cancer affecting the oral cavity, pharynx, and larynx were diagnosed in the United States, resulting in more than 11 000 deaths. More than 90% of these cancers were squamous cell in origin, and, worldwide, more than 500 000 people have head and neck squamous cell carcinoma (HNSCC).1,2 Despite recent advances in the surgical and radiotherapeutic management of these patients, 5-year survival rates for HNSCC have only moderately improved secondary to most tumors being diagnosed at late clinical stages and these tumors having a relatively high rate of locoregional recurrence. The discovery of differentially expressed molecular targets followed by research aimed at improving our understanding of their function and expression patterns is a promising approach to increase our ability to detect cancer at an early or premalignant stage and to aid in the development of targeted therapeutics and advanced surveillance methods.
Epigenetic changes, including alterations in promoter methylation, have been associated with cancer-specific expression differences in human malignancies, including HNSCC. 3–7 We recently developed an integrative epigenetic screening method, combining primary tissue messenger RNA expression array data with that from pharmacologically demethylated immortalized normal oral keratinocytes. This research represents the first comprehensive approach to identify proto-oncogenes activated by promoter demethylation in HNSCC. One of the putative derepressed oncogenes discovered via this screening method was MAGEA2.7
The MAGEA family of genes is a member of the cancer-testis antigens gene family. These genes were first discovered as immunogenic targets normally expressed in germline cells but differentially expressed in a variety of human cancers. Although this family of genes has been shown to be overexpressed in melanoma and other cancers, to date, efforts have primarily focused on developing tumor vaccines based on these targets, leaving their function mostly a mystery.8–11
In addition to a recent study7 showing that MAGEA2 expression in HNSCC is regulated by promoter demethylation, there has been recent compelling evidence that MAGEA2 silences the downstream targets of p53 activation via the MAGEA2-p53 complex in melanoma.12 Genetic alterations in the powerful tumor suppressor TP53 are found in approximately 50% of HNSCC. Although TP53 has a long and established role in the pathogenesis of head and neck cancer, many primary HNSCC tumors have been shown to lack mutations in the TP53 tumor suppressor gene, and it is recognized that other mechanisms of functional inactivation must exist.13,14 In this study, we examine the role of MAGEA2 in the tumorigenesis of HNSCC. We confirm that MAGEA2 is differentially overexpressed in HNSCC; in addition, we show that MAGEA2 is growth promoting, in part, through its interaction with the p53 pathway by increasing cellular proliferation and decreasing cell cycle arrest.
METHODS
HISTOPATHOLOGIC ANALYSIS
All the samples were analyzed at the Department of Pathology, The Johns Hopkins Hospital. Tissue samples were obtained via Johns Hopkins institutional review board–approved protocols. Tumor and normal tissues from surgical specimens were frozen in liquid nitrogen immediately after resection and stored at −80°C until use. Normal samples were microdissected, and RNA was prepared from the mucosa. Tumor samples were confirmed to be HNSCC and subsequently were microdissected to separate tumor from stromal elements to yield at least 80% tumor cells; tissue RNA was then extracted as described in the following subsection.
ISOLATION OF RNA AND QUANTITATIVE REVERSE TRANSCRIPTION–POLYMERASE CHAIN REACTION
Total cellular RNA was isolated using TRIzol (Life Technologies, Gaithersburg, Maryland) and the RNeasy Kit (Qiagen, Valencia, California) according to the manufacturer’s instructions for primary tissue and cell line samples. After measuring the concentration of the RNA extracted from each sample, 1 µg RNA was then used for complementary DNA synthesis performed using oligo-dt and the SuperScript First-Strand Synthesis Kit (Invitrogen, Carlsbad, California). The final complementary DNA products were used as templates for subsequent quantitative reverse transcription–polymerase chain reaction (qRT-PCR), with primers designed specifically for each gene of interest (MAGEA2 [NM_005361], CDKN1A [NM_000389], and BAX [NM_017059]). All the primers were designed to span exon-exon junctions to avoid cross-reactivity to DNA. 18s ribosomal RNA was used as the internal control gene, and all values were normalized to 18s ribosomal RNA expression. Each experiment was performed in triplicate using the TAqMan 7900 (Applied Biosystems, Foster City, California) real-time PCR machine and the QuantiFast SYBR Green PCR Kit (Qiagen) according to the manufacturer’s instructions. Detailed PCR conditions and primer sequences are available on request.
PUBLIC DATA SETS
The public databases used in this study were the University of California, Santa Cruz Human Genome reference sequence and the annotation database from the March 2006 freeze (hg18). Fortynine HNSCC tumor and 19 normal upper aerodigestive tissue expression microarrays were obtained from public data sets using Oncomine (Compendia Bioscience, Ann Arbor, Michigan). All the expression arrays used for this analysis had been performed using the Affymetrix Human Genome U133A Array expression platform (Affymetrix, Inc, Santa Clara, California).
CANCER OUTLIER PROFILE ANALYSIS
We applied Cancer Outlier Profile Analysis (COPA) to the present cohort of 68 tissue samples (49 tumors and 19 control subjects). Briefly, gene expression values were median centered, setting each gene’s median expression value to zero. The median absolute deviation was calculated and scaled to 1 by dividing each gene expression value by its median absolute deviation. Of note, median and median absolute deviation were used for transformation as opposed to mean and standard deviation so that outlier expression values do not unduly affect the distribution estimates and are, thus, preserved after normalization. Finally, the 75th, 90th, and 95th percentiles of the transformed expression values were calculated for MAGEA2. For details of the method, refer to the article by Tomlins et al.15
TRANSFECTION OF HUMAN EXPRESSION VECTORS AND ANCHORAGE-DEPENDENT GROWTH ASSAY
A full-length open reading frame complementary DNA of MAGEA2 was obtained for transient transfections from Invitrogen in a pCMV-Sport6 vector. Cell lines were plated at 5 × 10⁵ cells per well using 6-well plates and were transfected with either empty vector or vector containing the gene of interest using the FuGene 6 Transfection Reagent (Roche, Basel, Switzerland) according to the manufacturer’s protocol. Cell Counting Kit-8 (Dojindo Molecular Technologies, Inc, Rockville, Maryland) absorbance was measured using the Spectramax M2e 96-well fluorescence plate reader (Molecular Devices, Sunnyvale, California). Cell Counting Kit-8 is a sensitive colorimetric assay for cell proliferation that uses a tetrazolium salt, WST-8, which produces a water-soluble formazan dye on bioreduction by cellular dehydrogenases. All anchorage-dependent (AD) growth experiments were performed in quadruplicate for all cell lines and vectors.
SMALL-INTERFERING RNA TRANSFECTIONS
Small-interfering RNAs (siRNAs) for MAGEA2 knockdown were purchased from Dharmacon (Chicago, Illinois), as were nonsilencing control scramble siRNAs. Transfection was accomplished using the Lipofectamine 2000 transfection reagent per the manufacturer’s protocol (Invitrogen). Briefly, siRNA constructs were transiently transfected into JHU-O11 cells at a final concentration of 5 pmol. Scramble siRNAs were transfected in the same manner at the same concentration. All transfection experiments were performed in triplicate.
CELL CYCLE ANALYSIS
For cell cycle analysis, cells were plated in 100-mm dishes. For contact inhibition, transfected cells were allowed to reach confluence and to remain confluent for at least 48 hours as previously described.16 At 48 hours, cells were trypsinized, centrifuged, and fixed with methanol. Cells were then resuspended in 0.1mg/mLof propidium iodide. DNA content was measured using flow cytometry analysis performed using a FACS can flow cytometer (BD, Franklin Lakes, New Jersey) by analyzing 10 000 events. All gating for the controls and samples was identical.
RESULTS
MAGEA2 IS DIFFERENTIALLY OVEREXPRESSED IN HNSCC PRIMARY TISSUE
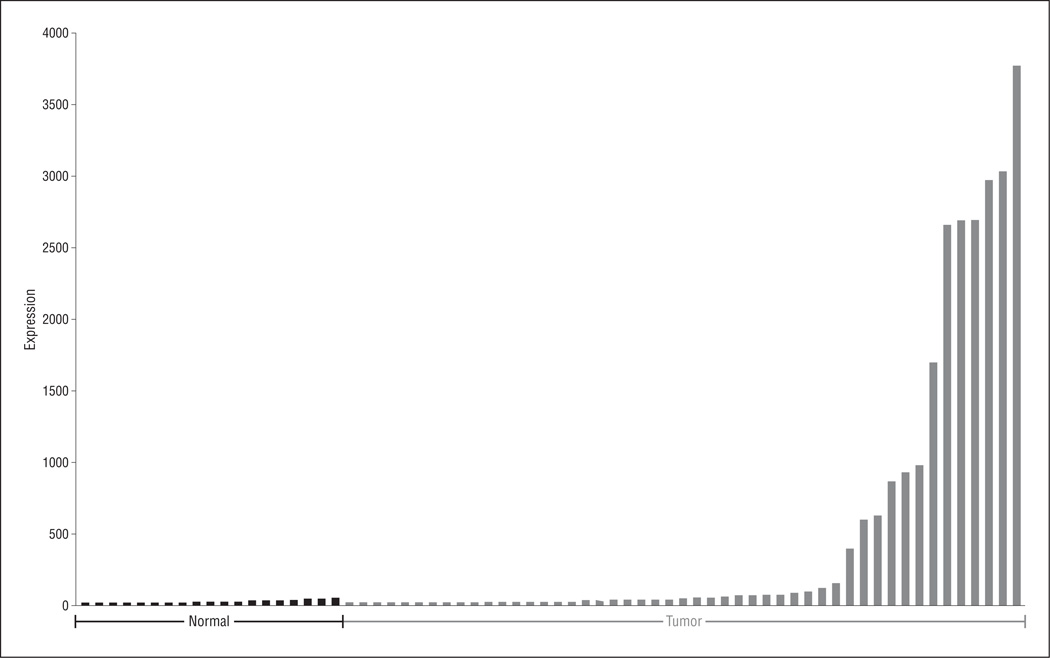
A previous work7 demonstrated that MAGEA2 can be de-repressed by pharmacologic demethylation of normal oral keratinocyte cells. In this study, we initially examined the expression of MAGEA2 in primary HNSCC compared with noncancer normal upper aerodigestive mucosal control tissue. We first obtained HNSCC tumor and normal tissue messenger RNA expression arrays from the Oncomine database that had been performed on the Affymetrix Human Genome U133A Array expression platform. We used the score generated by COPA at the 90th percentile of tumor vs normal expression after specific normalization to rank candidate oncogenes in these 49 HNSCC tumors and 19 normal upper aerodigestive tissues. 15 Figure 1 shows the COPA expression results for MAGEA2. There was a significant difference using the Mann-Whitney test (P<.001), with 15 of 49 tumors (31%) showing significant upregulation of MAGEA2.
Figure 1.
Microarray expression of MAGEA2. Forty-nine head and neck squamous cell carcinoma tumors and 19 normal tissues were used for this analysis. These arrays were obtained from the Oncomine database and had been performed using the Affymetrix Human Genome U133A Array expression platform. Tumors display significant overexpression of MAGEA2 based on a Mann-Whitney test (P<.001).
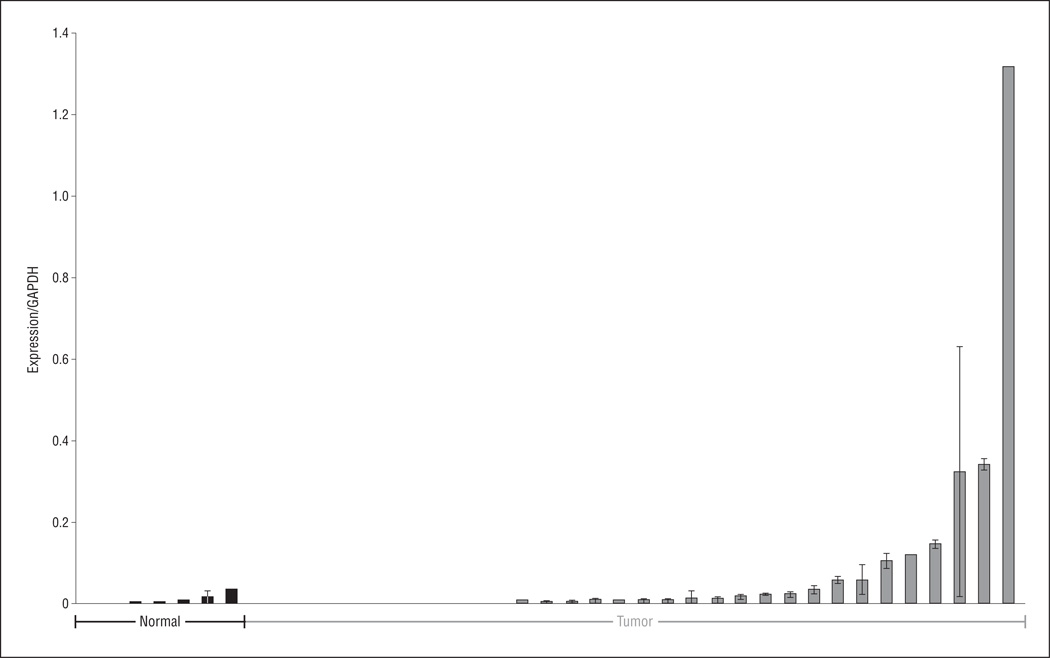
To confirm these microarray results, we performed qRT-PCR on a separate cohort of HNSCC and normal, non-cancer upper aerodigestive mucosal samples. We found significant overexpression of MAGEA2 in 32 tumors compared with 7 normal tissues (P = .03) (Figure 2).
Figure 2.
Mean messenger RNA expression as measured by means of reverse transcription–polymerase chain reaction in primary tissue from 32 patients with head and neck squamous cell carcinoma compared with 7 normal upper aerodigestive mucosa samples from patients without cancer. Differences in tumor vs normal expression levels were significant as measured using a 2-tailed t test assuming unequal variance (P=.03). GAPDH indicates glyceraldehyde-3-phosphate dehydrogenase. Error bars represent SD.
In addition, we examined whether MAGEA2 overexpression was more common in the HNSCC tumors that had wild-type p53. To this end, we conducted a subset analysis of 21 of the 32 tumors for which the p53 status was known. Of the 15 tumors with mutant p53, the mean (SD) relative MAGEA2 messenger RNA expression level by means of qRT-PCR was 0.006174434 (0.0094).Of the 6 tumors with wild-type p53, the mean (SD) relative MAGEA2 messenger RNA expression level was 0.034628791 (0.0394). Although there is a difference, with MAGEA2 expression being higher in tumors expressing wild-type p53, P = .14 using a 2-tailed t test assuming unequal variance, this difference did not reach significance.
MAGEA2 PROVIDES A SELECTIVE GROWTH ADVANTAGE IN HNSCC AND NORMAL ORAL KERATINOCYTE CELL LINES
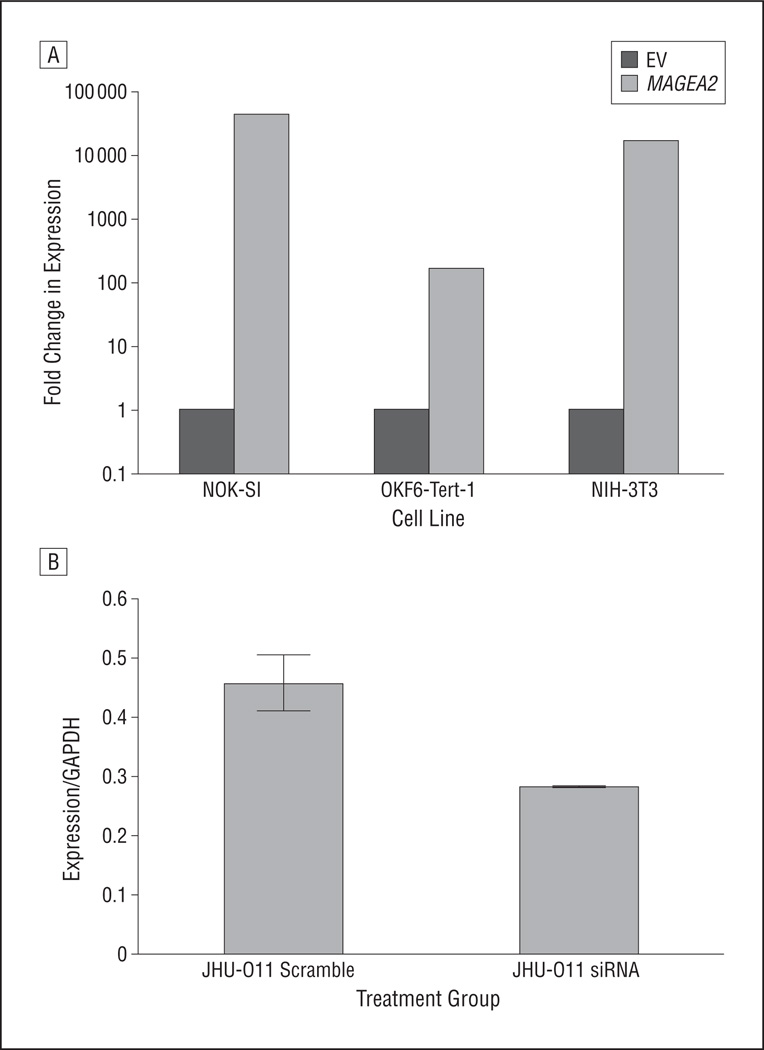
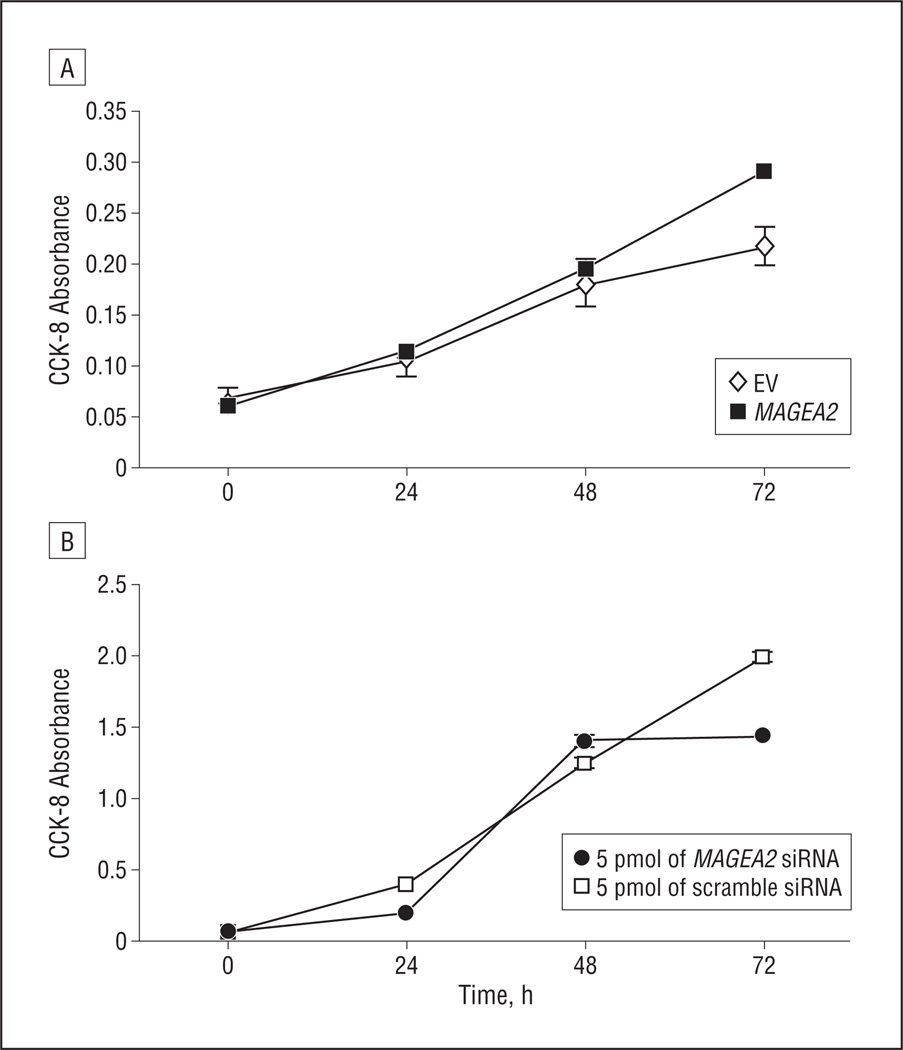
Given the finding that MAGEA2 is differentially overexpressed in HNSCC, we next turned our attention toward elucidating its function in these tumors. Transient transfection of an MAGEA2 construct into a spontaneously immortalized oral keratinocyte cell line, NOK-SI,17 showed a mean (SD) 34% (3%) increase in AD growth at 72 hours (Figure 3A and Figure 4A).We then used siRNA to knock down MAGEA2 expression in an HNSCC cell line, JHU-O11, shown to be a high expresser of MAGEA2. Seventy-two hours after the introduction of MAGEA2 siRNA, there was a mean (SD) 28% (3%) decrease in AD growth compared with the cells treated with nonspecific scramble control siRNA (Figure 3B and Figure 4B). Transient transfection of MAGEA2 was unable to transform either NIH-3T3 or OKF6-Tert-1 cell lines to grow anchorage independently in soft agar (data not shown).
Figure 3.
Messenger RNA (mRNA) expression of MAGEA2 72 hours after transient transfection or knockdown of MAGEA2 as measured using quantitative reverse transcription–polymerase chain reaction. A, Relative increase in MAGEA2 mRNA in the NOK-SI, OKF6-Tert-1, and NIH-3T3 cell lines 72 hours after transient transfection (calculated using the delta-delta cycle threshold method). B, A 40% relative decrease in MAGEA2 mRNA 72 hours after small-interfering RNA (siRNA)–mediated MAGEA2 knockdown in the head and neck squamous cell carcinoma cell line JHU-O11. EV indicates empty vector; GAPDH, glyceraldehyde-3-phosphate dehydrogenase. Error bars represent SD.
Figure 4.
MAGEA2 is growth promoting in head and neck squamous cell carcinoma (HNSCC) and normal oral keratinocyte cell lines. A, Transient transfection of MAGEA2 construct into a spontaneously immortalized oral keratinocyte cell line (NOK-SI) (at 72 hours, there was a mean [SD] 34% [3%] increase in anchorage-dependent [AD] growth). B, Small-interfering RNA (siRNA)–mediated MAGEA2 knockdown in the HNSCC cell line JHU-O11 (at 72 hours, there was a mean [SD] 28% [3%] decrease in AD growth). Error bars represent SEM. Error bars for some data points are too small to be seen around the data point marker. CCK-8 indicates Cell Counting Kit-8; EV, empty vector.
MAGEA2 DOWNREGULATES p53 TARGETS IN NORMAL HUMAN ORAL KERATINOCYTE AND MOUSE FIBROBLAST CELL LINES
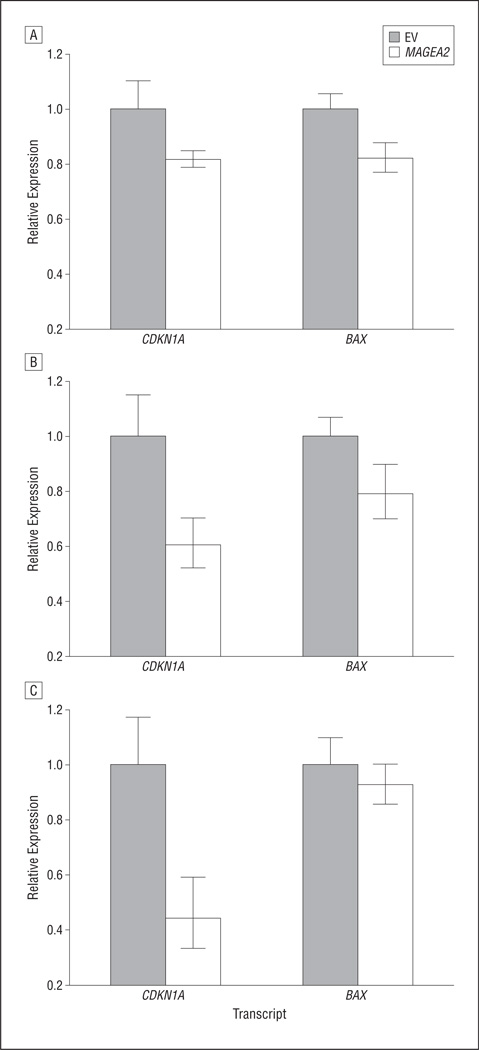
Given the recent evidence that MAGEA2 interacts with p53 in melanoma cells, we wanted to examine whether MAGEA2 causes expression differences in downstream targets of p53 in normal oral keratinocytes and mouse fibroblasts.12 We used qRT-PCR to determine whether transient transfection of MAGEA2 alters the expression levels of 2 main downstream targets of the p53 tumor suppressor gene, BAX and CDKN1A. Both CDKN1A and BAX were significantly down-regulated in normal human oral keratinocyte cells, OKF6-Tert-1 (P = .03) (Figure 5A).18 In another normal oral keratinocyte cell line, NOK-SI, CDKN1A (P = .01) and BAX (P = .04) were significantly downregulated after MAGEA2 transfection, although CDKN1A was downregulated to a higher degree (Figure 5B). In NIH-3T3 cells, CDKN1A was significantly downregulated (P = .01), whereas BAX was downregulated but is not significant (Figure 5C).
Figure 5.
Messenger RNA expression of p53 downstream targets after transient transfection with MAGEA2 by means of quantitative reverse transcription–polymerase chain reaction. A, Both CDKN1A and BAX were significantly downregulated in OKF6-Tert-1 cells (P<.05). B, CDKN1A (P=.03) and BAX (P=.02) were significantly downregulated in NOK-SI cells. C, CDKN1A was significantly downregulated in NIH-3T3 cells (P<.02, 2-tailed t test assuming unequal variance. Error bars represent SD; EV, empty vector.
MAGEA2 SELECTIVELY INCREASES GROWTH IN THE p53 WT HCT116 CELL LINE
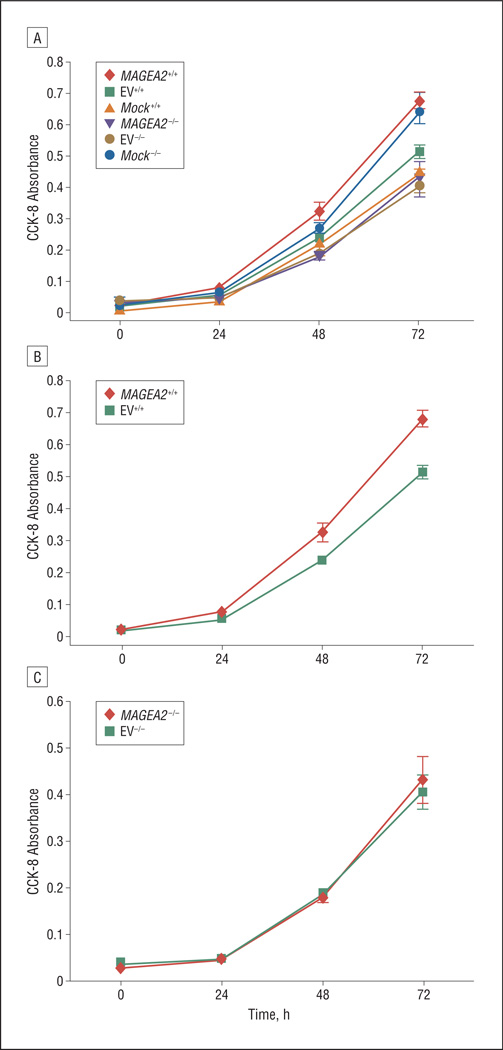
To further understand whether MAGEA2 exerts its growth effects via the p53 pathway, we transiently transfected a MAGEA2 construct into the well-studied colon carcinoma HCT116 p53 wt (+/+) and p53 null (−/−) cell line system.19 Figure 6A shows a baseline increase in AD growth in the p53 null cell line over the wild-type cell line, which was overcome by transient transfection of MAGEA2 into the wt p53 cell line. Seventy-two hours after transfection of MAGEA2 into the p53 wt HCT116+/+ cells, we observed a mean (SD) 30% (10%) increase in AD growth (Figure 6B). However, no growth advantage was seen with the transfection of MAGEA2 into the HCT116 p53 null (−/−) cells (Figure 6C).
Figure 6.
Transient transfection of MAGEA2 into HCT116 p53 wt (+/+) and null (−/−) cells. A, There is a baseline increase in anchorage-dependent (AD) growth in the p53 null cell line over the wild-type cell line (compare Mock+/+ with Mock−/−), which was overcome by transient transfection of MAGEA2 into the wt p53 cell line (compare MAGEA2+/+ with Mock−/−). B, MAGEA2 significantly increases growth in the p53 wt HCT116 (+/+) cells (at 72 hours, there was a mean [SD] 30% [10%] increase in AD growth). C, MAGEA2 does not increase AD growth in p53 null HCT116−/− cells. Error bars represent SEM. CCK-8 indicates Cell Counting Kit-8; EV, empty vector.
MAGEA2 PREVENTS G1 ARREST IN NORMAL ORAL KERATINOCYTES
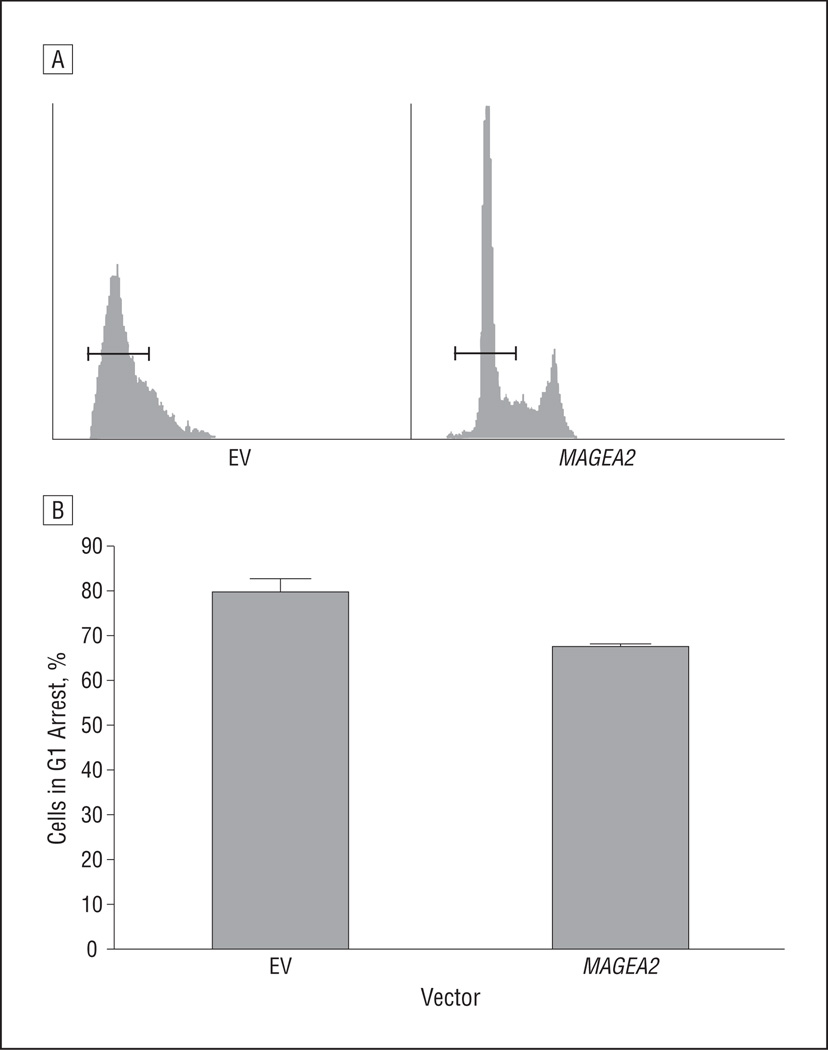
We next examined whether MAGEA2, through its effect on p53, exerts its growth effects in normal oral keratinocytes by decreasing cell cycle arrest or by downregulating the apoptotic pathway. After transient transfection with an MAGEA2 construct, we arrested NOK-SI cells in culture by allowing the cells to remain confluent for more than 48 hours. The cells were then stained with propidium iodide, and cell cycle analysis was conducted using flow cytometry to analyze cellular DNA content.
The analysis showed that NOK-SI cells transfected with MAGEA2 had a significantly smaller percentage of cells arrested in G1 (67%), compared with cells transfected with the empty vector (80%) in G1 arrest (P = .047) (Figure 7). After release from confluent conditions, by 9 hours, NOK-SI cells transfected with the empty vector or MAGEA2 had returned to a similar distribution of cells in G1, S, and G2 (data not shown). In addition, apoptosis assays conducted with and without MAGEA2 transfection in OKF6-Tert-1 and NIH-3T3 cells after treatment with a DNA-damaging agent, camptothecin, revealed no difference in cells undergoing apoptosis.
Figure 7.
MAGEA2 prevents G1 arrest in normal oral keratinocytes. A, NOK-SI cells after MAGEA2 transfection were allowed to reach confluence and were cultured for 48 hours. Cells were then stained with propidium iodide and assayed for DNA content by means of fluorescence-activated cell sorting. The horizontal bars represent cutoff points for cells in G1. All gating and cutoff points for the controls and samples were identical. B, Graphical representation of the percentage of cells in G1 arrest after being cultured in a confluent state for 48 hours after transfection with either MAGEA2 (67%) or empty vector EV (80%). Error bars represent SEM. P=.047. EV indicates empty vector.
COMMENT
The search for tumor-specific antigens has been active for many decades, with the discovery of the first MAGEA family member occurring almost 20 years ago. Yet, the function of the MAGEA family of genes has remained unclear.10,20,21 Although this family of genes has been shown to be overexpressed in a variety of human tumors affecting the skin, breasts, gastrointestinal tract, lungs, liver, and head and neck, efforts have mainly focused on developing tumor vaccines based on these targets.22–28 Only in recent years have members of the MAGEA family been implicated in various tumorigenic pathways. For example, MAGEA1 has been implicated as a transcriptional repressor through its interaction with SKI-interacting protein and recruitment of histone deacetylase in the NOTCH1 pathway.29 In addition, MAGEA11 has been shown to inhibit the hypoxia-inducible factor prolyl hydroxylase 2 and to activate the hypoxic response in various cancer cell lines. MAGEA11 has also been shown to interact with and regulate androgen receptor function.30,31 So far, one study12 has elucidated the interaction between MAGEA2 and the p53 pathway in melanoma; however, to date, there has been no study, to our knowledge, looking specifically at the expression pattern and function of MAGEA2 in HNSCC.
In this study, we used the bioinformatics approach COPA to analyze primary tissue expression microarrays obtained from public data sets available on Oncomine to determine that MAGEA2 is differentially overexpressed in primary HNSCC vs normal upper aerodigestive tract mucosa. COPA is a method used to search for marked overexpression of particular genes that occur in a subset of patients. Traditional analytical methods based on standard statistical measures often do not find genes with this type of expression profile.15 COPA was useful to search for and analyze MAGEA2 expression in primary tissue because it is known that cancer-testis antigens are heterogeneously expressed across a wide patient population and in individual tumor specimens.32,33 We then confirmed this overexpression by means of qRT-PCR in a separate cohort of 32 primary tissues and 7 normal upper aerodigestive mucosal samples from patients without cancer and again found statistically significant overexpression of MAGEA2 in HNSCC. We also attempted to demonstrate that MAGEA2 is overexpressed more frequently in tumors that contain wild-type p53. Although the data showed a trend in this direction, the small sample size precluded significance.
Recently, Monte et al12 showed that the MAGEA2 protein induces a novel p53 inhibitory loop involving recruitment of histone deacetylase 3 (HDAC3) to a MAGEA2-p53 complex. This complex formation strongly downregulates the p53 transactivation function in melanoma without changing p53 expression levels.12 Given these findings and data suggesting that TP53 mutations in HNSCC are common but do not account for all of the dysfunction in the p53 pathway, we examined the effect of MAGEA2 on downstream targets and pathways of p53 involved in cell cycle progression and apoptosis.13,14,34,35
We initially showed that transient transfection of MAGEA2 into normal oral keratinocytes could increase cell proliferation and that knockdown of this gene using siRNA could decrease AD growth in HNSCC cells known to be high expressers of MAGEA2 (the JHU-O11 cell line). In addition, transfection of MAGEA2 into the well-studied HCT116 p53 wt (+/+) and p53 null (−/−) cell line system only increased AD growth in the p53 wt clone. Thus, MAGEA2 was able to elicit only a selective growth advantage in the cell line with intact p53. Based on these findings and the current understanding of the interaction between MAGEA2 and p53, we next examined the effect of MAGEA2 expression on the downstream targets of the p53 pathway.
Silencing of the tumor suppressor gene TP53 and its downstream targets has the ability to decrease the rate of apoptosis or increase the rate of cellular proliferation by deregulating cell cycle progression checkpoints.34,35 To examine which scenario was occurring in the present transfected cell lines, we first examined 2 targets of p53, CDKN1A and BAX. The former is responsible for cell cycle regulation at the G1 checkpoint, and the latter is responsible for p53-induced apoptosis.36–38 In all the cell lines tested, there was a significant decrease in CDKN1A and BAX expression after transient transfection with MAGEA2. In 2 of the 3 cell lines, NIH-3T3 and NOK-SI, there was a higher degree of CDKN1A silencing compared with the downregulation of BAX after MAGEA2 transfection (Figure 5).
To examine the functional significance of these findings, we performed apoptotic and cell cycle progression analyses to determine whether either were affected by MAGEA2 expression. We found no difference in apoptosis after DNA damage in any of the tested cell lines; however, in the normal oral keratinocyte cell line (NOK-SI) transfected with MAGEA2, there was a significant decrease in cell cycle arrest after 48 hours of culturing in confluent conditions compared with the empty vector controls. These findings support that MAGEA2 is growth promoting in models of HNSCC, at least in part, through its interaction with the cell cycle progression arm of the p53 pathway.
Epigenetic changes have been implicated in the pathogenesis of solid tumors, including HNSCC. A previous work7 implicated promoter hypomethylation as a major contributor to the derepression of MAGEA2 in HNSCC. In this study, we showed that MAGEA2 is overexpressed in a significant subset of HNSCCs. In addition, we showed that MAGEA2 overexpression results in increased cell cycle progression and increased growth, in part by inhibiting the activation of p53 downstream targets in normal oral keratinocytes and HNSCC cell lines.
The lack of expression of the MAGEA family of genes in adult tissue and their widespread expression across various human malignancies make them ideal targets for diagnostic approaches and therapeutic interventions. However, we must continue to strive to improve our understanding of the pathways involved in the tumorigenic effects of MAGEA2 and other cancer-testis antigen family members to allow us to better tailor these therapeutics and drug combinations to most effectively halt disease progression.
Acknowledgments
Funding/Support: This study was supported by a Clinical Innovator Award from the Flight Attendant Medical Research Institute (Dr Califano), the National Cancer In- stitute SPORE (5P50CA096784-05) and EDRN U01CA084986 (Dr Califano), and in part by a National Institutes of Health T32 Research Training Grant (Dr Glazer).
Footnotes
Author Contributions: Drs Glazer, Smith, Bhan, Sun, Chang, Pattani, Khan, and Califano had full access to all the data in the study and take responsibility for the integrity of the data and the accuracy of the data analysis. Study concept and design: Glazer, Smith, Bhan, and Califano. Acquisition of data: Glazer, Smith, Bhan, Sun, Pattani, Westra, and Khan. Analysis and interpretation of data: Glazer, Smith, Sun, Chang, and Califano. Drafting of the manuscript: Glazer, Chang, Khan, and Califano. Critical revision of the manuscript for important intellectual content: Glazer, Smith, Bhan, Sun, Pattani, Westra, and Califano. Obtained funding: Califano. Administrative, technical, and material support: Westra, Khan, and Califano. Study supervision: Chang and Califano.
Financial Disclosure: Dr Califano is the Director of Research of the Milton J. Dance Head and Neck Endowment. The terms of this arrangement are being managed by The Johns Hopkins University in accord with its conflict of interest policies.
Previous Presentation: This study was presented at the American Head and Neck Society 2010 Annual Meeting during the Combined Otolaryngology Spring Meetings; April 29, 2010; Las Vegas, Nevada.
Additional Contributions: Silvio Gutkind, PhD, generously donated the NOK-SI cell lines and Bert Vogelstein, MD, generously donated the HCT116 cell lines.
REFERENCES
- 1.Jemal A, Siegel R, Ward E, et al. Cancer statistics, 2008. CA Cancer J Clin. 2008;58(2):71–96. doi: 10.3322/CA.2007.0010. [DOI] [PubMed] [Google Scholar]
- 2.Glazer CA, Chang SS, Ha PK, Califano JA. Applying the molecular biology and epigenetics of head and neck cancer in everyday clinical practice. Oral Oncol. 2009;45(4–5):440–446. doi: 10.1016/j.oraloncology.2008.05.013. [DOI] [PubMed] [Google Scholar]
- 3.Carvalho AL, Jeronimo C, Kim MM, et al. Evaluation of promoter hypermethylation detection in body fluids as a screening/diagnosis tool for head and neck squamous cell carcinoma. Clin Cancer Res. 2008;14(1):97–107. doi: 10.1158/1078-0432.CCR-07-0722. [DOI] [PubMed] [Google Scholar]
- 4.Das PM, Singal R. DNA methylation and cancer. J Clin Oncol. 2004;22(22):4632–4642. doi: 10.1200/JCO.2004.07.151. [DOI] [PubMed] [Google Scholar]
- 5.Esteller M, Fraga MF, Paz MF, et al. Cancer epigenetics and methylation. Science. 2002;297(5588):1807–1808. doi: 10.1126/science.297.5588.1807d. [DOI] [PubMed] [Google Scholar]
- 6.Esteller M, Herman JG. Cancer as an epigenetic disease: DNA methylation and chromatin alterations in human tumours. J Pathol. 2002;196(1):1–7. doi: 10.1002/path.1024. [DOI] [PubMed] [Google Scholar]
- 7.Smith IM, Glazer CA, Mithani SK, et al. Coordinated activation of candidate protooncogenes and cancer testes antigens via promoter demethylation in head and neck cancer and lung cancer. PLoS One. 2009;4(3):e4961. doi: 10.1371/journal.pone.0004961. [DOI] [PMC free article] [PubMed] [Google Scholar]
- 8.De Smet C, De Backer O, Faraoni I, Lurquin C, Brasseur F, Boon T. The activation of human gene MAGE-1 in tumor cells is correlated with genome-wide demethylation. Proc Natl Acad Sci U S A. 1996;93(14):7149–7153. doi: 10.1073/pnas.93.14.7149. [DOI] [PMC free article] [PubMed] [Google Scholar]
- 9.De Smet C, Lurquin C, Lethé B, Martelange V, Boon T. DNA methylation is the primary silencing mechanism for a set of germ line- and tumor-specific genes with a CpG-rich promoter. Mol Cell Biol. 1999;19(11):7327–7335. doi: 10.1128/mcb.19.11.7327. [DOI] [PMC free article] [PubMed] [Google Scholar]
- 10.Simpson AJG, Caballero OL, Jungbluth A, Chen Y-T, Old LJ. Cancer/testis antigens, gametogenesis and cancer. Nat Rev Cancer. 2005;5(8):615–625. doi: 10.1038/nrc1669. [DOI] [PubMed] [Google Scholar]
- 11.Weber J, Salgaller M, Samid D, et al. Expression of the MAGE-1 tumor antigen is up-regulated by the demethylating agent 5-aza-2′-deoxycytidine. Cancer Res. 1994;54(7):1766–1771. [PubMed] [Google Scholar]
- 12.Monte M, Simonatto M, Peche LY, et al. MAGE-A tumor antigens target p53 transactivation function through histone deacetylase recruitment and confer resistance to chemotherapeutic agents. Proc Natl Acad Sci U S A. 2006;103(30):11160–11165. doi: 10.1073/pnas.0510834103. [DOI] [PMC free article] [PubMed] [Google Scholar]
- 13.Gasco M, Crook T. The p53 network in head and neck cancer. Oral Oncol. 2003;39(3):222–231. doi: 10.1016/s1368-8375(02)00163-x. [DOI] [PubMed] [Google Scholar]
- 14.Poeta ML, Manola J, Goldwasser MA, et al. TP53 mutations and survival in squamous-cell carcinoma of the head and neck. N Engl J Med. 2007;357(25):2552–2561. doi: 10.1056/NEJMoa073770. [DOI] [PMC free article] [PubMed] [Google Scholar]
- 15.Tomlins SA, Rhodes DR, Perner S, et al. Recurrent fusion of TMPRSS2 and ETS transcription factor genes in prostate cancer. Science. 2005;310(5748):644–648. doi: 10.1126/science.1117679. [DOI] [PubMed] [Google Scholar]
- 16.Chattopadhyay A, Chiang CW, Yang E. BAD/BCL-[X(L)] heterodimerization leads to bypass of G0/G1 arrest. Oncogene. 2001;20(33):4507–4518. doi: 10.1038/sj.onc.1204584. [DOI] [PubMed] [Google Scholar]
- 17.Basile JR, Castilho RM, Williams VP, Gutkind JS. Semaphorin 4D provides a link between axon guidance processes and tumor-induced angiogenesis. Proc Natl Acad Sci U S A. 2006;103(24):9017–9022. doi: 10.1073/pnas.0508825103. [DOI] [PMC free article] [PubMed] [Google Scholar]
- 18.Rheinwald JG, Hahn WC, Ramsey MR, et al. A two-stage, p16(INK4A)- and p53-dependent keratinocyte senescence mechanism that limits replicative potential independent of telomere status. Mol Cell Biol. 2002;22(14):5157–5172. doi: 10.1128/MCB.22.14.5157-5172.2002. [DOI] [PMC free article] [PubMed] [Google Scholar]
- 19.Bunz F, Dutriaux A, Lengauer C, et al. Requirement for p53 and p21 to sustain G2 arrest after DNA damage. Science. 1998;282(5393):1497–1501. doi: 10.1126/science.282.5393.1497. [DOI] [PubMed] [Google Scholar]
- 20.Old LJ. Cancer immunology: the search for specificity—GHA Clowes Memorial Lecture. Cancer Res. 1981;41(2):361–375. [PubMed] [Google Scholar]
- 21.van der Bruggen P, Traversari C, Chomez P, et al. A gene encoding an antigen recognized by cytolytic T lymphocytes on a human melanoma. Science. 1991;254(5038):1643–1647. doi: 10.1126/science.1840703. [DOI] [PubMed] [Google Scholar]
- 22.Chen CH, Huang GT, Lee HS, et al. High frequency of expression of MAGE genes in human hepatocellular carcinoma. Liver. 1999;19(2):110–114. doi: 10.1111/j.1478-3231.1999.tb00019.x. [DOI] [PubMed] [Google Scholar]
- 23.Jang SJ, Soria JC, Wang L, et al. Activation of melanoma antigen tumor antigens occurs early in lung carcinogenesis. Cancer Res. 2001;61(21):7959–7963. [PubMed] [Google Scholar]
- 24.Kufer P, Zippelius A, Lutterbüse R, et al. Heterogeneous expression of MAGE-A genes in occult disseminated tumor cells: a novel multimarker reverse transcription-polymerase chain reaction for diagnosis of micrometastatic disease. Cancer Res. 2002;62(1):251–261. [PubMed] [Google Scholar]
- 25.Otte M, Zafrakas M, Riethdorf L, et al. MAGE-A gene expression pattern in primary breast cancer. Cancer Res. 2001;61(18):6682–6687. [PubMed] [Google Scholar]
- 26.Park MS, Park JW, Jeon CH, Lee KD, Chang HK. Expression of melanoma antigen-encoding genes (MAGE) by common primers for MAGE-A1 to -A6 in colorectal carcinomas among Koreans. J Korean Med Sci. 2002;17(4):497–501. doi: 10.3346/jkms.2002.17.4.497. [DOI] [PMC free article] [PubMed] [Google Scholar]
- 27.Ries J, Vairaktaris E, Mollaoglu N, Wiltfang J, Neukam FW, Nkenke E. Expression of melanoma-associated antigens in oral squamous cell carcinoma. J Oral Pathol Med. 2008;37(2):88–93. doi: 10.1111/j.1600-0714.2007.00600.x. [DOI] [PubMed] [Google Scholar]
- 28.Zambon A, Mandruzzato S, Parenti A, et al. MAGE, BAGE, and GAGE gene expression in patients with esophageal squamous cell carcinoma and adenocarcinoma of the gastric cardia. Cancer. 2001;91(10):1882–1888. [PubMed] [Google Scholar]
- 29.Laduron S, Deplus R, Zhou S, et al. MAGE-A1 interacts with adaptor SKIP and the deacetylase HDAC1 to repress transcription. Nucleic Acids Res. 2004;32(14):4340–4350. doi: 10.1093/nar/gkh735. [DOI] [PMC free article] [PubMed] [Google Scholar]
- 30.Aprelikova O, Pandolfi S, Tackett S, et al. Melanoma antigen-11 inhibits the hypoxia-inducible factor prolyl hydroxylase 2 and activates hypoxic response. Cancer Res. 2009;69(2):616–624. doi: 10.1158/0008-5472.CAN-08-0811. [DOI] [PMC free article] [PubMed] [Google Scholar]
- 31.Bai S, He B, Wilson EM. Melanoma antigen gene protein MAGE-11 regulates androgen receptor function by modulating the interdomain interaction. Mol Cell Biol. 2005;25(4):1238–1257. doi: 10.1128/MCB.25.4.1238-1257.2005. [DOI] [PMC free article] [PubMed] [Google Scholar]
- 32.Jungbluth AA, Busam KJ, Kolb D, et al. Expression of MAGE-antigens in normal tissues and cancer. Int J Cancer. 2000;85(4):460–465. [PubMed] [Google Scholar]
- 33.Jungbluth AA, Chen YT, Stockert E, et al. Immunohistochemical analysis of NYESO-1 antigen expression in normal and malignant human tissues. Int J Cancer. 2001;92(6):856–860. doi: 10.1002/ijc.1282. [DOI] [PubMed] [Google Scholar]
- 34.Giono LE, Manfredi JJ. The p53 tumor suppressor participates in multiple cell cycle checkpoints. J Cell Physiol. 2006;209(1):13–20. doi: 10.1002/jcp.20689. [DOI] [PubMed] [Google Scholar]
- 35.Haupt S, Berger M, Goldberg Z, Haupt Y. Apoptosis—the p53 network. J Cell Sci. 2003;116(pt 20):4077–4085. doi: 10.1242/jcs.00739. [DOI] [PubMed] [Google Scholar]
- 36.Brugarolas J, Chandrasekaran C, Gordon JI, Beach D, Jacks T, Hannon GJ. Radiation-induced cell cycle arrest compromised by p21 deficiency. Nature. 1995;377(6549):552–557. doi: 10.1038/377552a0. [DOI] [PubMed] [Google Scholar]
- 37.Chipuk JE, Kuwana T, Bouchier-Hayes L, et al. Direct activation of Bax by p53 mediates mitochondrial membrane permeabilization and apoptosis. Science. 2004;303(5660):1010–1014. doi: 10.1126/science.1092734. [DOI] [PubMed] [Google Scholar]
- 38.Deng C, Zhang P, Harper JW, Elledge SJ, Leder P. Mice lacking p21CIP1/WAF1 undergo normal development, but are defective in G1 checkpoint control. Cell. 1995;82(4):675–684. doi: 10.1016/0092-8674(95)90039-x. [DOI] [PubMed] [Google Scholar]


