

Abstract
Background:
Population-based estimates of traffic accidents (TAs) are not readily available for developing countries. This study examined the contribution of socioeconomic status (SES) to the risk of TA among Iranian adults.
Methods:
A total of 64,200people aged ≥18years were identified from 2008 Urban Health Equity Assessment and Response Tool (Urban HEART) survey. 22,128 households were interviewed to estimate the overall annual incidence, severity and socioeconomic determinants of TAs for males and females in Iranian capital over the preceding year. Wealth index and house value index were constructed for economic measurement. Weighted estimates were computed adjusting for complex survey design. Logistic regression models were used to examine individual and SES measures as potential determinants of TAs in adults.
Results:
The overall incidence of traffic accident was 17.3(95% CI 16.0, 18.7) per 1000 per year. TA rate in men and women was 22.6(95% CI 20.6, 24.8) and 11.8(95% CI 10.4, 13.2), respectively. The overall TA mortality rate was 26.6(95% CI 13.4, 39.8) per 100,000 person-years, which was almost three times higher in men than that for women (40.4 vs. 12.1 per 100,000person-years). Lower economic level was associated with increased incidence and mortality of TA. Association between SES and incidence, and severity and mortality of TA were identified.
Conclusion:
TAs occur more in lower socioeconomic layers of the society. This should be taken seriously into consideration by policy makers, so that preventive programs aimed at behavioral modifications in the society are promoted to decrease the health and economic burden imposed by TAs.
Keywords: Accidents, incidence, socioeconomic status, traffic
INTRODUCTION
Traffic accidents (TAs) represent a leading and increasing contributor to regional and global disease burden.[1] Traffic injuries are a leading cause of death, killing nearly 1.3 million people annually. Unless action is taken urgently, the number of road traffic injuries and deaths is likely to continue to rise in most regions of the world as motorization increases. Indeed, if current trends continue unabated, road traffic injuries are predicted to rise from their current position as the ninth leading cause of death to become the fifth leading cause of death by 2030.[2] Most of the projected increase in TAs will occur in low- and middle-income regions of the world due to the rapid growth in motor vehicle numbers increasing the exposure to risk factors such as speed and alcohol, and exacerbated by inadequate enforcement of traffic safety regulations and public health infrastructure.[3] Overall, 14.9% of all deaths with 26.9% of years of lost life were from injuries in Iran and deaths from traffic injuries (30.0/100,000) are the highest in the world.[4]
Socioeconomic status (SES) is generally recognized as an important predictor of various health conditions, although its influence on many specific aspects of the health of populations is not fully understood. Injury is one area that is not well understood with respect to socioeconomic determinants, especially in developing countries. Injury is a leading acute health problem as shown by the magnitude and burden of the problem, but the potential for primary prevention does exist. The identification of socioeconomic gradients in risk for injury through a descriptive study may provide opportunities for targeting of preventive interventions to high-risk groups.[5]
Despite the high burden, developing countries have just begun to systematically address injury control in policies and programs.[6] This lack of programmatic and policy response to injury is in part due to lack of population-based and national estimates of injuries in developing countries.[7] Hospital-based statistics and police records are the common sources of information for injuries in developing countries. However, these sources underestimate the burden.[8] Iran lacks knowledge about the socioeconomic distribution of TAs. Nevertheless, scattered evidence, mainly from mortality statistics, reveal that socioeconomic differences with regard to all injuries, and to traffic injuries in particular, are considerable.[4,9]
In this paper, we use the “Urban Health Equity Assessment and Response tool” (Urban HEART Survey) of Tehran. We present the annual incidence estimates of traffic injuries in Tehran, which have the heaviest traffic in Iran, to guide future research and policy action regarding injury in the country. Additionally, the survey provides annual incidence estimates for all types of TAs, socioeconomic differences in TAs and for any given type of traffic injury modified by socioeconomic factors.
METHODS
This was a population-based cross-sectional survey of a representative sample residing in Tehran metropolitan (total population around 8,171,000 inhabitants). The analysis was based on the Urban Health Equity Assessment and Response Tool (Urban HEART) from April through June 2008. Urban HEART is a collaborative cross-sectional study facilitated by the World Health Organization for identifying differences in health opportunities between people living in various parts of Tehran and belonging to different socioeconomic groups.[10] Ethical committee of Tehran University of Medical Sciences reviewed and approved the study following the guidelines of Helsinki Declaration.
The survey sample had a three-stage stratified design. All 22 districts of Tehran (according to 2006 population census) were taken as strata. Based on the master sampling frame, residence blocks were taken randomly as primary sampling units (PSUs), then eight families were systematically selected within each block. There were approximately 1000 households in any strata which were sampled using a systematic sampling in blocks. All residents of the 22,128 households were included in the study. The information about characteristics of each household member was collected by interviewing the head of family, after taking the informed consent. Household interviews were conducted using trained and standardized procedures for data collection. The interviews were conducted at different times and in all days of the week.[11] For the purpose of this study, the analysis was restricted to 64,200 adults aged 18 years and older, a population at high risk for injury.
The age was categorized based on publication of the World Health Organization (WHO) for prevention of TA, the second year of driving experience: graduates (18–24 years inclusive), more experienced drivers and with less risky behavior in traffic (from 25 to 44 years) and drivers who have safer profile for the direction (45 years and over).[12]
The socio-demographic variables were age, sex, educational attainment, self-reported ethnicity, marital status, occupation/employment status, dwelling duration and family size. People who had a fixed wage with work were classified as employed and those without work were grouped as pensioner. Economic variables in the Iranian society were complex, especially with large differences in a job and in self-reporting questionnaire. This study used two indices as proxy measure of economic status: (1) wealth index and (2) house value. We constructed wealth index by possession of durable assets (television, freezer, PC), and ownership of house, car and motorcycle (personal use of motorcycle and car not for job) and house area, which were assigned a weight or factor score generated through principle component analysis.[13] Principal component is a technique for extracting from a set of variables those few orthogonal linear combinations of the variables that capture the most common information successfully. Intuitively, the first principal component of a set of variables is the linear index of all the variables that capture the largest amount of information which are common to all the variables. The resulting scores were distributed normally with mean 0 and standard deviation 1. People were ranked according to their scores and divided into four quintiles to understand the economic inequality. The “house value index” was constructed according to the high difference in house value in the districts of Tehran and the general concept of getting a better house proportional to wealth. The building area value was taken as per the former valuation of management of real estate transactions, Statistical Center of Iran (August 2008). Information on area value was multiplied by house area to provide the indicator. For this analysis, information on the value of the household property was combined with housing tenure to provide an indicator with five groupings. Tenure house formed the reference category, and those in owner-occupier households were grouped into four quartiles depending on the house value.[14]
The outcome variables included: (1) TA occurrences queried as, “Have you had any traffic accidents in the past 12 months?”; (2) Incidence rate of any type of TA (pedestrian, bike, motorcycle and car); (3) severity of TA which displayed by traffic accident hospitalization rate. A standardized definition of the nature of the TA was read by the interviewer for all participants: It is run over any traffic accident, collision between vehicles, bicycle and motorcycle accidents, that occur on streets or roads and make person to have at least one day off from work.[15] In this research, we have not included train, tram and subway accidents. We draw attention to the fact that a TA may be more or less severe and people can get hurt or not. If any person in the family was dead in the past 12 years, the information was obtained from the family.
Analysis was done using SPSS 13 and Stata 8 software. Weighted analysis was performed. The survey frequency and survey logistic options were used to adjust for design effect of the survey and get valid estimates. Accident incidence rates were calculated based on 1000 persons.
Univariate analysis was performed exploring relationships between TA and socio-demographic and economic variables. Multivariate analysis was performed to get adjusted odds ratios, controlling for all SES variables that significantly contributed (P<0.05) to the models included in multivariate analysis. Confidence intervals were reported at 95% level throughout this study.
RESULTS
In the study, there were 64,200 people aged ≥18 years living in Tehran, of whom 50.8% were males [Table 1]. Age and sex distribution of participants were like the general population according to the national survey, 2006. There were 1059 self-reported TAs in the past year. Pedestrian and bike accidents constituted 13.7% and 1.3% of all TAs, respectively. The most frequent accidents were motorcycle (29.3%) and car accidents (55.7%). The overall annual incidence of TA was estimated at 17.3 (95% CI 17.3) per 1000 per year. Overall, TA rate in men was 22.6 per 1000, two times higher than in females [Table 2]. Applied to the current population,[16] this implies a total burden of 141,000 TAs per year for adults in Tehran.
Table 1.
Distribution % (standard errors) of social variables in traffic accident according to types
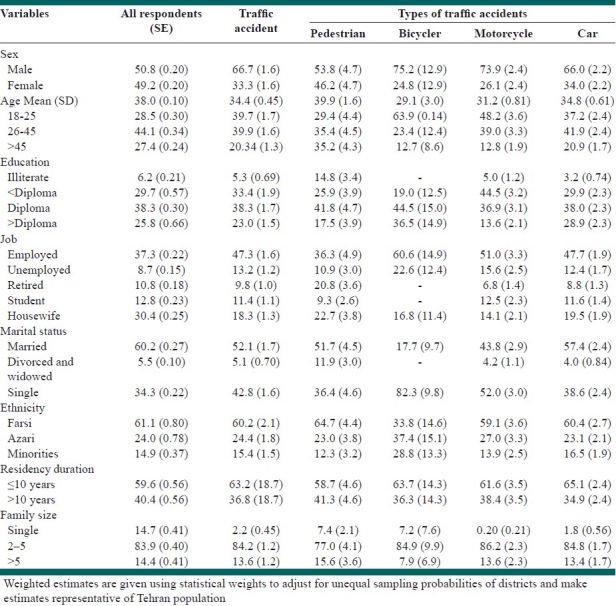
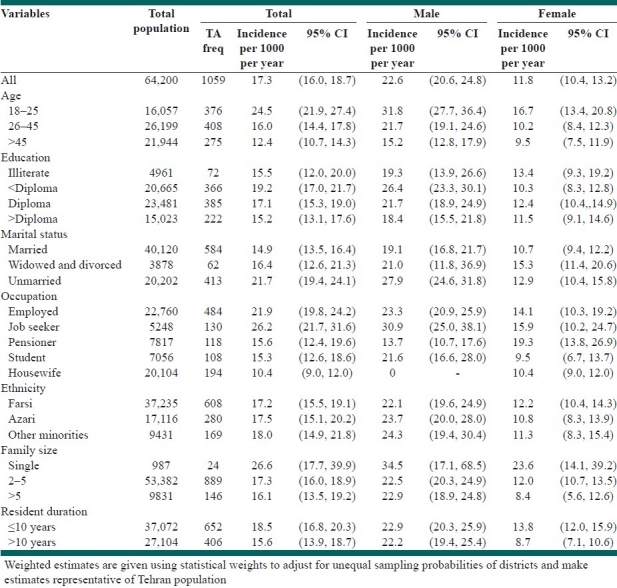
Table 2.
Annual incidence of reported traffic accidents according to gender by socio-demographic variables
The percentage distribution of TA and its types according to socio-demographic variables are presented in Table 1. Male to female ratio in TA was 2:1; a higher ratio was seen in bike and motorcycle accidents and a lower ratio in pedestrian accidents. Younger age groups were proportionately higher among motorcycle and bike accidents. Pedestrians had the least educational level in all TA types, while this type of TA was the most common in retired people.
We also examined the annual incidence rate of TAs according to gender by socio-demographic variables [Table 2]. The incidence of TA decreased with age and was highest among the 18-25 year age group. TAs were more common among illiterate women and among the men with a prediploma education. TA rate was slightly higher among unemployed and single men, but the incidence was higher in widowed/divorced and retired women. The TA rate was inversely reduced by an increase in the family size. Similarly, TA decreased with an increase in dwelling time. The TA rate was nearly the same in various ethnicities. The overall TA mortality rate was 26.6 (95% CI 13.4, 39.8) per 100,000 person-years. This rate for men was almost three times higher than that for women (40.4 vs. 12.1 per 10,000 person-years) (data not shown).
Table 3 contains the incidence rate of TAs in each quartile of economic indices. The highest incidence of TA was seen in tenants, and with the increase of house value, TA rate decreased. The TA rate in the reference group was about 1.5 times more than that of the richest group (P<0.001 for the trend). The lowest economic level (first quartile) in house value index showed the highest incidence in TA. This difference was largely unchanged after adjustment for education, marital status, gender and age. Likewise, the lowest quartile of wealth index had the highest rate of TA. The overall TA rate of the poorest people was 56% more that of the richest group. This association slightly decreased after adjustment (41%). Mortality of TA in the tenant house category was 15.5 per 100,000 which suddenly increased to 83.1 per 100,000 in the lowest group of house owners, and as the house value increased, the mortality rate decreased (data not shown).
Table 3.
Annual incidence of reported traffic accident by economic variables
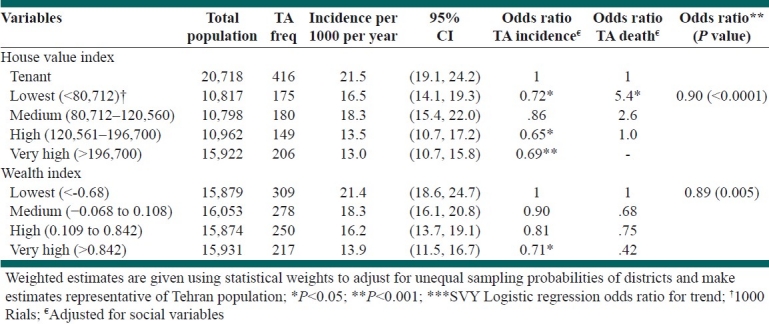
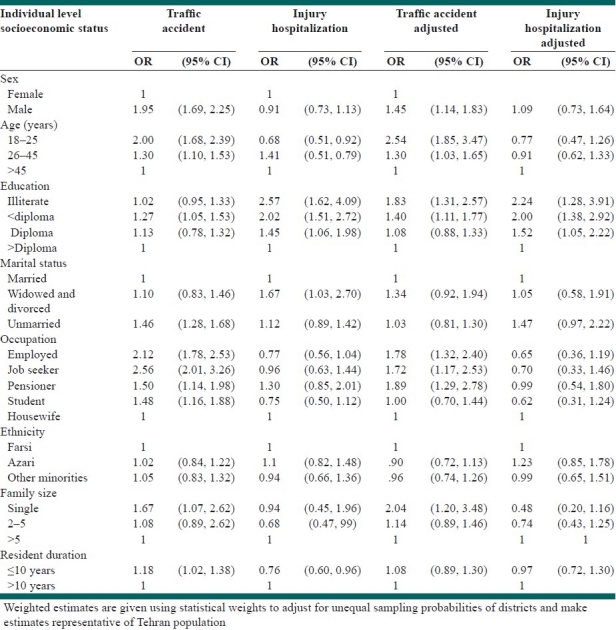
Table 4 presents the odds ratios for socio-demographic variables independently and adjusted odds from a multivariate model. Overall, they were 45% more common among males than females, controlling for the other variables. Multivariate analysis continues to show strong association with age and TA, with the younger age group (18–25 years) being 2.5 times more likely to have TA than the older group (>45 years). The risk of TA among illiterates was 1.8 times more than that for people with higher education (college) in the adjusted model. Marital status did not significantly change the risk of accident in multivariate model. The same situation was seen for ethnicity and dwelling duration. Overall hospitalization rate for illiterate people was proportionately 2.24 times higher than for those with higher education.
Table 4.
Univariate and multivariable analysis using adjusted odds ratio of reported traffic accidents by demographic and socioeconomic variables
DISCUSSION
The Urban HEART study was a community-based survey to measure the inequalities in health outcomes and social determinants of health including annual incidence of TAs in Tehran. Generally, there are very few studies in Iran regarding the effects of socioeconomic factors on trauma, especially TAs.
In our study, annual TA rate in Tehran was 17.3 (95% CI 16.0, 18.7) per 1000 people per year, whereas according to the Ministry of Health report (2007), the figure was estimated to be 5.3 per 1000 people per year.[17] This difference is probably due to fewer TA reports to the national registry and its sole reliance on hospital reports, limiting its findings. In the same report, death rates were also noticeably underestimated, reported to be 4.58 per 100,000 people which is nearly one-fifth of the estimated figure in our study. The WHO estimated the incidence and mortality rate of TAs to be 9.6 per 1000 and 32.2 per 100,000, respectively.[18] Naghavi estimated national urban mortality rate of TA to be 45.8 per 100,000. This study was hospital based and conducted in 12 provinces of Iran in a limited period of time in 2005.[19] It seems our study has a more precise estimation due to its large sample size and community-based information as well as taking different layers of the society into consideration.
Males were twice likely to have accidents than females. This ratio was higher for motorcycle and bicycle accidents. The highest percent among women was seen in the pedestrian involved accidents. These findings are consistent with the findings of other studies from developing countries.[8,19,20] This relates to the gender roles of males and females and also with women's social limitations regarding riding motorcycles and bicycles. Men are more likely to be involved in work outside homes and on the street/roads than women in Iran. It is estimated that only 12.5% of women were employed outside of their homes in Tehran.[21] After adjustment of job, educational level or other socioeconomic determinants, this ratio remained 1.5 and it can be related to gender.
The majority of trauma cases were young people. Previous studies have also indicated that young men are at the highest risk for trauma.[22,23] We found that the middle-aged group constituted a major part of car accidents and the proportion of young people in bike and motorcycle accidents was prominent while the pedestrian involved accidents had people of older age. The effect of age increased after adjustment for socioeconomic factors. Several possible reasons for this have been proposed including the greater risky behavior in young people or more exposure to high-risk positions. Although the severity of trauma increased 1.5-fold with the increase in age group, this ratio became insignificant in the adjusted model. Other studies have also reported the peak age for trauma severity to be in the second and third decades of life[19–21] . The incidence of TA in singles was 1.5 times that of married people, especially in men, but these gradients were little attenuated by adjustment for socioeconomic factors. This result is qualitatively consistent with the previous reports[24,25] and some specially unadjusted studies have reported contrasting results.[26] If the observed association between marital status and driver injury risk was causal, it might reflect a generally greater willingness by single people to take risks while driving. This tendency has been observed for some established risk factors for vehicle related fatality, including dangerous driving and not using a seatbelt. While adjustment was made for usual socioeconomic variables, the odds ratio for never married people was attenuated in this study.
The highest TA was in people with less than 12 years of education, and TA rates declined as the education level rose notably to the extent that people of the prediploma group were found to be 27% more likely to have suffered a TA in comparison to highly educated people. Though the illiterates had a low TA rate which might be due to their limited facing of predisposing situations, in the adjusted model, the figure for the illiterates rose to 1.8 times more than that of the highly educated people. The association of TA and education was increased in the multivariate analysis (80%). This may indicate the direct effect of education on TA after removing other socioeconomic variables, which is in agreement with other studies.[27,28] Also, in some studies, correlation of education with TA was insignificant.[15] There was also a clear correlation between the level of education and the severity of trauma and the rates of severe trauma among the illiterates were more than twice the rate in the highly educated group.
Unemployed men and pensioner women showed higher incidence of TA. This association in unemployed persons decreased after removing the effect of socioeconomic factors and high incidence was seen in pensioners and employed people. It can be explained by exposure to daily traffic on the way to the workplace or finding their necessities. These findings are consistent with other reports.[29,30]
Trauma incidence in single member families was 1.7 times more than in families with over five members and the correlation was even more significant after excluding factors such as age, education level, marital status and other socioeconomic factors. The Mexico study showed pedestrian trauma in children increased in relation to an increase in the number of family members to an extent where being three siblings increased the trauma rates fourfold in comparison to families with a single child. In addition, living in families without parents also increased the trauma incidence. However, in the Mexico study, socioeconomic factors were not fully included and yet again trauma was only studied in children and it seems that children are more influenced by the effect of the number of family members.[31]
Minorities had the highest rate of accidents; however, in the adjusted model, this relation was not significant. Therefore, it does not seem that ethnicity is an important factor in the incidence or the severity of trauma in Tehran. A study in Florida found no association of ethnicity and race with the outcome of traffic trauma[32] and some studies have reported contrasting results.[33] Less than 10 years residence in a neighborhood was associated with a higher rate of traffic trauma and the difference was more prominent among women. However, in the adjusted model, no correlation was found. Therefore, it seems that if migration has a role in TAs, it is effective through socioeconomic factors. A study in Peru focused on the risk factors in child pedestrian accidents. and after excluding the environmental factors, the duration of residency in one area was found to act as a protective factor regarding traffic trauma.[34]
This study confirms the generally accepted view of a TA gradient between renters and owner occupiers. It also shows a gradient, of similar magnitude, within owner occupiers, between the lowest-and highest-valued houses. These gradients were little attenuated by adjustment for age, sex, education and marital status. Mortality rate of TA related to the level of house value and it was low in both extremes and the highest mortality rate was seen in lower group of house owners; perhaps the increased exposure and improving of accessibility with less appropriate traffic culture can explain this trend. Similarly, in wealth index, there was up to 54% decline in traffic trauma as the index level increased; after adjustment, this relation decreased but was significant statistically. The highest mortality rate of TAs was seen in lowest valued house owners; this suggests that people residing in cheaper houses in this study (low socioeconomic group) had either worse access to resources (including healthcare facilities) or more exposure to TAs reminiscent of worse traffic culture, although this should be taken cautiously due to the inadequate sample size of traffic deaths in various economic levels. These findings are consistent with other studies.[35,36] In a study conducted in Canada, severe vehicle accident trauma rates and the consequent hospital admission in the rich and poor areas were nearly the same. However, their rates were higher than what was seen in the middle-income category. In contrast, bicycle trauma and pedestrian trauma increased fourfold as the economic level declined.[37]
This study has a number of limitations, among which TAs’ “a year recall period” might have led to a lower estimation of the number of accidents. However, serious accidents are not forgotten in a year period.[38] Therefore, we do not believe that this has deterred the socioeconomic results of this study. Multiple traumas during the 1-year period in individuals were not taken into consideration and this could have led to a lower estimate of our results. Population-based estimates of injuries from developing countries are still uncommon and any reliable comparison cannot be made because of various definitions used in the surveys. Finally, we have no information about differential exposures across socioeconomic groups in terms of duration, environment at risk, quality of vehicle used and age of vehicle.
Overall, it can be concluded that TA rates in Iran's capital are much higher than that previously announced based on hospital reports. Most TAs occur among the lower socioeconomic layers of the society. Socioeconomic factors have a noticeable correlation with accident incidence, and if taken seriously into consideration by policy makers, it can lead to preventive programs aimed at behavioral modifications in the society and decrease the health and economic burden imposed by accidents. An interesting question for future research concerns the extent to which differences in individual risks are modified by differences between the places where people live.
ACKNOWLEDGMENTS
Urban HEART project in Tehran was fully supported by the Municipality of Tehran, and technical assistance was provided by WHO, especially WHO Kobe Centre and EMRO. Authors express their gratitude to all persons who were involved in designing and implementing the project. The present study was a part of PhD thesis by the first author, supported by Department of Epidemiology and Biostatistics, School of Public Health, affiliated to Tehran University of Medical Sciences.
Footnotes
Source of Support: Nil,
Conflict of Interest: None declared.
REFERENCES
- 1.Dan Chisholm HN. Road traffic injury prevention: An assessment of risk exposure and intervention cost-effectiveness in different world regions: Department of Health Systems Financing. 2008 Dec; Contract. [Google Scholar]
- 2.Toroyan T. Second global status report on road safety: WHO. 2011 doi: 10.1136/injuryprev-2013-040775. Contract. [DOI] [PubMed] [Google Scholar]
- 3.Ameratunga S, Hijar M, Norton R. Road-traffic injuries: Confronting disparities to address a global-health problem. Lancet. 2006;367:1533–40. doi: 10.1016/S0140-6736(06)68654-6. [DOI] [PubMed] [Google Scholar]
- 4.Akbari ME, Naghavi M, Soori H. Epidemiology of deaths from injuries in the Islamic Republic of Iran. East Mediterr Health J. 2006;12:382–90. [PubMed] [Google Scholar]
- 5.Simpson K, Janssen I, Craig WM, Pickett W. Multilevel analysis of associations between socioeconomic status and injury among Canadian adolescents. J Epidemiol Community Health. 2005;59:1072–7. doi: 10.1136/jech.2005.036723. [DOI] [PMC free article] [PubMed] [Google Scholar]
- 6.Peden M SR, Sleet D, Mohan D, Hyder AA, Jarawan E, Mathers C, editors. World report on road traffic injury prevention. 1st ed. Geneva, Switzerland: World Health Organization; 2004. [Google Scholar]
- 7.Lopez AD MC, Ezzati M, Jamison DT, Murray CJ, editors. Global Burden of Disease and Risk Factors. New York: Oxford University Press; 2006. [Google Scholar]
- 8.Fatmi Z, Hadden WC, Razzak JA, Qureshi HI, Hyder AA, Pappas G. Incidence, patterns and severity of reported unintentional injuries in Pakistan for persons five years and older: Results of the National Health Survey of Pakistan 1990–94. BMC Public Health. 2007;7:152. doi: 10.1186/1471-2458-7-152. [DOI] [PMC free article] [PubMed] [Google Scholar]
- 9.Rahimi-Movaghar V, Zarei MR, Saadat S, Rasouli MR, Nouri M. Road traffic crashes in Iran from 1997 to 2007. Int J Inj Contr Saf Promot. 2009;16:179–81. doi: 10.1080/17457300903024277. [DOI] [PubMed] [Google Scholar]
- 10.WCfH, editor. Urban HEART, Health Equity Assessment and Response Tool. In: Development. Kobe, Japan: 2008. WHO. [Google Scholar]
- 11.Asadi-Lari MRV-M, Faghihzadeh S, Montazeri A, Farshad AA, Kalantari N, Maher A, et al. The application of urban health equity assessment and response tool (Urban HEART) in Tehran; concepts and framework. Med J Islam Republic Iran. 2010;24:175–85. [Google Scholar]
- 12.World_Health_Organization. The World Health Report 2002: Reducing risks, promoting healthly life Geneva. 2002. [Last cited 2008 Aug].
- 13.Rutstein Shea, Oscar JK. The DHS Wealth Index. DHS Comparative Reports. Calverton, Maryland: ORC Macro; 2004. Aug, Contract. [Google Scholar]
- 14.Connolly S, DORa, MR House value as an indicator of cumulative wealth is strongly related to morbidity and mortality risk in older people: A census-based cross-sectional and longitudinal study. Int J Epidemiol. 2010;39:383–91. doi: 10.1093/ije/dyp356. [DOI] [PubMed] [Google Scholar]
- 15.Magalhães AF, Lopes CM, Koifman RJ, Muniz PT. Prevalence of self-reported traffic accidents in Rio Branco, Northern Brazil. Rev Saude Publica. 2011;45:738–44. doi: 10.1590/s0034-89102011005000031. [DOI] [PubMed] [Google Scholar]
- 16.Statistics TMsDo. Building Information System Report. 2011. [Last updated on 2011; cited]. Available from: http://statistics.tehran.ir/
- 17.Afshar MG. National Injury Report. Tehran: National Center for Disaster Management and emergency medicine; Department of Disaster Prevention; 2007. [Google Scholar]
- 18.Global status report on road safety. Geneva: WHO, Department of Violence and Injury Prevention; 2009. WHO. [DOI] [PubMed] [Google Scholar]
- 19.Naghavi M. Adverse Health Outcomes of Road Traffic Injuries in Iran after Rapid Motorization. Arch Iranian Med. 2009;12:284–94. [PubMed] [Google Scholar]
- 20.Karbakhsh M, Zandi NS, Rouzrokh M, Zarei MR. Injury epidemiology in Kermanshah: The National Trauma Project in Islamic Republic of Iran. East Mediterr Health J. 2009;15:1. [PubMed] [Google Scholar]
- 21.Iran SCo. Population and Housing Census. 2006. [cited]. Available from: http://www.amar.org.ir/nofoos1385/default-1208.aspx .
- 22.Mohaymany AS, Kashani AT, Ranjbari A. Identifying Driver Characteristics Influencing Overtaking Crashes. Traffic Inj Prev. 2010;11:411–6. doi: 10.1080/15389588.2010.485283. [DOI] [PubMed] [Google Scholar]
- 23.Kanchan T, Menezes RG, Bakkannavar SM. Age and gender variations in trend of road traffic fatalities in Manipal, India. Med Sci Law. 2010;50:192–6. doi: 10.1258/msl.2011.010018. [DOI] [PubMed] [Google Scholar]
- 24.Lagarde E, Chastang JF, Gueguen A, Coeuret-Pellicer M, Chiron M, Lafont S. Emotional stress and traffic accidents: The impact of separation and divorce. Epidemiology. 2004;15:762–6. doi: 10.1097/01.ede.0000142140.77194.ad. [DOI] [PubMed] [Google Scholar]
- 25.Wong P, Gutiérrez C, Romaní F. Self-reporting of road traffic accidents in a national survey of urban population in Peru. Rev Peru Med Exp Salud Publica. 2010;27:170–8. doi: 10.1590/s1726-46342010000200003. [DOI] [PubMed] [Google Scholar]
- 26.Whitlock G, Norton R, Clark T, Jackson R, MacMahon S. Motor vehicle driver injury and marital status: A cohort study with prospective and retrospective driver injuries. Inj Prev. 2004;10:33–6. doi: 10.1136/ip.2003.003020. [DOI] [PMC free article] [PubMed] [Google Scholar]
- 27.Spoerri A, Egger M, von Elm E Swiss National Cohort Study. Mortality from road traffic accidents in Switzerland: Longitudinal and spatial analyses. Accid Anal Prev. 2011;43:40–8. doi: 10.1016/j.aap.2010.06.009. [DOI] [PubMed] [Google Scholar]
- 28.Morowatisharifabad M. The Health Belief Model variables as predictors of risky driving behaviors among commuters in Yazd, Iran. Traffic Inj Prev. 2009;10:436–40. doi: 10.1080/15389580903081016. [DOI] [PubMed] [Google Scholar]
- 29.Boufous S, Williamson A. Factors affecting the severity of work related traffic crashes in drivers receiving a worker's compensation claim. Accid Anal Prev. 2009;41:467–73. doi: 10.1016/j.aap.2009.01.015. [DOI] [PubMed] [Google Scholar]
- 30.Ryb GE, Dischinger PC, Kufera JA, Soderstrom CA. Social, behavioral and driving characteristics of injured pedestrians: A comparison with other unintentional trauma patients. Accid Anal Prev. 2007;39:313–8. doi: 10.1016/j.aap.2006.08.004. [DOI] [PubMed] [Google Scholar]
- 31.Celis A, Gomez Z, Martinez-Sotomayor A, Arcila L, Villaseñor M. Family characteristics and pedestrian injury risk in Mexican children. Inj Prev. 2003;9:58–61. doi: 10.1136/ip.9.1.58. [DOI] [PMC free article] [PubMed] [Google Scholar]
- 32.Tepas JJ PE, 3rd, Orban BL, Flint LM. Insurance status, not race, is a determinant of outcomes from vehicular injury. J Am Coll Surg. 2011;212:727–9. doi: 10.1016/j.jamcollsurg.2010.12.016. [DOI] [PubMed] [Google Scholar]
- 33.Laing GJ, Logan S. Patterns of unintentional injury in childhood and their relation to socio-economic factors. Public Health. 1999;113:291–4. doi: 10.1016/s0033-3506(99)00182-1. [DOI] [PubMed] [Google Scholar]
- 34.Donroe J, Tincopa M, Gilman RH, Brugge D, Moore DA. Pedestrian road traffic injuries in urban Peruvian children and adolescents: Case control analyses of personal and environmental risk factors. PLoS One. 2008;3:e3166. doi: 10.1371/journal.pone.0003166. [DOI] [PMC free article] [PubMed] [Google Scholar]
- 35.Chakravarthy B, Anderson CL, Ludlow J, Lotfipour S, Vaca FE. The relationship of pedestrian injuries to socioeconomic characteristics in a large Southern California County. Traffic Inj Prev. 2010;11:508–13. doi: 10.1080/15389588.2010.497546. [DOI] [PubMed] [Google Scholar]
- 36.Donroe J, Gilman RH, Brugge D, Mwamburi M, Moore DA. Falls, poisonings, burns, and road traffic injuries in urban Peruvian children and adolescents: A community based study. Inj Prev. 2009;15:390–6. doi: 10.1136/ip.2008.019893. [DOI] [PubMed] [Google Scholar]
- 37.Oliver L, Kohen D. Neighbourhood income gradients in hospitalisations due to motor vehicle traffic incidents among Canadian children. Inj Prev. 2009;15:163–9. doi: 10.1136/ip.2008.020347. [DOI] [PubMed] [Google Scholar]
- 38.Mock CN, Abantanga F, Cummings P, Koepsell TD. Incidence and outcome of injury in Ghana: A community-based survey. Bull World Health Organ. 1999;77:955–64. [PMC free article] [PubMed] [Google Scholar]