The stability and rapid specific tumor targeting of copper 64–fibronectinEI3.4.39 render it as a molecular imaging agent with potential for clinical translation for identification and localization of epidermal growth factor receptor–overexpressing tumors.
Abstract
Purpose:
To assess the ability of an engineered epidermal growth factor receptor (EGFR)–binding fibronectin domain to serve as a positron emission tomographic (PET) probe for molecular imaging of EGFR in a xenograft mouse model.
Materials and Methods:
An EGFR-binding fibronectin domain (fibronectin abbreviated to Fn when bound) was site-specifically labeled with copper 64 (64Cu) (8 MBq/nmol). Copper 64–Fn binding was tested in cell cultures with varying EGFR expression. Stability in human and mouse serum was measured in vitro. Animal experiments were approved by the Stanford University Institutional Animal Care and Use Committee. Copper 64–Fn (approximately 2 MBq) was used for PET in mice (n = 5) bearing EGFR-overexpressing xenografted tumors (approximately 5–10 mm in diameter). Results of tomography were compared with those of ex vivo gamma counting of dissected tissues. Statistical analysis was performed with t tests and adjustment for multiple comparisons.
Results:
Copper 64–Fn exhibited EGFR-dependent binding to multiple cell lines in culture. The tracer was stable for 24 hours in human and mouse serum at 37°C. The tracer exhibited good tumor localization (3.4% injected dose [ID]/g ± 1.0 [standard deviation] at 1 hour), retention (2.7% ID/g ± 0.6 at 24 hours), and specificity (8.6 ± 3.0 tumor-to-muscle ratio, 8.9 ± 4.7 tumor-to-blood ratio at 1 hour). Specific targeting was verified with low localization to low-expressing MDA-MB-435 tumors (0.7% ID/g ± 0.8 at 1 hour, P = .018); specificity was further demonstrated, as a nonbinding control fibronectin had low localization to EGFR-overexpressing xenografts (0.8% ID/g ± 0.2 at 1 hour, P = .013).
Conclusion:
The stability, low background, and target-specific tumor uptake and retention of the engineered fibronectin domain make it a promising EGFR molecular imaging agent. More broadly, it validates the fibronectin domain as a potential scaffold for a generation of various molecular imaging agents.
© RSNA, 2012
Supplemental material: http://radiology.rsna.org/lookup/suppl/doi:10.1148/radiol.12111504/-/DC1
Introduction
Engineered protein scaffolds can provide a generalizable source of targeted domains for molecular imaging agents. As such, multiple protein scaffolds, including affibodies (1–3), designed ankyrin repeat proteins (4), knottins (5,6), single camelidae variable domain nanobodies (7,8), peptides (9), and antibodies and their fragments (10–14), have been explored in this context. The 10th type III domain of human fibronectin is a strong alternative candidate. The small size (approximately 94 amino acids, 10 kDa) is expected to yield fast clearance of unbound agent for rapid imaging with low background and should elevate vascular extravasation (15) and tissue penetration to improve delivery to solid tumors (4,16). High stability (Tm = 86°C) (17) may translate to in vivo stability. Thermal stability, the absence of cysteine, and the presence of a single lysine distal to the binding region enable facile thiol or amine conjugation of imaging labels. The beta sheet structure contains three solvent-exposed loops at one end that can be engineered to provide picomolar to nanomolar affinity binding to a host of targets, which has been extensively validated by multiple laboratories (17–19). The current study assesses the ability of these biophysical benefits to translate into imaging efficacy in living subjects.
In particular, the fibronectin scaffold is evaluated toward the development of a molecular imaging agent targeted to the epidermal growth factor receptor (EGFR). EGFR is overexpressed in multiple cancer types, and expression correlates with reduced survival in glioma (20) and breast (21), colorectal (22), gastric (23), non–small cell lung (24), and prostate (25) cancers; likewise, overexpression is associated with reduced survival in 70% of bladder, cervical, esophageal, head and neck, and ovarian cancers (26). As such, identification and localization of cells with elevated EGFR levels would serve as a useful tool in the cancer clinic for early detection, patient stratification, and therapy monitoring. Multiple existing EGFR imaging agents provide both benefits and disadvantages (Table E1 [online]). Radiolabeled antibodies provide high tumor signal (11%–35% injected dose [ID]/g) but also modestly high liver uptake (12%–15% ID/g), and slow clearance yields low tumor-to-blood ratios (1.3–3.4) and necessitates late imaging time points (10–13). Alternative protein scaffolds, including nanobodies (7) and affibodies (1,2), have yielded improved tumor-to-blood ratios at earlier time points but with high renal signal. Radiolabeled small molecule inhibitors (27–29) and epidermal growth factor (30) yield modest tumor uptake but provide substantial potential antagonism and agonism, respectively. The combination of the readily engineered fibronectin scaffold with the quantitative capability of positron emission tomography (PET) offers a useful alternative for the generation of molecular imaging agents directed toward EGFR and other targets.
The purpose of this study was to assess the ability of an engineered EGFR-binding fibronectin domain to serve as a PET probe for molecular imaging of EGFR in a xenograft mouse model.
Materials and Methods
Production of Copper 64–Fibronectin
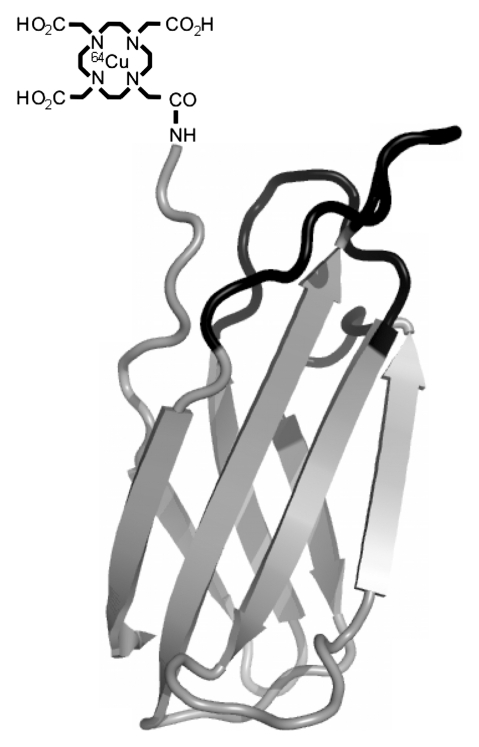
A bacterial expression plasmid was constructed to express the 92–amino acid EGFR-binding fibronectin clone EI3.4.3 (17) in which K47 was reverted to wild-type glutamic acid and K63 was mutated to arginine to create a single primary amine at the N-terminus (Fig 1a). (Fibronectin hereafter is abbreviated to Fn when binding.) In addition, a construct was created to encode for a nonbinding fibronectin domain based on the wild-type human loop sequences (this control later abbreviated as WT), except the arginine-glycine–aspartic acid sequence in the FG loop was shuffled to arginine–aspartic acid–glycine to eliminate integrin binding. The constructs also included DNA encoding for a C-terminal His6 epitope tag for purification. BL21 (DE3) Escherichia coli were transformed with the expression plasmid, grown in 1 L of lysogeny broth medium to an optical density of a sample measured at a wavelength of 600 nm of approximately 1, and induced with 0.5 mmol/L isopropyl b-D-1-thiogalactopyranoside for 1 hour. Cells were pelleted, resuspended in 10 mL of lysis buffer (50 mmol/L sodium phosphate, pH 8.0, 500 mmol/L sodium chloride, 5% glycerol, 5 mmol/L CHAPS detergent, 25 mmol/L imidazole, and complete ethylenediaminetetraacetic acid–free protease inhibitor cocktail), frozen and thawed, and sonicated. The insoluble fraction was removed by using centrifugation at 12 000g for 10 minutes. Fibronectin was purified by using immobilized metal affinity chromatography and reversed-phase high-performance liquid chromatography with a C18 column. Protein mass was verified by using matrix-assisted laser desorption-ionization time-of-flight mass spectrometry. Protein was lyophilized, resuspended in dimethylformamide, and reacted for 1 hour with 20 equivalents of the N-hydroxysuccinimide ester of DOTA with 2% triethylamine. DOTA-Fn was purified by using reversed-phase high-performance liquid chromatography. Conjugation was verified by using matrix-assisted laser desorption-ionization time-of-flight mass spectrometry. Radioactive 64CuCl2 (approximately 75 MBq, University of Wisconsin–Madison) was neutralized and incubated with approximately 40 mmol/L DOTA-Fn in 100 mmol/L sodium acetate with pH 5.5 at 37°C for 1 hour. Copper 64–DOTA-Fn (referred to as 64Cu-Fn) was purified with a desalting column (PD10; GE Healthcare, Piscataway, NJ) by using phosphate-buffered saline (PBS) for elution or by using reversed-phase high-performance liquid chromatography followed by rotary evaporation of solvent and dilution in PBS.
Figure 1a:
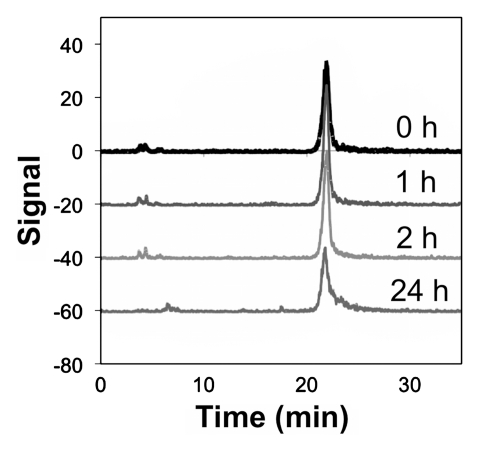
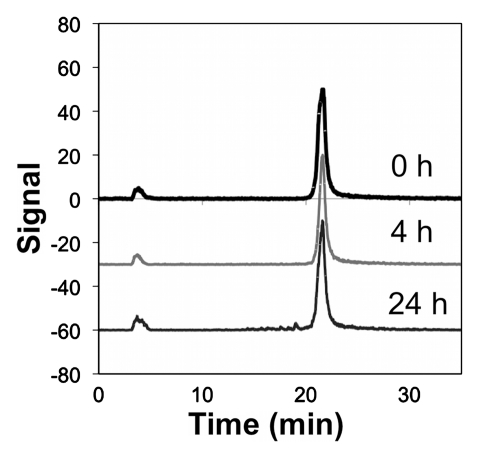
Copper 64 (64Cu)-Fn stability. (a) The fibronectin domain (depicted as the nuclear magnetic resonance solution structure of wild-type fibronectin domain [protein database code: 1TTG]) was engineered (mutated residues in black) for binding to EGFR (17). Tetraazacyclododecane tetraacetic acid (DOTA) was conjugated to the sole primary amine (the N-terminus) and used to chelate 64Cu. (b, c) Graphs show that 64Cu-FnEI3.4.39 remains intact in 50% (b) mouse and (c) human serum at 37°C.
Figure 1b:
Copper 64 (64Cu)-Fn stability. (a) The fibronectin domain (depicted as the nuclear magnetic resonance solution structure of wild-type fibronectin domain [protein database code: 1TTG]) was engineered (mutated residues in black) for binding to EGFR (17). Tetraazacyclododecane tetraacetic acid (DOTA) was conjugated to the sole primary amine (the N-terminus) and used to chelate 64Cu. (b, c) Graphs show that 64Cu-FnEI3.4.39 remains intact in 50% (b) mouse and (c) human serum at 37°C.
Figure 1c:
Copper 64 (64Cu)-Fn stability. (a) The fibronectin domain (depicted as the nuclear magnetic resonance solution structure of wild-type fibronectin domain [protein database code: 1TTG]) was engineered (mutated residues in black) for binding to EGFR (17). Tetraazacyclododecane tetraacetic acid (DOTA) was conjugated to the sole primary amine (the N-terminus) and used to chelate 64Cu. (b, c) Graphs show that 64Cu-FnEI3.4.39 remains intact in 50% (b) mouse and (c) human serum at 37°C.
Serum Stability
Copper 64–Fn (15 MBq/nmol) in PBS was mixed with an equal volume of mouse or human serum and incubated at 37°C with gentle shaking at 300 rpm for 1–24 hours. Trifluoroacetic acid was added, and the soluble fraction was clarified with a 0.22-mm filter. The sample was separated by using reversed-phase high-performance liquid chromatography with a C18 column with a gradient of 5%–85% acetonitrile in water (both with 0.1% trifluoroacetic acid) from 5 to 35 minutes and analyzed with a gamma ray detector.
In Vitro Binding Assays
A431 epidermoid carcinoma, SKOV-3 ovarian adenocarcinoma, SKBr3 mammary carcinoma, MDA-MB-435 mammary carcinoma, and BALB-3T3 murine fibroblast cells were cultured in high-glucose Dulbecco’s modified Eagle medium supplemented with 10% fetal bovine serum. MCF-7 mammary carcinoma cells were cultured in Roswell Park Memorial Institute 1640 medium supplemented with 10% fetal bovine serum. A431 cells were provided by Zhen Cheng (Stanford University), and SKOV-3, SKBr3, MDA-MB-435, and MCF-7 cells were provided by Ramasamy Paulmurugan (Stanford University). BALB-3T3 cells were purchased from ATCC (Manassas, Va). Cells were incubated at 37°C in humidified air with 5% CO2. For affinity measurement, 100 000 A431 or BALB-3T3 cells were washed with PBS with 0.1% bovine serum albumin and incubated with various concentrations of fibronectin. Cells were pelleted, washed with PBS with 0.1% bovine serum albumin, and incubated with fluorophore-conjugated anti-His6 antibody in PBS with 0.1% bovine serum albumin. Cells were washed and analyzed by using flow cytometry. The minimum and maximum fluorescence and the affinity value were determined by minimizing the sum of squared errors assuming a 1:1 binding interaction. Quadruplicate experiments were performed. For in vitro binding assay, 50 000 cells were plated in 96-well plates and grown for 24 hours. Cells were washed with PBS and incubated with 0 or 40 nM 64Cu-Fn (2–15 MBq/nmol) for 20 minutes. Cells were washed twice with PBS and detached with trypsin–ethylenediaminetetraacetic acid. Activity in each well was quantified with a gamma ray counter and normalized by cell number, which was quantified by using an automated cell counter. Activity per cell was normalized to the EI3.4.39 sample. Relative EGFR expression was measured by using flow cytometry. Cultured cells were detached by using trypsin–ethylenediaminetetraacetic acid, washed with PBS with 0.1% bovine serum albumin, and placed on ice to prevent EGFR internalization. Cells were labeled with anti-EGFR mouse antibody followed by Alexa Fluor 488–conjugated antimouse antibody (Invitrogen, Carlsbad, Calif). Alexa Fluor 488 signal was quantified by using flow cytometry and normalized to the signal from A431 cells.
Small Animal Imaging and Tissue Biodistribution
Animal experiments were conducted in accordance with federal and institutional regulations under a protocol approved by the Stanford University Institutional Animal Care and Use Committee. Five million A431 or 8 million MDA-MB-435 cells were subcutaneously injected into one shoulder of 8-week-old female nu/nu mice (Charles River, Wilmington, Mass). Xenografted tumors were grown to approximately 5–10 mm in diameter. Mice were anesthetized with 2% isoflurane in oxygen at 2 L/min and were injected in the tail vein with 1–2 MBq of 64Cu-Fn (n = 5 for EI3.4.39 with 4 MBq/nmol; n = 3 for WT9 with 2 MBq/nmol). Five-minute static PET scans were performed at 1, 2, 4, and 24 hours after injection by using a micro-PET rodent scanner (1.9-mm resolution, R4; Siemens, Malvern, Pa). Signals in tumor, kidneys, liver, and hind leg muscle were quantified with AsiPro VM (Siemens). Dynamic PET data were acquired for 64Cu-FnEI3.4.39 (n = 3 with 8 MBq/nmol) with a 35-minute scan with averaging every 1 minute for the first 10 minutes, then every 2 minutes for the next 20 minutes, and a final 5-minute average. Signals in the regions of interest were quantified at each time point with noncommercial AMIDE software (31). PET/computed tomographic (CT) coregistered images were acquired by immobilizing the anesthetized mouse on an imaging platform for a 5-minute static PET scan and a 512-projection scan with a micro-CT unit (Gamma Medica, Northridge, Calif) at 0.17-mm resolution. Images were coregistered in AMIDE by using four fiducial markers immobilized on the imaging platform. Volumetric rendering was prepared in AMIDE.
Xenograft tumors were prepared identically for tissue biodistribution studies. Anesthetized mice were injected through the tail vein with 1 MBq of 64Cu-Fn (n = 3 for EI3.4.39 with 4 MBq/nmol; n = 4 for WT9 with 11 MBq/nmol). Mice were sacrificed at 1 hour after injection, and the blood, bone, brain, heart, intestine, kidney, liver, lungs, muscle, pancreas, skin, spleen, stomach, and tumor were collected and weighed, and activity was measured with a gamma ray counter. Decay-corrected activity per mass of tissue was calculated.
Radiation dose to the kidneys was calculated by using the Medical Internal Radiation Dose formalism. The activities for kidney, liver, muscle, and tumor were integrated over time by using the trapezoid method. These accumulated activities were used to predict human renal absorbed dose by using the 64Cu dose–to-activity ratio for an adult male.
Statistical Analysis
Two-sample comparisons were determined by using a two-tailed t test for unequal variances. Multiple comparisons were analyzed by using a Kruskal-Wallis test followed by a two-tailed t test with a Holm-Bonferroni correction. The nonparametric Wilcoxon test was used for the block samples in the cell culture assay because of unequal variances. Correlations were assessed by using the Pearson correlation test. Analyses were performed in Excel (Microsoft, Redmond, Wash) and R software (version 2.13.1, http://www.r-project.org). Data were presented as means ± standard deviations. Statistical significance was stated and denoted for P less than .05 and P less than .005.
Results
Production of 64Cu-Fn
The 92–amino acid EGFR-binding fibronectin clone EI3.4.39 was produced with a His6-tag and a single primary amine, resulting in a decrease in the affinity to 5 nM ± 2 (standard deviation) (Fig E1 [online]). FnEI3.4.39 was purified by using immobilized metal affinity chromatography and reversed-phase high-performance liquid chromatography and was lyophilized. Correct molecular weight was verified by using matrix-assisted laser desorption-ionization time-of-flight mass spectrometry (10 902 Da measured, 10 903 Da expected). The copper chelator DOTA was conjugated to the N-terminus (Fig 1a), and the resultant DOTA-Fn was purified by using reversed-phase high-performance liquid chromatography. Conjugation was verified by using matrix-assisted laser desorption-ionization time-of-flight mass spectrometry (11 292 Da measured, 11 287 Da expected). Coupling efficiency was greater than 90%. The affinity of the conjugated agent was 17 nM ± 10 (Fig E1 [online]).
DOTA-Fn was labeled with radioactive 64Cu by incubation with 64CuCl2 at 37°C for 1 hour. Copper 64–DOTA-Fn (or 64Cu-Fn) was purified (. 96%) and diluted in PBS. Specific activity ranged from 2 to 15 MBq/nmol (mean, 8 MBq/nmol). The radiolabeled tracer was stable in 50% mouse or human serum for at least 24 hours at 37°C (Fig 1b, 1c). In addition, as a nontargeted control, a fibronectin domain was produced on the basis of the wild-type loop sequences, rather than the loops engineered for EGFR binding. The arginine-glycine–aspartic acid sequence in the FG loop was shuffled to arginine–aspartic acid–glycine to eliminate integrin avb3 binding (Table E2 [online]).
In Vitro Binding Assay
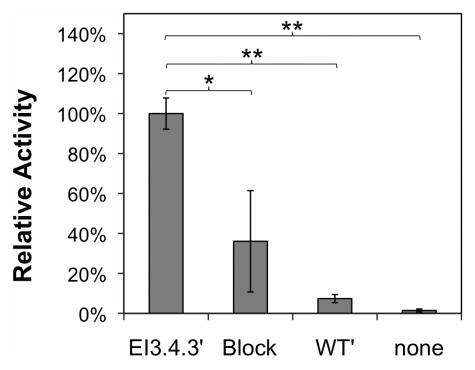
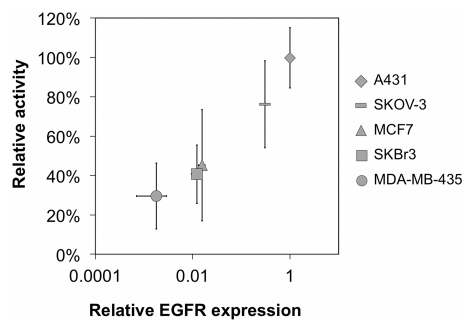
The activity and specificity of 64Cu-FnEI3.4.39 was assayed for binding to EGFR-expressing cells in cell culture. Forty nanomolar 64Cu-FnEI3.4.39 readily bound to A431 cells, whereas the nonbinding control 64Cu-FnWT9 exhibited only background signal (P < .0001); moreover, binding was inhibited by the addition of 800 nM unlabeled FnEI3.4.39 (P = .029) (Fig 2a). EGFR specificity was further demonstrated by the reduced binding to cell lines with reduced EGFR expression (P = .017, Pearson correlation) (Fig 2b). Thus, 64Cu-FnEI3.4.39 was a specific probe for EGFR expression.
Figure 2a:
Results of cell culture binding assay. (a) Graph shows that 64Cu-FnEI3.4.39 exhibits specific binding. EI3.4.39 = EGFR-binder 64Cu-FnEI3.4.39. Block = 40 nM 64Cu-FnEI3.4.39 with an excess (800 nM) of unlabeled FnEI3.4.39. WT9 = nonbinding control 64Cu-FnWT9. None = no fibronectin added. Value and error bars = mean and standard deviation of quadruplicate samples. * = P < .05, ** = P < .005. (b) Graph shows that binding correlates with EGFR expression in A431, SKOV-3 ovarian adenocarcinoma, MCF7 mammary carcinoma, SKBr3 mammary carcinoma, and MDA-MB-435 mammary carcinoma cells. Activity value and error bars = mean and standard deviation of triplicate experiments with six replicates each. Relative EGFR expression, as quantified with flow cytometry, represents mean and standard deviation of triplicate samples.
Figure 2b:
Results of cell culture binding assay. (a) Graph shows that 64Cu-FnEI3.4.39 exhibits specific binding. EI3.4.39 = EGFR-binder 64Cu-FnEI3.4.39. Block = 40 nM 64Cu-FnEI3.4.39 with an excess (800 nM) of unlabeled FnEI3.4.39. WT9 = nonbinding control 64Cu-FnWT9. None = no fibronectin added. Value and error bars = mean and standard deviation of quadruplicate samples. * = P < .05, ** = P < .005. (b) Graph shows that binding correlates with EGFR expression in A431, SKOV-3 ovarian adenocarcinoma, MCF7 mammary carcinoma, SKBr3 mammary carcinoma, and MDA-MB-435 mammary carcinoma cells. Activity value and error bars = mean and standard deviation of triplicate experiments with six replicates each. Relative EGFR expression, as quantified with flow cytometry, represents mean and standard deviation of triplicate samples.
Small Animal Micro-PET Imaging and Tissue Biodistribution
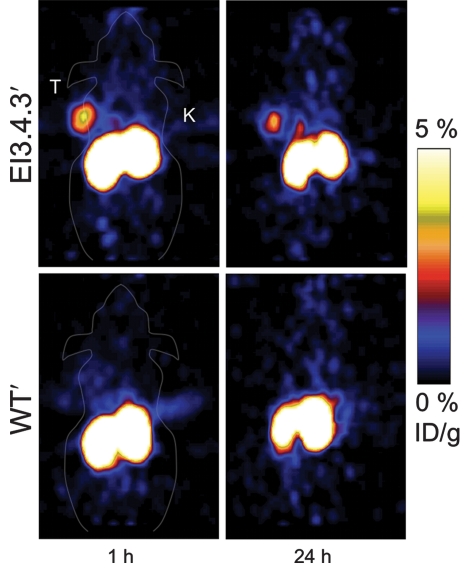
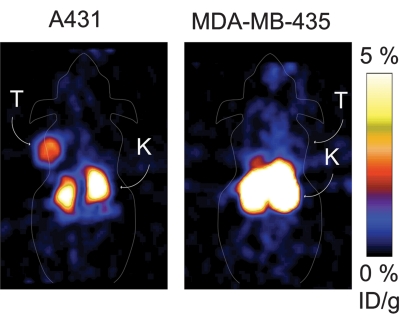
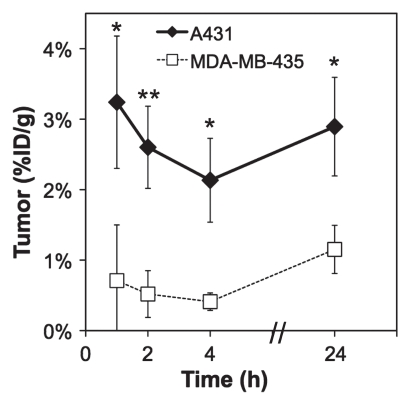
PET imaging with 64Cu-FnEI3.4.39 made the tumor clearly visible at all time points because of low background and selective tumor retention (Fig 3, Fig E2 [online]). The rapid kinetics of the small probe enabled rapid effective imaging, as at 1 hour after injection there was 3.4% ID/g ± 1.0 in the tumor and only 0.4% ID/g ± 0.2 in muscle (P = .0025) to yield an 8.6 ± 3.0 tumor-to-muscle ratio. Tumor retention was persistent, as the tumor signal was 2.7% ID/g ± 0.6 at 24 hours with a tumor-to-muscle ratio of 6.9 ± 3.1. Tumor targeting was EGFR specific, as the nonbinding control 64Cu-FnWT9 only yielded 0.8% ID/g ± 0.2 in the tumor with a 1.8 ± 0.8 tumor-to-muscle ratio at 1 hour (P = .013 and P = .010, respectively, relative to 64Cu-FnEI3.4.39). EGFR specificity was further tested by using xenografts of MDA-MB-435. Xenografts of these cells, which express EGFR at 0.2% ± 0.1 of the level of A431 cells (Fig 2b), exhibited significantly lower tumor uptake of 64Cu-FnEI3.4.39 at 1, 2, 4, and 24 hours (P = .018, P = .002, P = .009, and P = .010, respectively, relative to A431 xenografts) (Fig 4).
Figure 3a:
Micro-PET imaging data. A431 epidermoid carcinoma cells were xenografted into nude mice. Approximately 1.8 MBq 64Cu-Fn was injected in the tail vein. Five-minute static scans were performed at 1 and 24 hours after injection. (a) Coronal sections. K = kidneys. T = tumor. (b) Graphs show signals in the tumor, kidneys, and hind leg muscle quantified with software (AsiPro VM). Value and error bars = mean and standard deviation (n = 5 for EI3.4.39, n = 3 for WT9). * = P < .05, ** = P < .005.
Figure 4a:
Micro-PET imaging results of xenografts with different EGFR expression. A431 or MDA-MB-435 cells were xenografted into nude mice, and 1–2 MBq 64Cu-FnEI3.4.39 was injected in the tail vein. Five-minute static scans were performed at 1, 2, 4, and 24 hours after injection. (a) Coronal sections at 1 hour after injection. K = kidneys. T = tumor. (b) Graph shows signals in the tumor quantified with software. Value and error bars = mean and standard deviation (n = 6 for A431, n = 4 for MDA-MB-435). ** = P < .05, **** = P < .005.
Figure 3b:
Micro-PET imaging data. A431 epidermoid carcinoma cells were xenografted into nude mice. Approximately 1.8 MBq 64Cu-Fn was injected in the tail vein. Five-minute static scans were performed at 1 and 24 hours after injection. (a) Coronal sections. K = kidneys. T = tumor. (b) Graphs show signals in the tumor, kidneys, and hind leg muscle quantified with software (AsiPro VM). Value and error bars = mean and standard deviation (n = 5 for EI3.4.39, n = 3 for WT9). * = P < .05, ** = P < .005.
Figure 4b:
Micro-PET imaging results of xenografts with different EGFR expression. A431 or MDA-MB-435 cells were xenografted into nude mice, and 1–2 MBq 64Cu-FnEI3.4.39 was injected in the tail vein. Five-minute static scans were performed at 1, 2, 4, and 24 hours after injection. (a) Coronal sections at 1 hour after injection. K = kidneys. T = tumor. (b) Graph shows signals in the tumor quantified with software. Value and error bars = mean and standard deviation (n = 6 for A431, n = 4 for MDA-MB-435). ** = P < .05, **** = P < .005.
The probe exhibited 1.7% ID/g ± 0.3 uptake in liver at 1 hour for a tumor-to-liver ratio of 2.0 ± 0.4 (Fig E2 [online]). This was likely because of partial hepatic processing of the protein and not targeting of native liver EGFR, as this agent has only 2.5 mM ± 1.3 affinity for murine EGFR (Fig E1 [online]).
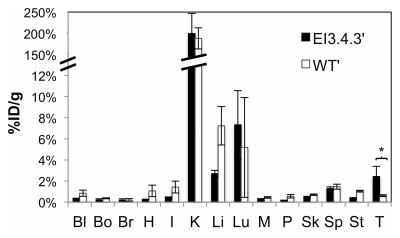
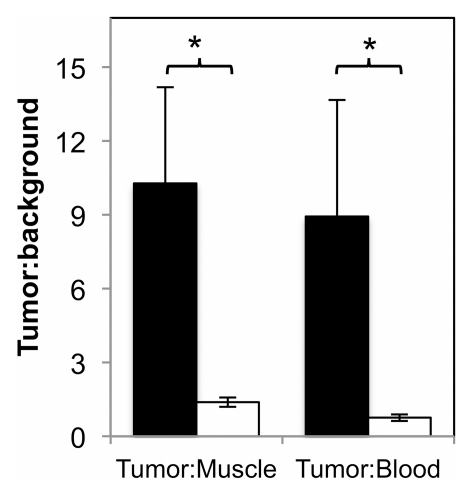
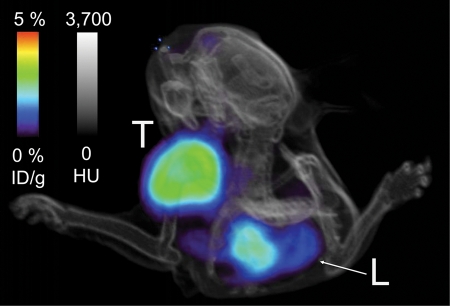
The micro-PET imaging results were corroborated by using activity measurement of resected tissues. Biodistribution analysis revealed 2.4% ID/g ± 1.0 and 0.6% ID/g ± 0.1 in tumor for the targeted and nontargeted probes, respectively (P = .042) (Fig 5a). Corresponding tumor-to-muscle ratios were 10.3 ± 3.9 and 1.4 ± 0.2 (P = .029) (Fig 5b). Tumor-to-blood ratios were 8.9 ± 4.7 and 0.8 ± 0.1 (P = .048) (Fig 5b). Tumor targeting was further analyzed with PET/CT, which exhibited specific signal in the left shoulder xenograft (Fig 6, Movie [online]).
Figure 5a:
Tissue biodistribution. Value and error bars = mean and standard deviation (n = 3–4). (a) Graph shows values for blood (Bl), bone (Bo), brain (Br), heart (H), intestine (I), kidney (K), liver (Li), lungs (Lu), muscle (M), pancreas (P), skin (Sk), spleen (Sp), stomach (St), and tumor (T) at 1 hour after injection. (b) Graph shows tumor-to-muscle and tumor-to-blood ratios. ** = P < .05.
Figure 5b:
Tissue biodistribution. Value and error bars = mean and standard deviation (n = 3–4). (a) Graph shows values for blood (Bl), bone (Bo), brain (Br), heart (H), intestine (I), kidney (K), liver (Li), lungs (Lu), muscle (M), pancreas (P), skin (Sk), spleen (Sp), stomach (St), and tumor (T) at 1 hour after injection. (b) Graph shows tumor-to-muscle and tumor-to-blood ratios. ** = P < .05.
Figure 6:
Micro-PET/CT image shows xenografted tumor (T ) in the shoulder is clearly visible relative to background. L = liver.
The primary disadvantage of the 64Cu-Fn probe is high renal accumulation and retention as evidenced by both PET (76% ID/g ± 13 at 1 hour) (Fig 3) and resected tissue biodistribution (199% ID/g ± 48 at 1 hour) (Fig 5a). Analysis of resected kidneys indicated a higher activity than measured by using micro-PET because of inadequacies of PET dead-time correction at high-activity densities. Activity data predicted a human renal dose of 2.1 mGy/MBq. Previously, in separate studies, mutation of a single positively charged residue to an acidic side chain has reduced renal uptake of a peptide by 6.2 ± 0.9-fold (32) and 7.9 ± 1.4-fold (33). However, mutation of one or two arginine residues to glutamic acids (R93E or R63E/R93E) did not decrease renal signal for 64Cu-FnEI3.4.39 (Fig E3 [online]).
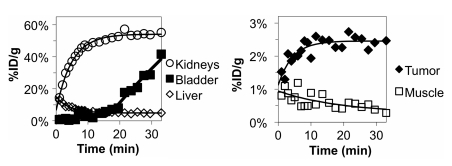
Although 3.4% ID/g ± 1.0 in tumor is a moderate signal, the low background renders 64Cu-FnEI3.4.39 as an effective molecular imaging probe. Moreover, the relatively small size of the probe provides rapid clearance from blood and muscle, enabling imaging at 1 hour after injection, which is useful for both research and clinical applications. In fact, results of dynamic PET imaging (Fig 7) revealed rapid accumulation of probe in tumor tissue (90% of maximum in 10 minutes) and consistently low muscle accumulation resulting from rapid blood clearance. Thus, effective imaging (4.0 ± 0.7 tumor-to-muscle ratio) was achievable as early as 20 minutes after injection.
Figure 7:
Graphs show dynamic micro-PET imaging results. A 35-minute dynamic scan was performed with micro-PET. Mean signals in ellipsoid regions of interest were quantified with software. Theoretical curves were fit assuming exponential kinetics (including a lag phase for bladder uptake). Data are from a single mouse experiment representative of triplicate experiments.
Discussion
The scientific and clinical interest in quantitative noninvasive in vivo detection of EGFR has resulted in multiple molecular imaging probes. Copper 64–DOTA-cetuximab achieved 13% ID/g ± 1, 23% ID/g ± 6, and 11% ID/g ± 3 in the tumor in xenograft experiments by Cai et al (10), Li et al (13), and Niu et al (12), respectively. However, the slow clearance of antibodies from blood resulted in low tumor-to-blood ratios, even at 30–48 hours after injection (2.3 ± 0.9, 1.8 ± 0.1, and 1.3 ± 0.4, respectively). In addition, liver uptake was modestly high (12 ± 2, 15 ± 3, and 12 ± 3, respectively). Copper 64–DOTA-panitumumab achieved similar results (11). A single photon emission computed tomographic (SPECT) study with technetium 99m–labeled camelidae variable domain nanobodies achieved 4.6% ID/g ± 0.2 in the tumor at 1 hour after injection with a 25 ± 4 tumor-to-muscle ratio; however, renal uptake was 63% ID/g ± 2 (7). Another nanobody achieved 5.2% ID/g ± 0.5 in the tumor, but at a later time point (3 hours) and with reduced specificity (7.4 ± 1.0 tumor-to-muscle ratio and 2.3 ± 0.5 tumor-to-blood ratio) (8).
Two indium 111 (111In)–labeled affibodies yielded 3.8% ID/g ± 1.4 and 3.2% ID/g ± 0.4 in the tumor at 4 hours after injection with 9 ± 3 and 4.8 ± 1.2 tumor-to-blood ratios, respectively; however, kidney signal was 86% ID/g ± 14 and 197% ID/g ± 10, and liver signal was 17% ID/g ± 2 and 6.4% ID/g ± 0.3 (2,3). Recently, a 64Cu-DOTA–conjugated affibody achieved higher tumor uptake (12% ID/g ± 2 at 4 hours), but high blood signal yielded a 1.0 tumor-to-blood ratio (1). Coadministration of 50 mg of cold affibody elevated the tumor signal to 17% ID/g ± 4 and the tumor-to-blood ratio to 9.9 ± 3.0 at 4 hours, although kidney and liver uptake were 207% ID/g ± 101 and 13% ID/g ± 2%, respectively. Other approaches included carbon 11–labeled small molecule tyrosine kinase inhibitors (27–29) and 111In-labeled epidermal growth factor (30), which yielded reasonable tumor uptake but were accompanied by concerns about antagonism and agonism, respectively.
Only semiquantitative comparisons are valid between this multitude of experiments because of the use of different cell lines and mouse models. Nevertheless, the current probe, 64Cu-FnEI3.4.39, provided higher tumor-to-blood ratios (8.9 ± 4.7) and faster imaging (#1 hour) than full antibodies at the expense of reduced but reasonable tumor uptake (3.4% ID/g ± 1.0). Copper 64–FnEI3.4.39 offers a PET alternative to the nanobody and affibody SPECT probes, all of which are characterized by strong tumor-to-background ratios, rapid imaging, and reasonable tumor uptake, but with the same disadvantage of high renal uptake. Relative to the affibody PET probe, the fibronectin domain exhibited superior tumor-to-blood ratio at 1 hour (8.9 ± 4.7 for 64Cu-FnEI3.4.39, 1.2 ± 1.1 for affibody).
The high renal uptake and retention is the primary disadvantage of 64Cu-FnEI3.4.39 as a molecular imaging probe. While this off-target signal is not clinically limiting from an imaging perspective for nonrenal tumors (predicted human renal dose of 2.1 mGy/MBq would enable 52 doses at 185 MBq prior to reaching a 20-Gy maximum tolerated dose [34]), renal activity may limit scan dosage or repetition in some applications. Yet, strategies exist for reduction of renal signal. Although anionization of two surface arginines was ineffective, further exploration of charge dependence is underway. Alternative radiochemical labeling, including fluorine 18 (18F), is being tested given that previous small protein scaffolds have vastly reduced renal uptake on removal of acidic chelators. The renal signal at 1 hour after injection for monomeric and dimeric affibody ZHER2:477 decreased from 206% ID/g ± 22 and 114% ID/g ± 11, respectively, when labeled with 64Cu-DOTA (35) to only 19% ID/g ± 1 and 7% ID/g ± 1 when labeled with 18F-N-(4-fluorobenzylidene)oxime (36). Renal uptake at 4 hours after injection of affibody ZEGFR:1907 decreased from 88% ID/g ± 15 and 136% ID/g ± 11 for 64Cu-DOTA (1) and 111In-benzyl-diethylenetriamine pentaacetic acid (37), respectively, to 6% ID/g ± 1 for iodine 125–p-iodobenzoate (37). Renal uptake of affibody ZHER2:342 decreased from 172% ID/g ± 13 and 342% ID/g ± 22 at 4 hours after injection for 111In-DOTA (38) and 111In-benzyl-diethylenetriamine pentaacetic acid (39), respectively, to 3.2% ID/g ± 0.4 (at 6 hours) and 10% ID/g ± 3 (at 2 hours) by using iodine 124–p-iodobenzoate (40) and N-2-(4-18F-fluorobenzamido)ethylmaleimide (41). In fact, preliminary experiments with N-succinimidyl-4-18F-fluorobenzoate labeling of FnEI3.4.39 indicated a dramatic reduction in renal signal relative to the 64Cu-DOTA–labeled probe. In addition, pharmacologic measures, including administration of lysine, can reduce renal uptake (42). Further exploration of these avenues may bolster 64Cu-FnEI3.4.0.39 as a molecular imaging agent for EGFR, as well as further the case for the fibronectin domain as a scaffold for a generation of other molecular imaging agents.
The stability and rapid specific tumor targeting of 64Cu-FnEI3.4.0.39 render it as a molecular imaging agent with potential for clinical translation for identification and localization of EGFR-overexpressing tumors. This work provides an initial validation of the fibronectin domain as a PET tracer, thereby setting the foundation for the use of the domain as a scaffold for the generation of molecular imaging agents.
Advances in Knowledge.
• A copper 64 (64Cu)–labeled fibronectin domain targeting epidermal growth factor receptor (EGFR) (64Cu-FnEI3.4.39) maintains stability in mouse and human serum for at least 24 hours and exhibits EGFR-dependent binding to cells in culture.
• Copper 64–FnEI3.4.39 exhibits good tumor localization (3.4% injected dose [ID]/g ± 1.0 at 1 hour), retention (2.7% ID/g ± 0.6 at 24 hours), and specificity (8.6 ± 3.0 tumor-to-muscle ratio, 8.9 ± 4.7 tumor-to-blood ratio at 1 hour) in EGFR-overexpressing xenografted tumors in mice.
• Copper 64–FnEI3.4.39 has molecular specificity as demonstrated by low tumor localization with either control tumors (with low EGFR expression) or control radiotracer (mutant without EGFR binding).
Implications for Patient Care.
• Copper 64–labeled EGFR-binding fibronectin domain EI3.4.39 exhibits potential for clinical translation for molecular imaging of EGFR.
• The fibronectin domain is a potential protein scaffold for a generation of molecular imaging agents.
Disclosures of Potential Conflicts of Interest: B.J.H. No potential conflicts of interest to disclose. R.H.K. No potential conflicts of interest to disclose. S.S.G. Financial activities related to the present article: none to disclose. Financial activities not related to the present article: author is board member of Academy for Molecular Imaging, Asan Medical Center, Endra, Enlight, General Electric, ImaginAb, Lumen Therapeutics, MagArray, Memorial Sloan Kettering Cancer Center, MiLabs, RefleXion Medical, Varian Medical, VisualSonics/Sonosite; author is consultant for Nine-Point Medical and Spectrum Dynamics; institution has grants from Bayer Schering, Doris Duke Distinguished Clinical, General Electric, and Schering-Plough Biopharma; author lectures for Asan Medical Center, Bayer Schering, Bracco Diagnostics, CPRIT, ImaginAb, Novartis, Schering-Plough Biopharma, SNM, Society for Pediatric Radiology, and UAB; author receives royalties from Elsevier; author has stock in Cellsight, Endra, Enlight, ImaginAb, MagArray, Nine-Point Medical, Prolume, RefleXion Medical, and Spectrum Dynamics. Other relationships: none to disclose.
Supplementary Material
Acknowledgments
Assistance from Carsten Nielsen, MSc, (PET/CT), Mark Stolowitz, PhD, and Ken Lau (Canary Center at Stanford Proteomics Core Facility), and Tim Doyle, PhD, (Stanford Small Animal Imaging Facility) is appreciated.
Received July 18, 2011; revision requested September 7; revision received November 14; final version accepted November 20.
Supported by the Canary Foundation. B.J.H. supported by an American Cancer Society Postdoctoral Fellowship.
Funding: This research was supported by the National Institutes of Health (grants CA119367, CA136465, and CA083636).
Abbreviations:
- DOTA
- tetraazacyclododecane tetraacetic acid
- EGFR
- epidermal growth factor receptor
- ID
- injected dose
- PBS
- phosphate-buffered saline
References
- 1.Miao Z, Ren G, Liu H, Jiang L, Cheng Z. Small-animal PET imaging of human epidermal growth factor receptor positive tumor with a 64Cu labeled affibody protein. Bioconjug Chem 2010;21(5):947–954 [DOI] [PubMed] [Google Scholar]
- 2.Nordberg E, Orlova A, Friedman M, et al. In vivo and in vitro uptake of 111In, delivered with the affibody molecule (ZEGFR:955)2, in EGFR expressing tumour cells. Oncol Rep 2008;19(4):853–857 [DOI] [PubMed] [Google Scholar]
- 3.Tolmachev V, Rosik D, Wållberg H, et al. Imaging of EGFR expression in murine xenografts using site-specifically labelled anti-EGFR 111In-DOTA-Z EGFR:2377 affibody molecule: aspect of the injected tracer amount. Eur J Nucl Med Mol Imaging 2010;37(3):613–622 [DOI] [PubMed] [Google Scholar]
- 4.Zahnd C, Kawe M, Stumpp MT, et al. Efficient tumor targeting with high-affinity designed ankyrin repeat proteins: effects of affinity and molecular size. Cancer Res 2010;70(4):1595–1605 [DOI] [PubMed] [Google Scholar]
- 5.Jiang L, Kimura RH, Miao Z, et al. Evaluation of a (64)Cu-labeled cystine-knot peptide based on agouti-related protein for PET of tumors expressing alphavbeta3 integrin. J Nucl Med 2010;51(2):251–258 [DOI] [PMC free article] [PubMed] [Google Scholar]
- 6.Kimura RH, Cheng Z, Gambhir SS, Cochran JR. Engineered knottin peptides: a new class of agents for imaging integrin expression in living subjects. Cancer Res 2009; 69(6):2435–2442 [DOI] [PMC free article] [PubMed] [Google Scholar]
- 7.Gainkam LOT, Huang L, Caveliers V, et al. Comparison of the biodistribution and tumor targeting of two 99mTc-labeled anti-EGFR nanobodies in mice, using pinhole SPECT/micro-CT. J Nucl Med 2008;49(5):788–795 [DOI] [PubMed] [Google Scholar]
- 8.Huang L, Gainkam LO, Caveliers V, et al. SPECT imaging with 99mTc-labeled EGFR-specific nanobody for in vivo monitoring of EGFR expression. Mol Imaging Biol 2008;10(3):167–175 [DOI] [PubMed] [Google Scholar]
- 9.Chen X, Hou Y, Tohme M, et al. Pegylated arg-gly-asp peptide: 64Cu labeling and PET imaging of brain tumor alphavbeta3-integrin expression. J Nucl Med 2004;45(10):1776–1783 [PubMed] [Google Scholar]
- 10.Cai W, Chen K, He L, Cao Q, Koong A, Chen X. Quantitative PET of EGFR expression in xenograft-bearing mice using 64Cu-labeled cetuximab, a chimeric anti-EGFR monoclonal antibody. Eur J Nucl Med Mol Imaging 2007;34(6):850–858 [DOI] [PubMed] [Google Scholar]
- 11.Niu G, Li Z, Xie J, Le Q-T, Chen X. PET of EGFR antibody distribution in head and neck squamous cell carcinoma models. J Nucl Med 2009;50(7):1116–1123 [DOI] [PMC free article] [PubMed] [Google Scholar]
- 12.Niu G, Sun X, Cao Q, et al. Cetuximab-based immunotherapy and radioimmunotherapy of head and neck squamous cell carcinoma. Clin Cancer Res 2010;16(7):2095–2105 [DOI] [PMC free article] [PubMed] [Google Scholar]
- 13.Li WP, Meyer LA, Capretto DA, Sherman CD, Anderson CJ. Receptor-binding, biodistribution, and metabolism studies of 64Cu-DOTA-cetuximab, a PET-imaging agent for epidermal growth-factor receptor-positive tumors. Cancer Biother Radiopharm 2008;23(2):158–171 [DOI] [PubMed] [Google Scholar]
- 14.Sundaresan G, Yazaki PJ, Shively JE, et al. 124I-labeled engineered anti-CEA minibodies and diabodies allow high-contrast, antigen-specific small-animal PET imaging of xenografts in athymic mice. J Nucl Med 2003;44(12):1962–1969 [PMC free article] [PubMed] [Google Scholar]
- 15.Yuan F, Dellian M, Fukumura D, et al. Vascular permeability in a human tumor xenograft: molecular size dependence and cutoff size. Cancer Res 1995;55(17):3752–3756 [PubMed] [Google Scholar]
- 16.Schmidt MM, Wittrup KD. A modeling analysis of the effects of molecular size and binding affinity on tumor targeting. Mol Cancer Ther 2009;8(10):2861–2871 [DOI] [PMC free article] [PubMed] [Google Scholar]
- 17.Hackel BJ, Ackerman ME, Howland SW, Wittrup KD. Stability and CDR composition biases enrich binder functionality landscapes. J Mol Biol 2010;401(1):84–96 [DOI] [PMC free article] [PubMed] [Google Scholar]
- 18.Koide A, Koide S. Monobodies: antibody mimics based on the scaffold of the fibronectin type III domain. Methods Mol Biol 2007;352:95–109 [DOI] [PubMed] [Google Scholar]
- 19.Lipovsek D. Adnectins: engineered target-binding protein therapeutics. Protein Eng Des Sel 2011;24(1-2):3–9 [DOI] [PMC free article] [PubMed] [Google Scholar]
- 20.Shinojima N, Tada K, Shiraishi S, et al. Prognostic value of epidermal growth factor receptor in patients with glioblastoma multiforme. Cancer Res 2003;63(20):6962–6970 [PubMed] [Google Scholar]
- 21.Nieto Y, Nawaz F, Jones RB, Shpall EJ, Nawaz S. Prognostic significance of overexpression and phosphorylation of epidermal growth factor receptor (EGFR) and the presence of truncated EGFRvIII in locoregionally advanced breast cancer. J Clin Oncol 2007;25(28):4405–4413 [DOI] [PubMed] [Google Scholar]
- 22.Zlobec I, Vuong T, Hayashi S, et al. A simple and reproducible scoring system for EGFR in colorectal cancer: application to prognosis and prediction of response to preoperative brachytherapy. Br J Cancer 2007; 96(5):793–800 [DOI] [PMC free article] [PubMed] [Google Scholar]
- 23.Galizia G, Lieto E, Orditura M, et al. Epidermal growth factor receptor (EGFR) expression is associated with a worse prognosis in gastric cancer patients undergoing curative surgery. World J Surg 2007;31(7):1458–1468 [DOI] [PubMed] [Google Scholar]
- 24.Parra HS, Cavina R, Latteri F, et al. Analysis of epidermal growth factor receptor expression as a predictive factor for response to gefitinib (‘Iressa’, ZD1839) in non-small-cell lung cancer. Br J Cancer 2004;91(2):208–212 [DOI] [PMC free article] [PubMed] [Google Scholar]
- 25.Schlomm T, Kirstein P, Iwers L, et al. Clinical significance of epidermal growth factor receptor protein overexpression and gene copy number gains in prostate cancer. Clin Cancer Res 2007;13(22 pt 1):6579–6584 [DOI] [PubMed] [Google Scholar]
- 26.Nicholson RI, Gee JM, Harper ME. EGFR and cancer prognosis. Eur J Cancer 2001; 37(suppl 4):S9–S15 [DOI] [PubMed] [Google Scholar]
- 27.Memon AA, Jakobsen S, Dagnaes-Hansen F, Sorensen BS, Keiding S, Nexo E. Positron emission tomography (PET) imaging with [11C]-labeled erlotinib: a micro-PET study on mice with lung tumor xenografts. Cancer Res 2009;69(3):873–878 [DOI] [PubMed] [Google Scholar]
- 28.Zhang MR, Kumata K, Hatori A, et al. [11C]Gefitinib ([11c]Iressa): radiosynthesis, in vitro uptake, and in vivo imaging of intact murine fibrosarcoma. Mol Imaging Biol 2010;12(2):181–191 [DOI] [PubMed] [Google Scholar]
- 29.Wang H, Yu J, Yang G, et al. Assessment of 11C-labeled-4-N-(3-bromoanilino)-6,7-dimethoxyquinazoline as a positron emission tomography agent to monitor epidermal growth factor receptor expression. Cancer Sci 2007;98(9):1413–1416 [DOI] [PMC free article] [PubMed] [Google Scholar]
- 30.Kareem H, Sandström K, Elia R, et al. Blocking EGFR in the liver improves the tumor-to-liver uptake ratio of radiolabeled EGF. Tumour Biol 2010;31(2):79–87 [DOI] [PubMed] [Google Scholar]
- 31.Loening AM, Gambhir SS. AMIDE: a free software tool for multimodality medical image analysis. Mol Imaging 2003;2(3): 131–137 [DOI] [PubMed] [Google Scholar]
- 32.Antunes P, Ginj M, Walter MA, Chen J, Reubi J-C, Maecke HR. Influence of different spacers on the biological profile of a DOTA-somatostatin analogue. Bioconjug Chem 2007;18(1):84–92 [DOI] [PubMed] [Google Scholar]
- 33.García Garayoa E, Schweinsberg C, Maes V, et al. Influence of the molecular charge on the biodistribution of bombesin analogues labeled with the [99mTc(CO)3]-core. Bioconjug Chem 2008;19(12):2409–2416 [DOI] [PubMed] [Google Scholar]
- 34.Cassady JR. Clinical radiation nephropathy. Int J Radiat Oncol Biol Phys 1995; 31(5):1249–1256 [DOI] [PubMed] [Google Scholar]
- 35.Cheng Z, De Jesus OP, Kramer DJ, et al. 64Cu-labeled affibody molecules for imaging of HER2 expressing tumors. Mol Imaging Biol 2010;12(3):316–324 [DOI] [PMC free article] [PubMed] [Google Scholar]
- 36.Cheng Z, De Jesus OP, Namavari M, et al. Small-animal PET imaging of human epidermal growth factor receptor type 2 expression with site-specific 18F-labeled protein scaffold molecules. J Nucl Med 2008;49(5):804–813 [DOI] [PMC free article] [PubMed] [Google Scholar]
- 37.Tolmachev V, Friedman M, Sandström M, et al. Affibody molecules for epidermal growth factor receptor targeting in vivo: aspects of dimerization and labeling chemistry. J Nucl Med 2009;50(2):274–283 [DOI] [PubMed] [Google Scholar]
- 38.Ahlgren S, Orlova A, Rosik D, et al. Evaluation of maleimide derivative of DOTA for site-specific labeling of recombinant affibody molecules. Bioconjug Chem 2008;19(1):235–243 [DOI] [PubMed] [Google Scholar]
- 39.Tolmachev V, Nilsson FY, Widström C, et al. 111In-benzyl-DTPA-ZHER2:342, an affibody-based conjugate for in vivo imaging of HER2 expression in malignant tumors. J Nucl Med 2006;47(5):846–853 [PubMed] [Google Scholar]
- 40.Orlova A, Wållberg H, Stone-Elander S, Tolmachev V. On the selection of a tracer for PET imaging of HER2-expressing tumors: direct comparison of a 124I-labeled affibody molecule and trastuzumab in a murine xeno graft model. J Nucl Med 2009;50(3):417–425 [DOI] [PubMed] [Google Scholar]
- 41.Kramer-Marek G, Kiesewetter DO, Capala J. Changes in HER2 expression in breast cancer xenografts after therapy can be quantified using PET and (18)F-labeled affibody molecules. J Nucl Med 2009;50(7):1131–1139 [DOI] [PMC free article] [PubMed] [Google Scholar]
- 42.Behr TM, Sharkey RM, Juweid ME, et al. Reduction of the renal uptake of radiolabeled monoclonal antibody fragments by cationic amino acids and their derivatives. Cancer Res 1995;55(17):3825–3834 [PubMed] [Google Scholar]
Associated Data
This section collects any data citations, data availability statements, or supplementary materials included in this article.


