We found that CT attenuation values had a significant linear correlation with the amount of soft tissue within the nonsolid nodule, such that for each 100-HU increase in attenuation the proportion of tumor increased by approximately 10%.
Abstract
Purpose:
To determine whether computed tomographic (CT) attenuation values correlate with the histologic measurements of a lung cancer manifesting as a nonsolid nodule and to quantify the extent to which the tumor replaces the airspace within the nodule.
Materials and Methods:
Informed consent was obtained to analyze images from CT and pathologic examination under an institutional review board–approved protocol. Fifteen patients who had undergone resection of nonsolid lung cancer were evaluated. On the basis of the CT attenuation values of nonsolid nodules, nonneoplastic lung, soft tissue, and air, the overall proportion of soft tissue in the nodule and nonneoplastic lung and the difference between these two measures were calculated. The analogous measures were obtained from a representative digitized histologic slide. The area of each nodule and the proportion of air within it were measured, and the proportion of soft tissue in the nodule and nonneoplastic lung and the difference between the two were calculated. The difference between the two proportions at CT and histologic examination are the proportions attributable to the cancer on the basis of CT and histologic examinations, respectively. Linear regression was performed to assess the relationship between these measures.
Results:
The average proportions of soft tissue in the nodule at CT and histologic examination were 48% and 69%, respectively, and they showed significant correlation with each other (P = .02); in addition, each showed significant correlation with the attenuation of the nodule (P < .0001 and P = .02, respectively). The difference between the proportions of soft tissue in nodule and nonneoplastic lung at CT and histologic examination were 37% and 30%, respectively, and both were independent of the tumor diameter (P = .26 and P = .41).
Conclusion:
The proportion of soft tissue within a nonsolid nodule is correlated with attenuation at CT. This allows for measurement of change within the nodule. An increase of 100 HU in nodule attenuation represents an approximately 10% increase in tumor volume.
© RSNA, 2012
Supplemental materialhttp://radiology.rsna.org/lookup/suppl/doi:10.1148/radiol.11101372/-/DC1
Introduction
Lung cancers manifesting as nonsolid nodules on computed tomographic (CT) scans, unlike those manifesting as solid nodules, contain partially aerated alveoli. As the tumor progresses, the aerated spaces are eventually replaced and compressed by tumor, as has been elegantly described by Noguchi and others (1,2). Even with modern CT scanning in the clinical setting, we still do not have sufficient resolution to identify these anatomic components. However, on the basis of our understanding of the attenuation of soft tissue and air along with principles of volume averaging, it is possible to estimate the proportion of the partially aerated nonsolid nodule that is soft tissue.
Unlike solid nodules, nonsolid malignant nodules can grow when tumor replaces the air-containing alveoli (1,3). Initially, the tumor cells proliferate along the surface of the alveoli without invading the lung parenchyma; subsequently, as they increase in number and the alveolar walls thicken, the air within the alveoli is replaced by cells and the nodule becomes more solid appearing, both on histologic and CT images. Given this pattern of progression, an increase in nodule attenuation should be a useful measure of tumor growth; in particular, this internal growth can be integrated with an overall change in size to provide a more complete measure of tumor volume doubling time.
In Appendix E1 (online), we clarify the theoretic relationship between CT attenuation and the proportion of tumor within a nonsolid nodule to measure internal nodule growth at repeat imaging on the basis of a change in attenuation. We also describe the relationship between soft tissue and air seen on histologic slices. We performed this study to determine whether CT attenuation values correlate with the histologic measurements of a lung cancer manifesting as a nonsolid nodule and to quantify the extent to which the tumor replaces the airspace within the nodule.
Materials and Methods
Selection of Cases
Informed consent was obtained to analyze CT and pathologic images under an institutional review board–approved protocol at Weill Cornell Medical College, New York, NY. Among the 29 patients who underwent resection of lung cancer that manifested as a nonsolid nodule at CT, 15 had pathologic specimens that included a representative part of the tumor and some nonneoplastic tissue in a single histologic slide for the image analysis without a substantial amount of staining artifacts. In all but three patients, CT was performed with a section thickness of 1.25 mm or less; none of the patients received intravenous contrast material. The median time between CT and surgery was 2.9 months (interquartile range, 1.8–4.0 months). All scans were obtained with a Light Speed Ultra or Light Speed QX/I unit (GE Medical Systems, Milwaukee, Wis). Fourteen of the 15 patients had mixed subtype adenocarcinoma (minimally invasive), and one patient had bronchioloalveolar subtype adenocarcinoma (new classification of adenocarcinoma in situ) (4–7). Noninvasive and minimally invasive adenocarcinomas typically manifest as nonsolid nodules and are indistinguishable from each other radiologically (7).
Assessment of CT Scans
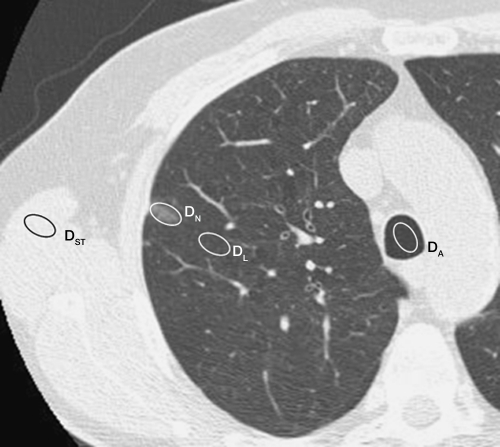
For each case, the representative CT scan was displayed at a window width of 1500 HU and window level of 2650 HU. All scans were obtained with low-dose techniques (120 kVp, 20–40 mAs). Nodule size was measured by using an electronic ruler on the workstation and recorded as the average of the maximal length and the width perpendicular to it. For each case, the average CT attenuation (in Hounsfield units) was determined for the lung cancer by placing an adjustable elliptical region of interest (ROI) (placed by L.Z., with 8 years of experience, and confirmed by D.Y., with more than 25 years of experience) totally within the cancerous nodule so as to include its maximal area while also checking that the ROI was entirely contained within the nodule on adjacent sections above and below (Fig 1). Therefore, the maximal diameter of the ellipse was smaller than the maximal diameter of the nodule. If a large blood vessel was present, the ROI was placed so it did not include the blood vessel. Attenuation was also measured in nonneoplastic lung that had a normal appearance but was close to the lung cancer, and the area of this ROI for measurement purposes was chosen to be close to that used for measuring the attenuation of the lung cancer itself. In addition, CT attenuation was measured for air (measured in the largest proximal airway on the same CT image, usually the trachea) and muscle, with the latter being representative of soft tissue.
Figure 1:
Assessment of CT scans. For each nonsolid nodule, a representative scan was used and attenuation (in Hounsfield units) was obtained for four ROIs. For this 12-mm-diameter nodule (nodule 3), attenuation was 2504 HU within nonsolid nodule (DN), 2978 for air in trachea (DA), 2905 HU for nonneoplastic lung (DL), and 58 HU for muscle (DST).
With use of these empirically determined values, we determined the proportions of soft tissue in the lung cancer manifesting as a nonsolid nodule and in nonneoplastic lung and calculated the difference between the two values (Table 1). Equations are described in Appendix E1 (online). The average CT attenuation value (6standard deviation) was 2476 HU ± 74.9 for nodules, 2862 HU ± 28.3 for nonneoplastic lung, 58 HU ± 6.4 for soft tissue, and 2977 HU ± 16.1 for air.
Table 1.
CT Measurements of Attenuation and Proportion of Soft Tissue
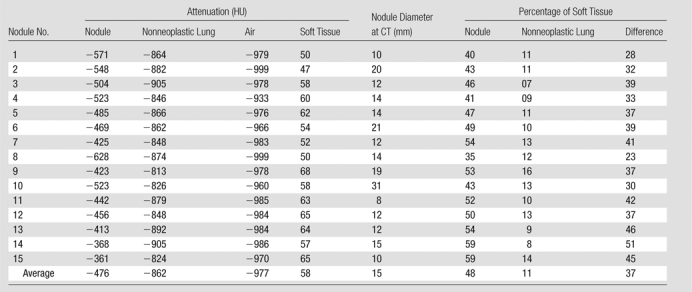
Note.—All but nodule 4 are adenocarcinomas, mixed subtype; nodule 4 is an adenocarcinoma, bronchioloalveolar nonmucinous subtype. Minor variations in percentage calculations are due to rounding effect.
Histologic Assessment
For each case, a representative histologic slide (chosen by L.Z. and confirmed by D.C., with more than 30 years of experience) stained with hematoxylin-eosin, and containing the largest cross section or representative part of the tumor, was digitized by using commercial software (ImagePro Plus; Media Cybernetics, Silver Spring, Md) and a digital camera (Eclipse E400; Nikon, Melville, NY). With use of software, the tumor border was manually drawn (by L.Z. and confirmed by D.C.) and the total area of the tumor (Fig 2a) automatically calculated by the software. Within the tumor, the area occupied by air was also automatically segmented and calculated (Fig 2b).
Figure 2a:
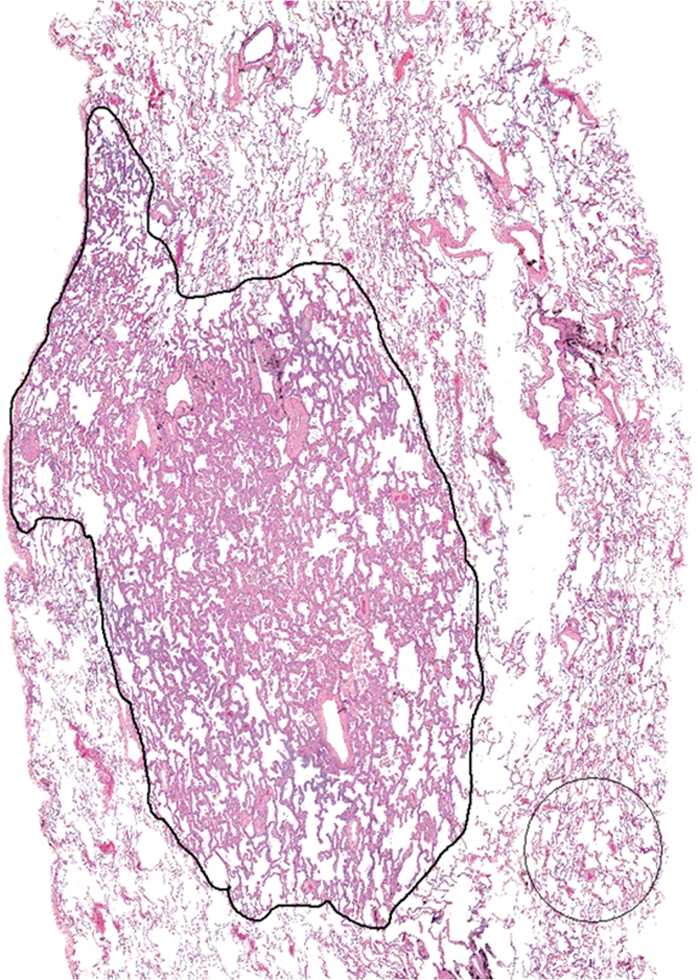
(a) Digitized image of histologic slide from nodule 3. Tumor border was manually defined as well as a preset ROI over a representative part of nonneoplastic lung tissue (shown for illustrative purposes). (Hematoxylin-eosin stain; original magnification, 340.) (b, c) Automated segmentation was performed to determine areas of air-filled spaces in (b) tumor and (c) nonneoplastic lung..
Figure 2b:
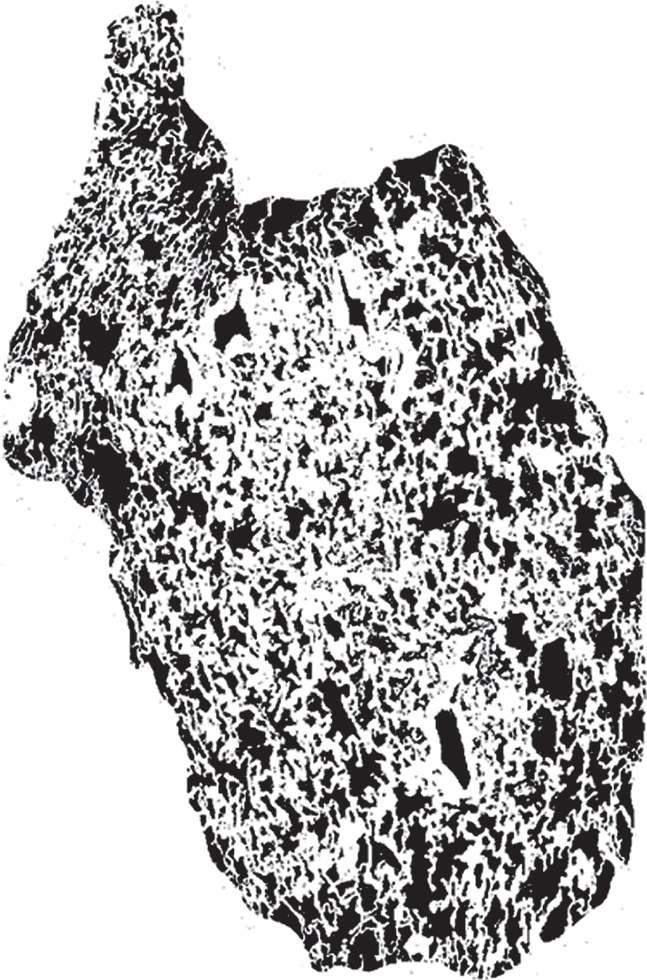
(a) Digitized image of histologic slide from nodule 3. Tumor border was manually defined as well as a preset ROI over a representative part of nonneoplastic lung tissue (shown for illustrative purposes). (Hematoxylin-eosin stain; original magnification, 340.) (b, c) Automated segmentation was performed to determine areas of air-filled spaces in (b) tumor and (c) nonneoplastic lung..
Figure 2c:
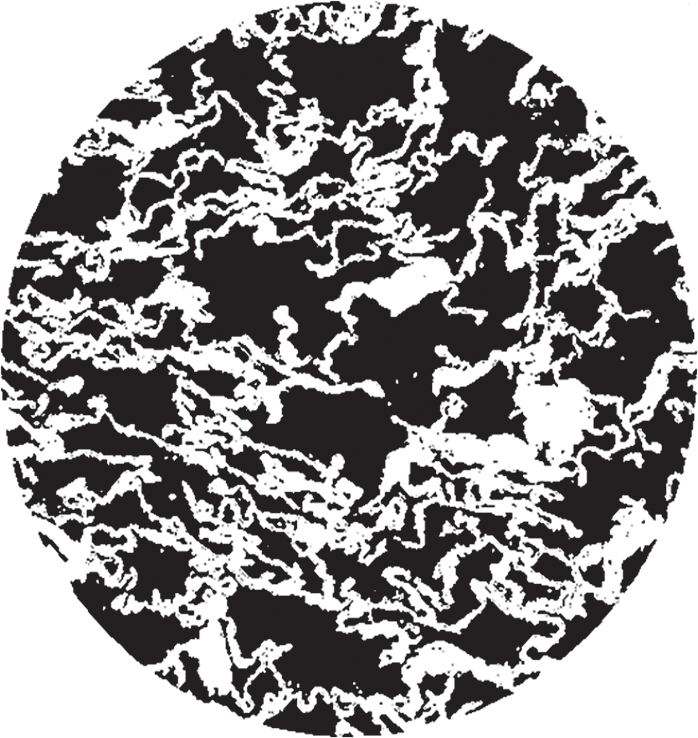
(a) Digitized image of histologic slide from nodule 3. Tumor border was manually defined as well as a preset ROI over a representative part of nonneoplastic lung tissue (shown for illustrative purposes). (Hematoxylin-eosin stain; original magnification, 340.) (b, c) Automated segmentation was performed to determine areas of air-filled spaces in (b) tumor and (c) nonneoplastic lung..
Using these values, and following the same steps described in Appendix E1 (online), which are analogous to those used for CT images, we calculated the proportion of soft tissue within the tumor, the proportion of soft tissue within the nonneoplastic lung, and the difference between these two values. On the basis of histologic specimens, the tumor area, area of air in the nodule, area of the nonneoplastic lung, and area of air in the nonneoplastic lung are given for each nodule in pixel counts in Table 2]. The cases are in the same order as in Table 1, and the proportions of soft tissue in the nodule and nonneoplastic lung were calculated (Table 2).
Table 2.
Histologic Measurements of Area and Proportion of Soft Tissue
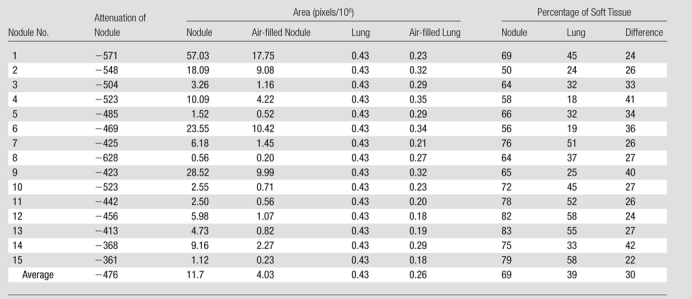
Note.—Percentages of soft tissue are derived measures and are based on area measurements. All but nodule 4 are adenocarcinomas, mixed subtype; nodule 4 is an adenocarcinoma, bronchioloalveolar nonmucinous subtype. Minor variations in percentage calculations are due to rounding effect.Figure 3
Linear regression analysis was performed with SPSS (version 13.0; SPSS, Chicago, Ill) to assess the relationship between the histologic and CT measures. The Student t test was used to compare the differences between the radiologic and histologic measures.
Results
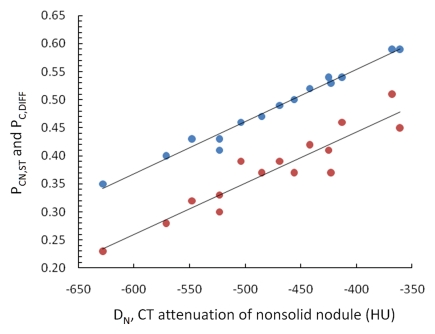
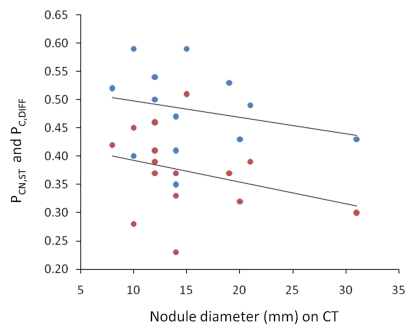
On the basis of the CT attenuation values in Table 1, the average proportion of soft tissue in each nodule was 48% (range, 35%–59%). The average proportion of soft tissue in the nonneoplastic lung parenchyma was 11% (range, 7%–16%). The average difference between these two values was 37% (range, 23%–51%). Figure 3a shows that both the proportion of soft tissue in the nodule at CT and the difference between the proportions of soft tissue in the nodule and nonneoplastic lung have a significant linear relationship with nodule attenuation (P < .0001 and P < .0001, respectively). Neither of these measures showed a significant relationship (P = .39 and P = .26, respectively) with tumor diameter (Fig 3b).
Figure 3a:
(a) Graph shows that the proportion of soft tissue in each nodule at CT (PCN,ST, blue dots) (R2 = 0.98, P , .0001) and the difference in the proportion of soft tissue in nonsolid nodules and nonneoplastic lung at CT (PC,DIFF, red dots) (R2 = 0.87, P , .0001) have a significant linear relationship with nodule attenuation (DN). The proportion of soft tissue increases with increasing attenuation. (b) Graph shows that both of these CT measures were independent of tumor diameter (R2 = 0.058, P = .39 and R2 = 0.10, P = .26, respectively).
Figure 3b:
(a) Graph shows that the proportion of soft tissue in each nodule at CT (PCN,ST, blue dots) (R2 = 0.98, P , .0001) and the difference in the proportion of soft tissue in nonsolid nodules and nonneoplastic lung at CT (PC,DIFF, red dots) (R2 = 0.87, P , .0001) have a significant linear relationship with nodule attenuation (DN). The proportion of soft tissue increases with increasing attenuation. (b) Graph shows that both of these CT measures were independent of tumor diameter (R2 = 0.058, P = .39 and R2 = 0.10, P = .26, respectively).
On the basis of measurements of the histologic specimens (Table 2), the average percentage of soft tissue in the nodule was 69% (range, 50%–83%). The average proportion of soft tissue in nonneoplastic lung parenchyma was 39% (range, 18%–58%). The average difference between these two histologic measures was 30% (range, 22%–42%).
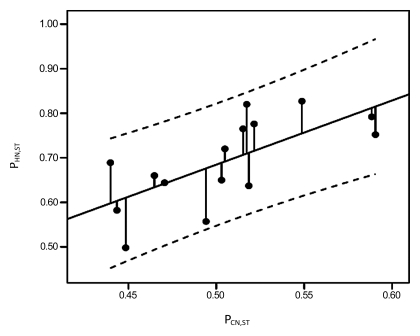
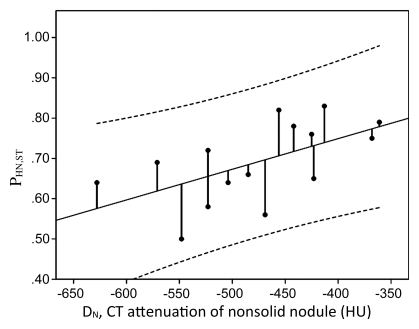
Although the estimated proportion of soft tissue was higher on average in the histologic specimens than on the CT scans, both in the nodule (69% vs 48%, respectively; P < .0001) and nonneoplastic lung (39% vs 11%, respectively; P < .0001), the difference between the histologic measurements in the nodule and nonneoplastic lung was lower than that for the CT measurements (30% vs 37%, respectively; P = .01). The proportion of soft tissue determined with histologic specimens showed a significant linear relationship with that determined at CT (Fig 4, P = .02) and with the attenuation of the nodule (Fig 5, P = .02). However, the proportion of soft tissue in the nonneoplastic lung determined with histologic specimens (P = .24) and the difference between the proportion of soft tissue in the nodule and nonneoplastic lung as determined with histologic examination (P = .56) did not show a significant relationship with either the attenuation of the nodule or the nodule diameter (P = .41).
Figure 4:
Graph obtained with linear regression analysis shows a significant linear relationship between proportion of soft tissue in nodule at histologic examination (PHN,ST) and at CT (PCN,ST) (R2 = 0.35, P = .02). Dashed lines are 95% confidence intervals.
Figure 5:
Graph obtained with linear regression analysis shows a significant linear relationship between proportion of soft tissue in nodule at histologic examination (PHN,ST) and nodule attenuation (DN) (R2 = 0.34, P = .02). The proportion of soft tissue in nodule at histologic examination increased with increasing attenuation. Dashed lines are 95% confidence intervals.
Discussion
The evaluation of nonsolid nodules is emerging as an important topic in lung cancer management because they are being found with increasing frequency, largely due to continued improvements in CT scanner technology. These nodules may be malignant (1,8) and, even though malignant, a substantial proportion of them may be sufficiently slow growing that, under appropriate clinical circumstances, they merit careful consideration for follow-up rather than immediate surgical treatment (2,9,10). In a recent systematic review, it was recognized that there is still much uncertainty regarding the natural course of these nodules and that the optimal frequency and follow-up for these lesions have yet to be defined (7). In another review, it was suggested that resection should be performed for nonsolid nodules larger than 10 mm that demonstrate either persistence or growth (11,12).
Although methods for assessing the growth of nonsolid nodules are still evolving, it is generally recognized that an overall increase in size and the development of a solid component within the nodule are highly suspicious for tumor progression. A recent analysis of different methods for evaluating nonsolid tumors found that measurement of the overall mass was the best indicator of growth (13).
We developed a mathematical approach to determine the proportion of soft tissue representing tumor within the nonsolid nodule based on consideration of volume averaging effects (Appendix E1, online). The approach follows the same principles that have been previously used to estimate the calcium composition of nodules and quantify air and water in acute respiratory distress syndrome (14–17). We found that the proportion of soft tissue in the nonsolid nodule and nonneoplastic lung had a linear relationship and thus were directly proportional to the attenuation of the nodule, as was the difference between the two. This reflects the increase in soft tissue relative to the background lung tissue caused by the tumor itself. We applied the methodology to this study and showed that CT measurement of the soft tissue within the nonsolid nodule had a significant linear relationship with both the attenuation of the nodule and the histologic measurement. We also showed that both are independent of tumor size. Thus, an increase in the attenuation of the nonsolid nodule represents an increase in the proportion of soft tissue within the nonsolid nodule, even when the nodule diameter does not change. Therefore, estimation of tumor volume doubling time requires determination of both the increase in the soft tissue within the tumor and the increase in the overall size of the tumor.
The measures of the proportion of soft tissue within the nonsolid nodule as determined from the histologic specimen were higher than those determined with CT (69% vs 48%, respectively)—and this was true for every case. Moreover, this was also true for the proportion of soft tissue within the nonneoplastic lung (39% vs 11%, respectively). We believe this finding can be explained by the difference in the degree of inflation of the lung in the histologic specimen as compared with the CT scans. The lung specimen is obtained from the deflated lung at the time of resection, and the specimen is not reinflated before being fixed for pathologic evaluation; it may even be further deflated. The CT scans, conversely, are obtained with full and deep inspiration. Therefore, it is to be expected that there is consistently less air, and thus a higher proportion of soft tissue, in the at histologic specimens than on the CT scans. Because the plane of section of the histologic specimen may not be aligned with the CT scan, we did not compare their relative sizes.
When considering the proportion of soft tissue in the nodule compared with surrounding nonneoplastic lung on the basis of histologic and CT measures, the estimates were much closer (30% vs 37%, respectively). The lower value of 30% for the histologic estimate is probably due to the fact that in the histologic specimen the tumor has alveolar walls that are thickened and relatively stiff so that the tumor better retains the relative proportion of soft tissue and air than does the nonneoplastic lung. Thus, at histologic examination a higher proportion of soft tissue is subtracted for the nonneoplastic lung so that the average difference of measurements obtained at histologic examination (30%) is lower than that of measurements obtained at CT (37%). This explanation is further supported by the significant correlation (P = .02) between the proportion of soft tissue in the nodule based on histologic and CT measures and the lack of correlation (P = .24) between the two analogous measures for the nonneoplastic lung.
In estimating the proportion of the nonsolid nodule that is composed of tumor, consideration must be given as to whether all of the soft tissue actually represents tumor or whether the tumor is initially growing on a scaffold of lung stroma that is already present and, therefore, only represents the additional soft tissue. We could not find a conclusive answer to this question. Tumors manifesting as nonsolid nodules may initially have atypical cells lining the alveoli without thickening of the stroma. At this point, most of the soft tissue in the nodule is the existing lung parenchyma because the additional atypical cells add only a minimal amount of soft tissue. For example, when the attenuation of nonneoplastic lung is −800 HU, the attenuation of the nonsolid nodule must reach −600 HU before the proportion being contributed by the nonneoplastic lung parenchyma becomes less than 50%. As these atypical cells become increasingly neoplastic and increase in number and size, there is consequent thickening of the alveolar septa and infiltration of the stroma and it then becomes reasonable to consider that the entire volume of soft tissue is due to tumor. This distinction is important for estimating the doubling time of the nonsolid tumor. Say, for example, that a nonsolid nodule remains identical in size at two time points but its attenuation increases. Assume that the attenuation is 40 HU for soft tissue, −800 HU for non–tumor-containing lung, and −1000 HU for pure air and that the attenuation of nonsolid nodule measures −700 HU when first identified. In this case, the difference between tumor and non–tumor-containing lung parenchyma is approximately 10%. For tumor volume to double—that is, for it to be 20% of the nodule—the overall attenuation would have to increase from −700 to −600 HU. If we assume, instead, that all soft tissue within the nodule is tumor, the soft tissue component is approximately 30% when the nodule has an attenuation of 2700 HU; thus, for the tumor volume to double the nodule attenuation would need to increase to −400 HU.
Although both approaches can be argued on the basis of the underlying pathologic characteristics, we favor the latter approach for the following reasons. First, it requires a greater change in attenuation to declare that the tumor volume has doubled. Given that there is a certain amount of inherent error in these measurements, this would be more conservative. Second, it also allows for measurements to be made that are independent of the amount of emphysema as reflected by the attenuation of the nonneoplastic lung. This simplifies the determination and eliminates another source of potential measurement error. The same considerations can also be given to other disease entities that either increase or decrease lung parenchymal attenuation. Third, it will tend to minimize change due to differences in degree of inspiration between scans, another source of potential measurement error. The reason is that the nonneoplastic lung should change to a greater extent depending on the degree of inspiration, whereas the nonsolid tumor with its thickened stroma should be less sensitive. Use of the latter approach results in the realization that when the soft tissue component of the nonsolid nodule reaches 50% (when the nodule CT attenuation reaches −480 HU), the nodule can no longer double in volume solely by internal growth. At that point, for the tumor to double in volume there must be some increase in its overall dimension as well as in its attenuation. Computer analytic techniques have been developed that focus on the segmentation of nonsolid nodules in the lungs (18). This allows for more precise definition of the boundaries of the tumor itself, and this segmentation can potentially be combined with the estimate of internal growth for a more precise estimation of the overall growth rate (19). This combined approach should also provide important prognostic information (20).
A limitation in our approach is that there will likely be a great deal of heterogeneity in the distribution of soft tissue included in any measurement, which includes blood vessels, bronchial walls, and possibly other small solid components. However, the effect of such heterogeneity is minimized by measuring the change rather than considering absolute values at each time point because the bias will be in the same direction for both measurements. The same principal applies when considering how differences in soft tissue or air attenuation affect the estimate of soft tissue. Although these values may be slightly different from one patient to another, they should be the same for the same patient at two time points. Therefore, any potential bias in our estimates would be in the same direction and, when comparing the nodule at two time points, its effect would be minimized. A potential strength of this approach is that the nodules will typically be larger than the CT section thickness and, because the volume averaging effect accounting for the nonsolid appearance occurs at a level below the scanner resolution, the attenuation measurements should be relatively insensitive to changes in scanning parameters (eg, section thickness and pitch), enabling the comparison between scans even with some change in scanning parameters. In addition, because we can only have histologic information at a single time point, our approach relies on comparing CT images with histologic specimens for different patients. However, we would expect even better correlation to occur in the same patients. Another limitation of the study was that technical factors, such as those that are set by the user as well as those inherent to the machine itself, may have an influence on attenuation measurements. These types of technical considerations are known to affect other quantitative measures such as tumor volume (21). Accounting for all these factors is well beyond the scope of this article, but minimizing their influence should be possible by maintaining scan parameters as close as possible between scans just as is recommended for volumetric determinations. In particular, the use of intravenous contrast material would have a dramatic effect on CT attenuation measurements. Another limitation was the difference in the degree of inspiration between the histologic specimens and the CT scans, which principally affects the measurement of air in the nonneoplastic lung tissue at histologic examination (5). However, this mainly affected estimates of the soft tissue proportion in the nonneoplastic lung parenchyma; estimates of soft tissue in the tumor itself on the basis of CT and histologic measures showed significant correlation. Another limitation is that fluid and cells that might have been present within the alveolar spaces of the tumor when the CT scans were obtained would not have been accounted for in the histologic specimens because they would have been washed out by the formalin during the fixation process. This likely had a minimal effect on our results because the estimate of the amount of soft tissue within the tumor on the basis of histologic images was higher.
We found that CT attenuation had a significant linear correlation with the amount of soft tissue within the nonsolid nodule, such that for each 100-HU increase in attenuation the proportion of tumor increased by approximately 10%.
Advance in Knowledge.
• CT attenuation can be used to estimate the amount of soft tissue within a nonsolid nodule because there was a significant linear relationship with histologic findings (R2 = 0.35, P = .02), allowing for estimation of the internal tumor growth.
Implication for Patient Care.
• We provide an easy-to-use method of estimating the proportion of tumor within nonsolid lung nodules, which could allow for estimation of internal growth within a nonsolid nodule.
Disclosures of Potential Conflicts of Interest: L.Z. No potential conflicts of interest to disclose. D.F.Y. Financial activities related to the present article: none to disclose. Financial activities not related to the present article: institution has a grant or grant pending from AstraZeneca; is a named inventor on a number of patents and patent applications relating to the evaluation of diseases of the chest including measurement of nodules. Some of these patents, which are owned by Cornell Research Foundation, are nonexclusively licensed to General Electric. Other relationships: none to disclose. D.C. No potential conflicts of interest to disclose. C.I.H. Financial activities related to the present article: none to disclose. Financial activities not related to the present article: is a named inventor on a number of patents and patent applications relating to the evaluation of diseases of the chest, including measurement of nodules. Some of these patents, which are owned by Cornell Research Foundation, are nonexclusively licensed to General Electric. As of April 2009, C.I.H. has renounced all financial benefits related to these patents. Other relationships: none to disclose. R.Y. No potential conflicts of interest to disclose. A.P.R. Financial activities related to the present article: none to disclose. Financial activities not related to the present article: institution received money for grants or contracts from AstraZeneca, GlaxoSmithKline, and Carestream Health; received payment for lectures including service on speakers bureaus disclose; is a named inventor on a number of patents and patent applications relating to the evaluation of diseases of the chest including measurement of nodules. Some of these patents, which are owned by Cornell Research Foundation, are nonexclusively licensed to General Electric. Other relationships: is president of D4Vision.
Supplementary Material
Received July 21, 2010; revision requested September 21; revision received September 30, 2011; accepted October 14; final version accepted November 21.
Supported in part by the Flight Attendant Medical Research Institute.
Funding: This research was supported by the National Institutes of Health (grant RO1 CA78905).
Abbreviation:
- ROI
- region of interest
References
- 1.Noguchi M, Morikawa A, Kawasaki M, et al. Small adenocarcinoma of the lung: histologic characteristics and prognosis. Cancer 1995;75(12):2844–2852 [DOI] [PubMed] [Google Scholar]
- 2.Kurokawa T, Matsuno Y, Noguchi M, Mizuno S, Shimosato Y. Surgically curable “early” adenocarcinoma in the periphery of the lung. Am J Surg Pathol 1994;18(5):431–438 [DOI] [PubMed] [Google Scholar]
- 3.Nakajima R, Yokose T, Kakinuma R, Nagai K, Nishiwaki Y, Ochiai A. Localized pure ground-glass opacity on high-resolution CT: histologic characteristics. J Comput Assist Tomogr 2002;26(3):323–329 [DOI] [PubMed] [Google Scholar]
- 4.Vazquez M, Flieder D, Travis W, et al. Early lung cancer action project pathology protocol. Lung Cancer 2003;39(2):231–232 [DOI] [PubMed] [Google Scholar]
- 5.Vazquez MF, Flieder D, Travis W, et al. International early lung cancer action program: pathology protocol. http://ielcap.org/professionals/docs/pathology protocol.pdf. Accessed November 2, 2011 [DOI] [PubMed]
- 6.Vazquez M, Carter D, Brambilla E, et al. Solitary and multiple resected adenocarcinomas after CT screening for lung cancer: histopathologic features and their prognostic implications. Lung Cancer 2009;64(2):148–154 [DOI] [PMC free article] [PubMed] [Google Scholar]
- 7.Travis WD, Brambilla E, Noguchi M, et al. International association for the study of lung cancer/american thoracic society/european respiratory society international multidisciplinary classification of lung adenocarcinoma. J Thorac Oncol 2011;6(2):244–285 [DOI] [PMC free article] [PubMed] [Google Scholar]
- 8.Henschke CI, Yankelevitz DF, Mirtcheva R, et al. CT screening for lung cancer: frequency and significance of part-solid and nonsolid nodules. AJR Am J Roentgenol 2002;178(5):1053–1057 [DOI] [PubMed] [Google Scholar]
- 9.Kakinuma R, Ohmatsu H, Kaneko M, et al. Progression of focal pure ground-glass opacity detected by low-dose helical computed tomography screening for lung cancer. J Comput Assist Tomogr 2004;28(1):17–23 [DOI] [PubMed] [Google Scholar]
- 10.Kodama K, Higashiyama M, Yokouchi H, et al. Natural history of pure ground-glass opacity after long-term follow-up of more than 2 years. Ann Thorac Surg 2002;73(2):386–392, discussion 392–393 [DOI] [PubMed] [Google Scholar]
- 11.Godoy MCB, Naidich DP. Subsolid pulmonary nodules and the spectrum of peripheral adenocarcinomas of the lung: recommended interim guidelines for assessment and management. Radiology 2009;253(3):606–622 [DOI] [PubMed] [Google Scholar]
- 12.Naidich DP. Part-solid nodules: two steps forward. Radiology 2010;255(1):16–18 [DOI] [PubMed] [Google Scholar]
- 13.de Hoop B, Gietema H, van de Vorst S, Murphy K, van Klaveren RJ, Prokop M. Pulmonary ground-glass nodules: increase in mass as an early indicator of growth. Radiology 2010;255(1):199–206 [DOI] [PubMed] [Google Scholar]
- 14.Yankelevitz DF, Henschke CI. Derivation for relating calcification and size in small pulmonary nodules. Clin Imaging 1998;22(1):1–6 [DOI] [PubMed] [Google Scholar]
- 15.Mull RT. Mass estimates by computed tomography: physical density from CT numbers. AJR Am J Roentgenol 1984;143(5):1101–1104 [DOI] [PubMed] [Google Scholar]
- 16.Gattinoni L, Mascheroni D, Torresin A, et al. Morphological response to positive end expiratory pressure in acute respiratory failure: computerized tomography study. Intensive Care Med 1986;12(3):137–142 [DOI] [PubMed] [Google Scholar]
- 17.Zerhouni EA, Spivey JF, Morgan RH, Leo FP, Stitik FP, Siegelman SS. Factors influencing quantitative CT measurements of solitary pulmonary nodules. J Comput Assist Tomogr 1982;6(6):1075–1087 [DOI] [PubMed] [Google Scholar]
- 18.Browder WA, Reeves AP, Apananosovich TV, Cham MD, Yankelevitz DF, Henschke CI. Automated volumetric segmentation method for growth consistency of nonsolid pulmonary nodules in high-resolution CT. In: Giger ML, Karssemeijer N, eds. Proceedings of SPIE: medical imaging 2007—computer-aided dignosis. Vol 6514 Bellingham, Wash: The International Society for Optical Engineering, 2007; 65140Y1–10 [Google Scholar]
- 19.Kostis WJ, Yankelevitz DF, Reeves AP, Fluture SC, Henschke CI. Small pulmonary nodules: reproducibility of three-dimensional volumetric measurement and estimation of time to follow-up CT. Radiology 2004;231(2):446–452 [DOI] [PubMed] [Google Scholar]
- 20.Park JH, Lee KS, Kim JH, et al. Malignant pure pulmonary ground-glass opacity nodules: prognostic implications. Korean J Radiol 2009;10(1):12–20 [DOI] [PMC free article] [PubMed] [Google Scholar]
- 21.Gavrielides MA, Kinnard LM, Myers KJ, Petrick N. Noncalcified lung nodules: volumetric assessment with thoracic CT. Radiology 2009;251(1):26–37 [DOI] [PMC free article] [PubMed] [Google Scholar]
Associated Data
This section collects any data citations, data availability statements, or supplementary materials included in this article.


