For the breast phantom representing the “average” breast (5.0 cm thick, 50% glandular fraction), the mean glandular doses (MGDs) for the full-field digital mammography and digital breast tomosynthesis acquisitions were 1.20 and 1.30 mGy, respectively, resulting in a difference of only 8% between the two modalities; a fusion two-dimensional–three-dimensional imaging study resulted in an MGD of 2.50 mGy.
Abstract
Purpose:
To comprehensively characterize the dosimetric properties of a clinical digital breast tomosynthesis (DBT) system for the acquisition of mammographic and tomosynthesis images.
Materials and Methods:
Compressible water-oil mixture phantoms were created and imaged by using the automatic exposure control (AEC) of the Selenia Dimensions system (Hologic, Bedford, Mass) in both DBT and full-field digital mammography (FFDM) mode. Empirical measurements of the x-ray tube output were performed with a dosimeter to measure the air kerma for the range of tube current–exposure time product settings and to develop models of the automatically selected x-ray spectra. A Monte Carlo simulation of the system was developed and used in conjunction with the AEC-chosen settings and spectra models to compute and compare the mean glandular dose (MGD) resulting from both imaging modalities for breasts of varying sizes and glandular compositions.
Results:
Acquisition of a single craniocaudal view resulted in an MGD ranging from 0.309 to 5.26 mGy in FFDM mode and from 0.657 to 3.52 mGy in DBT mode. For a breast with a compressed thickness of 5.0 cm and a 50% glandular fraction, a DBT acquisition resulted in an only 8% higher MGD than an FFDM acquisition (1.30 and 1.20 mGy, respectively). For a breast with a compressed thickness of 6.0 cm and a 14.3% glandular fraction, a DBT acquisition resulted in an 83% higher MGD than an FFDM acquisition (2.12 and 1.16 mGy, respectively).
Conclusion:
For two-dimensional–three-dimensional fusion imaging with the Selenia Dimensions system, the MGD for a 5-cm-thick 50% glandular breast is 2.50 mGy, which is less than the Mammography Quality Standards Act limit for a two-view screening mammography study.
© RSNA, 2012
Introduction
Digital breast tomosynthesis (DBT) (1) is an emerging imaging method that produces pseudo–three-dimensional images of the breast and shows great promise as a replacement for or adjunct to planar mammography for breast cancer screening and diagnosis. DBT can help provide greater detail about the internal structure of the breast tissue and overcomes mammography’s greatest limitation—that is, the reduction of a three-dimensional structure to a two-dimensional image. This is achieved by acquiring multiple low-dose projections of the breast over a limited angular range and then calculating a pseudo–three-dimensional reconstruction (1–3). Promising results from preliminary studies (4–8) reveal that DBT has the potential to reduce the callback rate, increasing specificity while also increasing detection rate, and thereby increasing sensitivity, in breast cancer screening.
The Selenia Dimensions (Hologic, Bedford, Mass) DBT system, recently approved by the U.S. Food and Drug Administration for clinical use, is able to perform both full-field digital mammography (FFDM) and DBT. Previous studies (3,9–11) have investigated the normalized mean glandular dose (MGD), defined as the MGD per unit reference exposure or per unit reference air kerma, resulting from DBT overall as an imaging modality. These studies provide relative dose coefficients with units of MGD per unit reference exposure or air kerma for a number of x-ray spectra. In this study, we investigated the dosimetric characteristics of a specific tomosynthesis system, taking into account the specific x-ray spectra and acquisition protocols automatically chosen by the system to obtain absolute MGD values for each breast of specific thickness and composition. In addition, the dual imaging functionality of the system enabled a direct comparison of the dose resulting from FFDM and that resulting from DBT. Given the potential for use of this system and the DBT modality for screening in the general population, we believe that in-depth knowledge of its dosimetric behavior is essential.
The purpose of our study was to comprehensively characterize the dosimetric properties of a clinical DBT system for the acquisition of mammographic and tomosynthesis images.
Materials and Methods
To characterize the radiation dose delivered to an imaged breast, the automatic exposure control (AEC) of the DBT system was used to select the x-ray spectrum and x-ray exposure settings for both FFDM and DBT acquisitions in breast phantoms of varying sizes and adipose-glandular compositions. Empiric measurements were performed by using a dosimeter to determine the half-value layers of the selected x-ray spectra and to measure the air kerma at the breast support plate for different tube current–exposure time product settings. A Monte Carlo simulation of the Selenia Dimensions system was developed and was used to compute the normalized MGD resulting from both mammographic and tomosynthesis acquisitions in breasts of sizes and compositions that matched those of our phantoms. Finally, the MGD was estimated by combining these results with the tube current–exposure time product settings chosen by the AEC.
DBT System
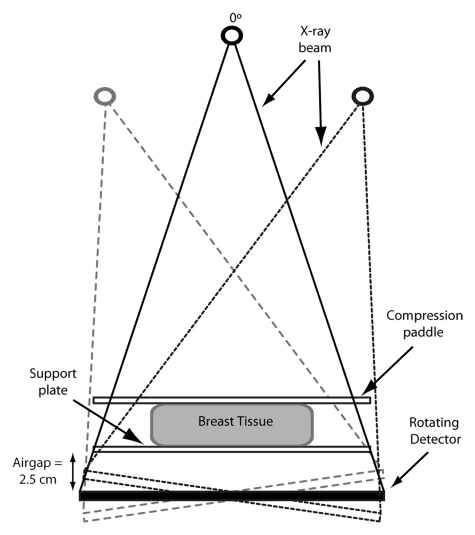
When it is performing a DBT acquisition, the system acquires 15 projections over a 15° angular range (from −7.5° to +7.5°). For the central projection (tomosynthesis angle = 0°), the source-to-imager distance is 70 cm, with a 2.5-cm air gap between the detector and the breast support plate (Fig 1). The isocenter of the x-ray tube rotation is located at the central ray of the central projection, on the surface of the detector. The image detector measures 24 × 28 cm and rotates around an axis located on the surface of the detector and orthogonal to the chest wall. The system utilizes a tungsten target, with additional aluminum filtration for performing DBT acquisitions and either rhodium or silver filtration for performing FFDM acquisitions. Compression of the breast is achieved with a 3-mm-thick compression paddle. Details of this system were previously published by Ren et al (12).
Figure 1:
The Hologic Selenia Dimensions system acquires 15 projections, spaced evenly, over a 15° angular range, with the center projection (tomosynthesis angle = 0°) perpendicular to the image detector plane. The source-to-imager distance is 70 cm, with a 2.5-cm air gap between the detector and the breast support plate. The image detector measures 24 × 28 cm. (Image not to scale).
In clinical conditions, in fully automated mode, the system determines the tube voltage, the tube current–exposure time product, and, for FFDM acquisitions only, the filter. To determine the x-ray tube voltage and, in FFDM mode only, the filter material, the system uses the thickness of the compressed breast. To determine the tube current–exposure time product, a single low-dose scout exposure is performed before image acquisition, and the signal at the detector is analyzed. For a DBT acquisition, this scout exposure is performed with the tube in the −7.5° position.
AEC Selections
To determine the range of x-ray tube voltages and tube current–exposure time products the AEC would choose when imaging breasts of varying thicknesses and compositions, compressible phantoms of distilled water–olive oil mixtures in malleable plastic containers were made and imaged in the craniocaudal view. These materials were chosen because water and olive oil are good analogs for breast glandular and adipose tissues, respectively (13,14). Both DBT and FFDM acquisitions were performed for each phantom at least three times, and the observed settings were averaged. These phantoms were made to simulate clinically encountered breasts and ranged from 2 to 8 cm thick, in 1-cm steps, when compressed. The thickness was determined by both checking the system readout and measuring the separation between the compression paddle and the support plate by using calipers. The glandular fractions of these phantoms were fixed at 0% (100% olive oil), 14.3%, 25%, 50%, 75%, and 100% (100% water). The 14.3% glandular compressible phantom was included because it has been recently shown by Yaffe et al (15) that this is the glandular fraction of an “average” breast. In addition, while the study by Yaffe et al also found that patient breasts rarely have glandular fractions greater than 45%, phantoms with glandularity of up to 100% were included to allow comparison with results of previously published studies. Acquisitions were also performed with a commercial 50% glandular mammography phantom (Model 082; CIRS, Norfolk, Va), and the AEC-chosen settings were compared with those recorded for the 50% glandular compressible oil-water phantoms of selected thicknesses. The x-ray tube voltage, filter selection, and tube current–exposure time product chosen for each phantom were recorded, and the voltage and filter combination are henceforth referred to as a designated x-ray spectrum. The inclusion of the filter section was necessary, as the system selects either rhodium or silver as added filtration in the x-ray tube when performing FFDM acquisitions and aluminum as added filtration when performing DBT acquisitions.
X-ray Tube Output Characterization
The x-ray source of the tested system uses a tungsten target and a 50-μm-thick rhodium or silver filter for FFDM acquisitions and a 0.7-mm-thick aluminum filter for DBT acquisitions. The x-ray spectra can vary between 20 and 49 kVp, as selected either by the AEC or manually (12).
Each of the designated x-ray spectra, a combination of added filtration selection and tube voltage, observed to have been chosen for either a DBT or an FFDM acquisition in the phantoms was modeled according to the method described by Boone et al (16) and was matched to the first half-value layer, which was determined empirically by measuring the x-ray tube output with a calibrated dosimeter (Accu-Dose; Radcal, Monrovia, Calif) and a dedicated mammography ionization chamber (Model 10 × 6-6M; Radcal). The ionization chamber was placed on the breast support plate at the central ray of the zero-angle projection, which was the location for the reference air kerma used by the Monte Carlo simulations, and the air kerma measurement was recorded for a single acquisition with the tube current–exposure time product set at 100 mAs. Subsequently, additional thicknesses of aluminum (99.5% minimum, Model Number 1901017; Unfors Instruments, Hopkinton, Mass) were added at the output port of the x-ray tube, and the exposure was measured again with each thickness. For accuracy in these and all subsequent measurements, three measurements were performed for each thickness of aluminum, and the results were averaged. The half-value layer of the x-ray spectral models was matched to the measured half-value layer by varying the thickness of the modeled filter of the x-ray tube. The expected air kerma for each additional thickness of aluminum was calculated from these models and was compared with that measured with the dosimeter. In addition, to determine the relationships between the tube current–exposure time product and air kerma, measurements were also performed for each x-ray spectrum by using at least three different tube current–exposure time product settings.
All measurements for the tomosynthesis x-ray spectra were performed with the x-ray tube locked in the central projection position for all 15 projections, because this is the definition of the reference air kerma used by this study’s Monte Carlo simulation to normalize its glandular dose output. The reference air kerma was defined in this manner to simplify its measurement, avoiding the need to locate the central ray for each tomosynthesis projection (3).
Monte Carlo Simulations
A Monte Carlo simulation was developed and was implemented in C++. It is based on the Geant4 Monte Carlo simulation toolkit (17,18) and is similar to simulations described in reports by Sechopoulos et al (3,9,19). In the present study, only the FFDM and DBT craniocaudal views were studied. The simulation also included the breast to be imaged, with the previously described varying glandular fractions, a chest-to-nipple distance of 10 cm, a skin thickness of 0.4 cm, and compression to thicknesses that matched those of the compressible phantoms. Breasts of a single chest-to-nipple distance were simulated because results of previous studies (3) have shown that both the normalized glandular dose for the central projection and the mean of the relative glandular dose for a complete symmetric tomosynthesis acquisition, especially in the craniocaudal view and for the limited angular range (±7.5°) used by this system, do not vary substantially with breast size. In addition, the AEC selected the same acquisition protocols for breast phantoms of the same thickness and composition but different sizes.
Within each simulation, 1 million (106) x-rays of the same energy, from 5 keV to the maximum energy level of the spectrum selected by the AEC (in 0.5-keV steps), are emitted and tracked, and each energy deposition in the breast glandular tissue is recorded, according to the method of Boone (20) and Wilkinson and Heggie (21). The monochromatic results are then combined, as described by Boone (22), by using the developed spectrum models to obtain the normalized MGD (for both FFDM and DBT) in units of milligray per milligray air kerma.
The previously determined relationships between the tube current–exposure time product and air kerma and the recorded imaging techniques chosen by the AEC were used to calculate the total air kerma used for each size and glandularity of breast imaged. Finally, this was combined with the normalized MGD for FFDM and DBT to calculate the MGD to the breast for each imaging modality.
Results
AEC Selections
The imaging techniques, comprising x-ray tube voltage and tube current–exposure time product settings, chosen by the AEC for each compressible phantom are shown in Table 1 and Table 2 for DBT and FFDM, respectively. A total of 14 distinct x-ray spectra were observed to have been chosen by the AEC, one for each compressed phantom thickness for each imaging modality.
Table 1.
AEC Setting Selections for DBT
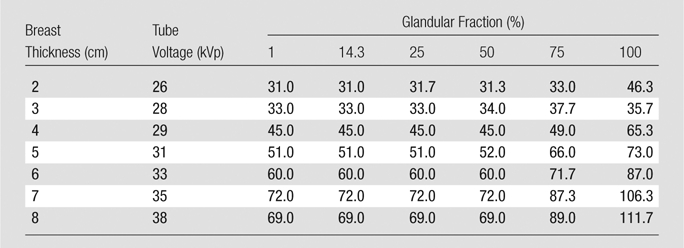
Note.—Data are total tube current–exposure time products (in milliampere seconds) for all 15 projections. For DBT, this system always uses an aluminum filter.
Table 2.
AEC Setting Selections for FFDM
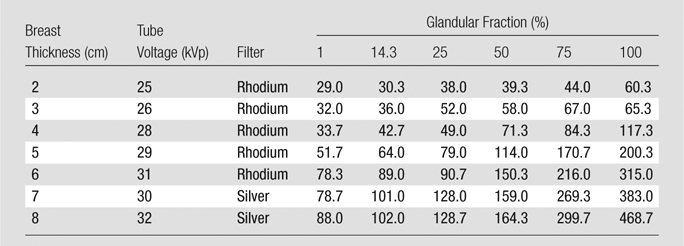
Note.—Data are total tube current–exposure time products (in milliampere seconds).
In most cases, the AEC called for higher tube current–exposure time product settings with increasing phantom thickness and increasing glandular fraction, as expected. However, certain observed measurements did not fit these trends. Those for the DBT acquisitions of the 8.0-cm-thick phantoms with glandular fractions of 1%, 14.3%, 25%, and 50% were lower than those for the 7.0-cm-thick phantoms. Those for the 3.0-cm-thick phantoms with 100% glandular fraction were lower than those for the phantom of the same thickness with 75% glandular fraction and those for the 100% glandular 2.0-cm-thick phantom. These inconsistencies remained, even with repeated measurements. It was verified that the system readouts for compressed breast thickness agreed with the caliper measurements in all cases.
Settings chosen by the AEC for the 50% glandular compressible phantoms matched closely those chosen for the Model 082 50% glandular commercial mammography phantom for thicknesses of 2.0, 4.0, 6.0, and 8.0 cm for both the DBT and FFDM modes (Table 3).
Table 3.
Comparison of AEC Setting Selections for DBT and FFDM between the CIRS Model 082 50% Glandular Phantom and the 50% Glandular Compressible Phantom
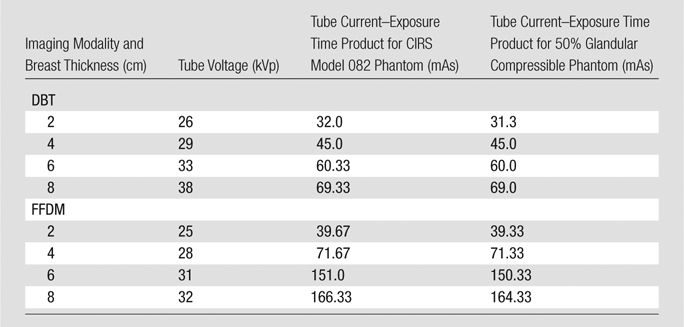
Note.—The x-ray spectra selections by the AEC were identical, in terms of tube voltage, for phantoms of the same thickness.
X-ray Tube Output Characterization
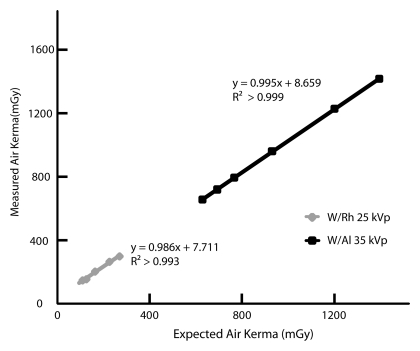
The calculated expected change in air kerma of the developed x-ray spectrum models deviated by less than 4% from the measured air kerma changes recorded with the dosimeter when additional thicknesses of aluminum were placed under the x-ray tube output port. This comparison is shown for two example spectra, a 30-kVp tungsten/aluminum tube-filter combination selected for DBT, and a 25-kVp tungsten/rhodium tube-filter combination selected for FFDM, in Figure 2. The relationships between air kerma and tube current–exposure time product were found to be linear for all the designated x-ray spectra chosen by the AEC system, with R2 > 0.99.
Figure 2:
Graph shows validation of two of the developed x-ray spectra models: a 35-kVp tungsten/aluminum tube-filter combination selected for DBT and a 25-kVp tungsten/rhodium tube-filter combination selected for FFDM. The calculated estimated air kerma agreed well with the measured air kerma (R2 > 0.99).
Monte Carlo Simulations
The results for the normalized MGD for DBT and FFDM are shown in Table 4 and Table 5, respectively. As can be expected, both the normalized MGD for DBT and that for FFDM decreased with increasing glandularity and with increasing breast thickness in general. There was one exception of note: The phantoms measuring 8.0 cm thick exhibited a normalized MGD for DBT that was greater than that of the 7.0-cm-thick phantoms of the same glandular fraction. However, this can be attributed to the different x-ray spectra chosen by the AEC for phantoms of differing thicknesses.
Table 4.
Monte Carlo Results for Normalized MGD for DBT
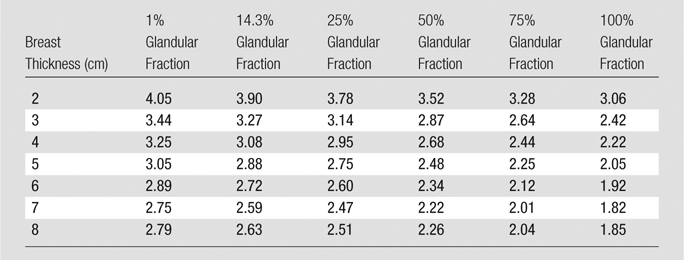
Note.—Data are normalized MGDs (in milligrays per milligray of air kerma).
Table 5.
Monte Carlo Results for Normalized MGD for FFDM
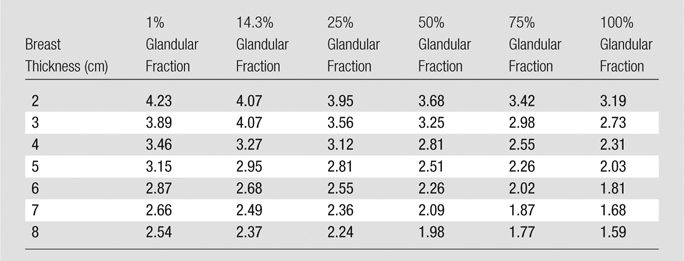
Note.—Data are normalized MGDs (in milligrays per milligray of air kerma).
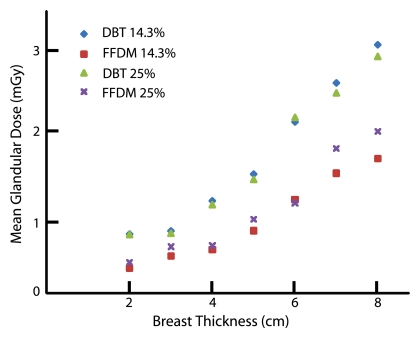
Calculations of the total MGD for both DBT and FFDM are shown in Table 6 and Table 7, respectively. Both MGD for DBT and that for FFDM generally decreased with increasing glandularity and increased with breast thickness (Fig 3).
Table 6.
Calculated Results for MGD for DBT
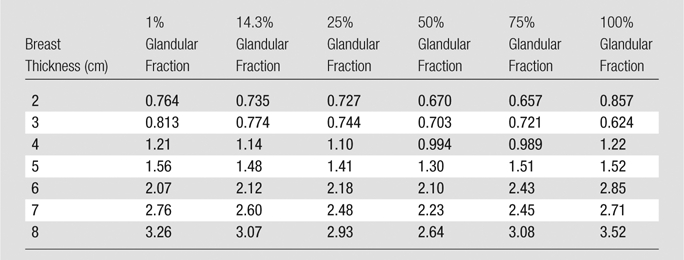
Note.—Data are MGDs (in milligrays).
Table 7.
Calculated Results for MGD for FFDM
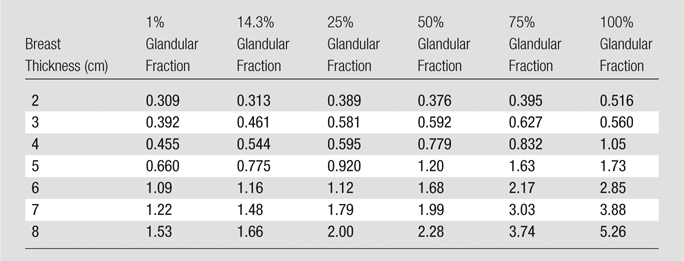
Note.—Data are MGDs (in milligrays).
Figure 3:
Graph shows MGD versus breast thickness. MGD for both DBT and FFDM increased with thickness and with glandular fraction for most breasts. Percentages = glandular fractions.
The ratios of MGD for DBT to those for FFDM in the phantoms are shown in Table 8. For most of the breast phantom sizes in this study, a single-view DBT acquisition resulted in an MGD of less than two times that of a single-view FFDM acquisition. However, there were notable exceptions, including two breasts of 14.3% glandular fraction—those with thicknesses of 2.0 and 4.0 cm.
Table 8.
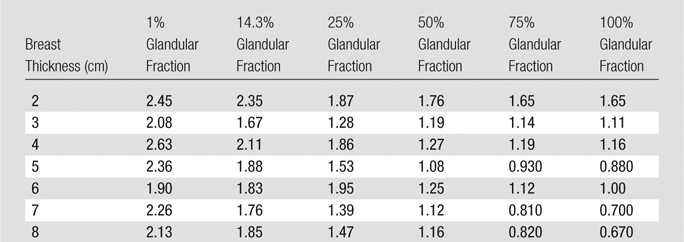
Discussion
The results of this study revealed that for the breast phantoms representing the most commonly clinically encountered breasts (2.0–8.0 cm thick, 1%–50% glandular fraction), a craniocaudal view acquisition can result in an MGD of 0.309–2.28 mGy for FFDM and 0.670–3.26 mGy for DBT. Furthermore, for the breast phantom representing the “average” breast (5.0 cm thick, 50% glandular fraction) (23,24), the MGDs for the FFDM and DBT acquisitions were 1.20 and 1.30 mGy, respectively, resulting in a difference of only 8% between the two modalities, and a fusion two-dimensional–three-dimensional imaging study resulted in an MGD of 2.50 mGy. Hendrick et al (25) reported that the MGD for the 5–6-cm-thick breasts included in the American College of Radiology Imaging Network’s Digital Mammographic Imaging Screen Trial (DMIST) ranged from 2.06 to 3.01 mGy. Therefore, the Hologic Selenia Dimensions system, in either FFDM or DBT mode, results in a considerably lower MGD than the systems used in DMIST, and the combined FFDM and DBT study resulted in a dose comparable to that of an FFDM-only acquisition in DMIST. For the breast phantom that represented the average breast (6.0 cm thick, 14.3% glandular fraction) in a recent study (15), a craniocaudal view acquisition resulted in an MGD of 1.16 mGy for FFDM and 2.12 mGy for DBT, a difference of 83%. Thus, a combined FFDM-DBT study of this breast performed by using the Selenia Dimensions system resulted in an MGD of 3.28 mGy, 2.8 times that of a single-view FFDM study and slightly higher than the FFDM dose range reported in DMIST for 5–6-cm thick breasts.
For some of the thicker, denser (ie, a glandular fraction of 75% and 100%) breasts, a DBT acquisition actually resulted in a lower MGD—as low as 67% as much radiation dose as an FFDM acquisition. However, this was a result of the fact that the tube current–exposure time product chosen by the AEC for an FFDM acquisition of these clinically improbable breasts was very high, ranging from 269 to 469 mAs, resulting in a much higher MGD.
While previous studies have explored the normalized dosimetry of DBT and its comparison to digital mammography (3,9), providing dose conversion coefficients in units of dose per reference exposure/air kerma, this study provides a detailed characterization of dosimetry in absolute terms, including taking into consideration the acquisition protocols automatically selected by the AEC for different breasts. In addition, the combination of measurements of the system’s x-ray tube air kerma output, observation of the system’s automated selections of x-ray spectra and tube current–exposure time products for breast phantoms of varying sizes and tissue compositions, and system-specific Monte Carlo simulations to determine the resulting dose to the patient distinguishes this work from those studies. To the best of our knowledge, this approach has not been previously used to characterize the dosimetry of any DBT system, although it has been used in the dosimetry of a dedicated breast computed tomography system (14). It should also be noted that while in this experiment we probed the behavior of the AEC, its exact size and location is not important, as long as the breast phantom is located in the standard mammography position for the compressed breast (central to the detector at the chest wall edge).
Although this has yet to be proved possible, if in the future a single-view DBT acquisition replaces the current two-view FFDM screening examination, as has been discussed as a possibility (4,6,26,27), this would result in an MGD savings, as the former results in an MGD of less than two times that of a single-view FFDM acquisition in most clinically encountered breasts. Furthermore, if screening with DBT results in a reduction in recall rate, as has been suggested by previous investigators (4–8), this could result in a reduction in population dose, because there would be a reduction in diagnostic work-up mammographic examinations, which often require acquisition of four to six additional views.
The results of this study are limited to providing the MGD delivered to homogeneous phantoms representing breasts of various glandular fractions. Future studies could include recording the AEC selections for both FFDM and DBT acquisitions in the same patient, followed by a comparison of the resulting MGDs with an assumption of the glandular fraction of the patient breast. The use of homogeneous phantoms could also be a limitation, because in clinical conditions, the AEC settings are based on the signal toward the center of the detector, and therefore what is normally the densest part of the breast. Thus, use of a homogeneous phantom results in the AEC settings normally used for a breast with an overall lower glandular fraction; however, this would not affect the MGD ratios displayed in Table 8. In addition, this study investigated the resulting dose to the breast from craniocaudal view DBT and FFDM acquisitions, and future studies of the resulting dose from mediolateral oblique (MLO) images are needed. To perform this study for the MLO view, a realistic depiction of the portion of the pectoralis muscle present within the compressed tissue and in the field of view would need to be incorporated into the breast phantom to include its effect on the AEC’s selected acquisition protocol. We are not aware of any reports on how much muscle tissue should be included in different-sized breast phantoms to represent clinically encountered conditions, nor of a reasonable material to mimic its attenuation properties. Furthermore, although reports have included partial data on compressed thicknesses for the same breast in the craniocaudal and MLO views (28,29), a comprehensive study on this relationship still needs to be performed. Finally, it should be noted that MGD does not communicate the large variation in local dose deposition, which, as shown by Sechopoulos et al (14), can vary from 15%–400% of the MGD.
Advances in Knowledge.
• With the tested system, acquisition of a single craniocaudal view results in a mean glandular dose (MGD) that ranges from 0.309 to 5.26 mGy in full-field digital mammography (FFDM) mode and from 0.657 to 3.52 mGy in digital breast tomosynthesis (DBT) mode, depending on breast thickness and composition.
• For an average breast (defined as 5 cm thick when compressed and with 50% glandular fraction), a DBT acquisition resulted in an only 8% higher MGD than an FFDM acquisition (1.30 and 1.20 mGy, respectively); for a 6-cm-thick compressed breast with 14.3% glandular fraction, a DBT acquisition resulted in an 83% higher MGD than an FFDM acquisition (2.12 and 1.16 mGy, respectively).
Implications for Patient Care.
• Two-dimensional–three-dimensional fusion imaging of a homogeneous representation of an average 5-cm-thick 50% glandular breast can be performed at a dose that is lower than the Mammography Quality Standards Act limit of 3 mGy per view for screening mammography.
• If breast cancer screening in the future is performed with a single-view tomosynthesis image, dose reduction is possible for most clinically relevant breast sizes and densities.
Disclosures of Potential Conflicts of Interest: S.S.J.F. No potential conflicts of interest to disclose. I.S. No potential conflicts of interest to disclose.
Received August 23, 2011; revision requested September 30; revision received October 19; final version accepted November 1.
Funding: This research was supported by the National Institutes of Health (grant UL1 RR025008).
Abbreviations:
- AEC
- automatic exposure control
- DBT
- digital breast tomosynthesis
- FFDM
- full-field digital mammography
- MGD
- mean glandular dose
References
- 1.Niklason LT, Christian BT, Niklason LE, et al. Digital tomosynthesis in breast imaging. Radiology 1997;205(2):399–406 [DOI] [PubMed] [Google Scholar]
- 2.Wu T, Zhang J, Moore R, et al. Digital tomosynthesis mammography using a parallel maximum-likelihood reconstruction method. Proc SPIE 2004;5368:1–11 [Google Scholar]
- 3.Sechopoulos I, Suryanarayanan S, Vedantham S, D’Orsi C, Karellas A. Computation of the glandular radiation dose in digital tomosynthesis of the breast. Med Phys 2007;34(1):221–232 [DOI] [PMC free article] [PubMed] [Google Scholar]
- 4.Moore RH, Kopans DB, Rafferty EA, Georgian-Smith D, Hitt RA, Yeh ED. Initial callback rates for conventional and digital breast tomosynthesis mammography comparison in the screening setting [abstr]. In: Radiological Society of North America Scientific Assembly and Annual Meeting Program. Oak Brook, Ill: Radiological Society of North America, 2007; 381 [Google Scholar]
- 5.Helvie MA, Roubidoux MA, Hadjiiski LM, Zhang Y, Carson PL, Chan HP. Tomosynthesis mammography versus conventional mammography: comparison of breast masses detection and characterization [abstr]. In: Radiological Society of North America Scientific Assembly and Annual Meeting Program. Oak Brook, Ill: Radiological Society of North America, 2007; 381 [Google Scholar]
- 6.Poplack SP, Tosteson TD, Kogel CA, Nagy HM. Digital breast tomosynthesis: initial experience in 98 women with abnormal digital screening mammography. AJR Am J Roentgenol 2007;189(3):616–623 [DOI] [PubMed] [Google Scholar]
- 7.Andersson I, Ikeda DM, Zackrisson S, et al. Breast tomosynthesis and digital mammography: a comparison of breast cancer visibility and BIRADS classification in a population of cancers with subtle mammographic findings. Eur Radiol 2008;18(12):2817–2825 [DOI] [PubMed] [Google Scholar]
- 8.Gur D, Abrams GS, Chough DM, et al. Digital breast tomosynthesis: observer performance study. AJR Am J Roentgenol 2009;193(2):586–591 [DOI] [PubMed] [Google Scholar]
- 9.Sechopoulos I, D’Orsi CJ. Glandular radiation dose in tomosynthesis of the breast using tungsten targets. J Appl Clin Med Phys 2008;9(4):2887. [DOI] [PMC free article] [PubMed] [Google Scholar]
- 10.Ma AKW, Darambara DG, Stewart A, Gunn S, Bullard E. Mean glandular dose estimation using MCNPX for a digital breast tomosynthesis system with tungsten/aluminum and tungsten/aluminum+silver x-ray anode-filter combinations. Med Phys 2008;35(12):5278–5289 [DOI] [PubMed] [Google Scholar]
- 11.Dance DR, Young KC, van Engen RE. Estimation of mean glandular dose for breast tomosynthesis: factors for use with the UK, European and IAEA breast dosimetry protocols. Phys Med Biol 2011;56(2):453–471 [DOI] [PubMed] [Google Scholar]
- 12.Ren B, Ruth C, Wu T, et al. A new generation FFDM/tomosynthesis fusion system with selenium detector. Proc SPIE 2010;7622:76220B–76211 [Google Scholar]
- 13.Saito M. Dual-energy approach to contrast-enhanced mammography using the balanced filter method: spectral optimization and preliminary phantom measurement. Med Phys 2007;34(11):4236–4246 [DOI] [PubMed] [Google Scholar]
- 14.Sechopoulos I, Feng SSJ, D’Orsi CJ. Dosimetric characterization of a dedicated breast computed tomography clinical prototype. Med Phys 2010;37(8):4110–4120 [DOI] [PMC free article] [PubMed] [Google Scholar]
- 15.Yaffe MJ, Boone JM, Packard N, et al. The myth of the 50-50 breast. Med Phys 2009;36(12):5437–5443 [DOI] [PMC free article] [PubMed] [Google Scholar]
- 16.Boone JM, Fewell TR, Jennings RJ. Molybdenum, rhodium, and tungsten anode spectral models using interpolating polynomials with application to mammography. Med Phys 1997;24(12):1863–1874 [DOI] [PubMed] [Google Scholar]
- 17.Agostinelli S, Allison J, Amako K, et al. Geant4: a simulation toolkit. Nucl Instrum Meth A 2003;506(3):250–303 [Google Scholar]
- 18.Allison J, Amako K, Apostolakis J, et al. Geant4 developments and applications. IEEE Trans Nucl Sci 2006;53(1):270–278 [Google Scholar]
- 19.Sechopoulos I, Suryanarayanan S, Vedantham S, D’Orsi CJ, Karellas A. Scatter radiation in digital tomosynthesis of the breast. Med Phys 2007;34(2):564–576 [DOI] [PMC free article] [PubMed] [Google Scholar]
- 20.Boone JM. Glandular breast dose for monoenergetic and high-energy X-ray beams: Monte Carlo assessment. Radiology 1999;213(1):23–37 [DOI] [PubMed] [Google Scholar]
- 21.Wilkinson L, Heggie JCP. Glandular Breast Dose: Potential Errors [eletter]. http://radiology.rsna.org/content/213/1/23/reply#radiology_el_5. Accessed November 21, 2005
- 22.Boone JM. Normalized glandular dose (DgN) coefficients for arbitrary X-ray spectra in mammography: computer-fit values of Monte Carlo derived data. Med Phys 2002;29(5):869–875 [DOI] [PubMed] [Google Scholar]
- 23.Hammerstein GR, Miller DW, White DR, Masterson ME, Woodard HQ, Laughlin JS. Absorbed radiation dose in mammography. Radiology 1979;130(2):485–491 [DOI] [PubMed] [Google Scholar]
- 24.Boone JM, Lindfors KK, Cooper VN, 3rd, Seibert JA. Scatter/primary in mammography: comprehensive results. Med Phys 2000;27(10):2408–2416 [DOI] [PubMed] [Google Scholar]
- 25.Hendrick RE, Pisano ED, Averbukh A, et al. Comparison of acquisition parameters and breast dose in digital mammography and screen-film mammography in the American College of Radiology Imaging Network digital mammographic imaging screening trial. AJR Am J Roentgenol 2010;194(2):362–369 [DOI] [PMC free article] [PubMed] [Google Scholar]
- 26.Michell MJ, Wasan RK, Iqbal A, Peacock C, Evans DR, Morel JC. Two-view 2D digital mammography versus one-view digital breast tomosynthesis. In: Royal College of Radiologists Breast Group Annual Scientific Meeting 2010. Brighton, England: BioMed Central, 2010; 3 [Google Scholar]
- 27.Rafferty EA. Digital mammography: novel applications. Radiol Clin North Am 2007;45(5):831–843, vii [DOI] [PubMed] [Google Scholar]
- 28.Jamal N, Ng KH, McLean D. A study of mean glandular dose during diagnostic mammography in Malaysia and some of the factors affecting it. Br J Radiol 2003;76(904):238–245 [DOI] [PubMed] [Google Scholar]
- 29.Young KC, Burch A. Radiation doses received in the UK Breast Screening Programme in 1997 and 1998. Br J Radiol 2000;73(867):278–287 [DOI] [PubMed] [Google Scholar]


