The results of this study demonstrate that the blood-brain barrier can be disrupted in a repeatable and safe manner by using real-time exposure control based on acoustic emissions.
Abstract
Purpose:
To determine if focused ultrasound disruption of the blood-brain barrier (BBB) can be safely controlled by using real-time modulation of treatment pressures on the basis of acoustic emissions from the exposed microbubbles.
Materials and Methods:
All experiments were performed with the approval of the institutional animal care committee. Transcranial focused ultrasound (551.5 kHz, 10-msec bursts, 2-Hz pulse repetition frequency, 2 minute sonication) in conjunction with circulating microbubbles was applied in 86 locations in 27 rats to disrupt the BBB. Acoustic emissions captured during each burst by using a wideband polyvinylidene fluoride hydrophone were analyzed for spectral content and used to adjust treatment pressures. Pressures were increased incrementally after each burst until ultraharmonic emissions were detected, at which point the pressure was reduced to a percentage of the pressure required to induce the ultraharmonics and was maintained for the remainder of the sonication. Disruption was evaluated at contrast material–enhanced T1-weighted magnetic resonance (MR) imaging. Mean enhancement was calculated by averaging the signal intensity at the focus over a 3 × 3-pixel region of interest and comparing it with that in nonsonicated tissue. Histologic analysis was performed to determine the extent of damage to the tissue. Statistical analysis was performed by using Student t tests.
Results:
For sonications resulting in BBB disruption, the mean peak pressure was 0.28 MPa ± 0.05 (standard deviation) (range, 0.18–0.40 MPa). By using the control algorithm, a linear relationship was found between the scaling level and the mean enhancement on T1-weighted MR images after contrast agent injection. At a 50% scaling level, mean enhancement of 19.6% ± 1.7 (standard error of the mean) was achieved without inducing damage. At higher scaling levels, histologic analysis revealed gross tissue damage, while at a 50% scaling level, no damage was observed at high-field-strength MR imaging or histologic examination 8 days after treatment.
Conclusion:
This study demonstrates that acoustic emissions can be used to actively control focused ultrasound exposures for the safe induction of BBB disruption.
© RSNA, 2012
Introduction
Focused ultrasound disruption of the blood-brain barrier (BBB) by using circulating microbubbles offers potential to improve the treatment of brain and central nervous system disorders. The BBB prevents passage of molecules greater than approximately 500 Da from the vasculature into the brain tissue (1), greatly reducing the effectiveness of many types of therapeutic agents. Focused ultrasound disruption of the BBB has been successfully used to deliver amyloid b antibodies (2), large-molecule immunotherapy agents for cancer (3), and other large molecules (4).
The BBB serves an important role in regulating the exchange of nutrients and waste between the tissue and vasculature while at the same time preventing the passage of pathogens into the parenchyma. However, effective treatment of many central nervous system disorders requires circumvention of the BBB. Direct injection of agents into the brain parenchyma is one technique but is highly invasive. Disruption of the BBB by means of intraarterial infusion of a hyperosmotic solution generally opens the BBB globally. Focused ultrasound BBB disruption is noninvasive and selectively targets specific brain regions. When disruption is performed at appropriate pressures, parenchymal and vascular damage is avoided. Focused ultrasound–induced BBB disruption is transient, and the BBB has been reported to be fully closed anywhere between 1 hour and 10 hours after treatment (5–11). Long-term survival studies (5,12) have demonstrated no negative effects resulting from transient BBB disruption, and behavioral assessments in mice (13) have shown no changes in behavior after focused ultrasound–induced BBB disruption.
Currently, the greatest limitation for the clinical translation of focused ultrasound BBB disruption is the lack of a real-time monitoring technique. Disruption can be evaluated by using contrast material–enhanced magnetic resonance (MR) imaging, but not quickly enough to constitute real-time feedback. Cho et al (14) observed different leakage rates in rat brains when they visualized focused ultrasound–induced BBB disruption with a dual-photon microscope. In some cases, leakage was first observed 5–15 minutes after the completion of the sonication. The introduction of microbubbles to the brain can be seen as a safety concern, especially when the use of transcranial ultrasound can make estimation of in situ pressure magnitudes and distibutions difficult (15). This highlights the need for a real-time technique to monitor microbubble behavior during focused ultrasound–induced BBB disruption.
The possibility of using microbubble acoustic emissions during BBB disruption to control treatment has been proposed (16). In particular, harmonic emissions have been identified as a possible indicator of treatment outcome (16,17). However, harmonic signal components can arise from the tissue or from the coupling media, not just from the circulating microbubbles. As a result, these harmonic signal components may not result in the most robust method of controlling treatments. Conversely, subharmonic and ultraharmonic emissions (ie, emissions at nf0/2, n = 1, 3, 5…, where f0 is the fundamental frequency of the driving signal) can arise only from bubble emissions and are indicators of stable cavitation (18). We propose that ultraharmonic emissions may be used as the basis for a feedback control algorithm to safely modulate pressures during treatment.
The purpose of this study was to determine if focused ultrasound disruption of the BBB can be safely controlled by using real-time modulation of treatment pressures on the basis of acoustic emissions from the exposed microbubbles.
Materials and Methods
Generation and Monitoring of the Ultrasound
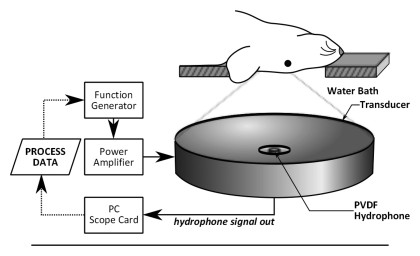
The ultrasound was generated by using a spherically focused transducer constructed in house (focal number = 0.8, external diameter = 75 mm, internal diameter = 20 mm), matched to 551.5 kHz by using an external matching circuit. The transducer had a focal depth of 60 mm and a −6-dB focal zone width of approximately 3 mm and a length of approximately 20 mm. Driving signals were generated by using a function generator (33220A; Agilent, Santa Clara, Calif) and were amplified by using a radiofrequency power amplifier (NP2519; NP Technology, Newbury Park, Calif). The transducer was driven in burst mode, with a 10-msec burst length. A 4.8-mm-diameter wideband polyvinylidene fluoride hydrophone similar to that described in our earlier report (19) was mounted in the center of the transducer (Fig 1). The hydrophone signal was captured by a 14-bit personal computer scope card (ATS460; AlazarTech, Pointe-Claire, Quebec, Canada) and was processed after each burst by a control algorithm in C++.
Figure 1a:
(a) Experimental setup for acoustic emissions–controlled BBB disruption. The animal is supine and coupled to the transducer by means of a water bath. PC = personal computer, PVDF = polyvinylidene fluoride. (b) Process flowchart for acoustic emissions–based decision making. FLAG = Boolean flag to indicate if ultraharmonics have been previously detected, INCR = pressure increment, P = pressure, TARG = target pressure level as a normalized value of the pressure for ultraharmonic emissions, tend = predetermined treatment end time. (c) Flowchart shows the distribution of study animals.
Benchtop Experiments
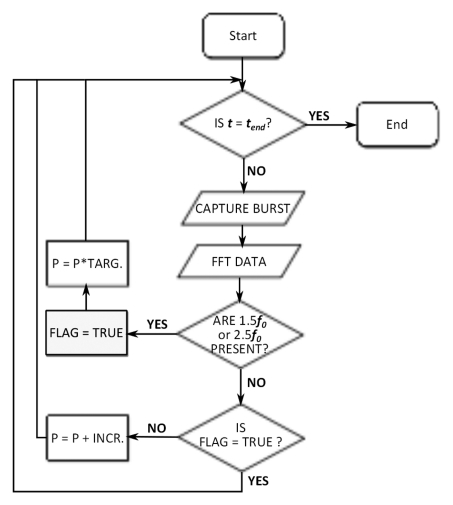
Ultrasound control algorithm development.—A control algorithm was implemented to adjust the driving voltage for an ultrasound transducer driven in burst mode after each ultrasound burst. The algorithm logic was based on microbubble acoustic emissions captured during each burst and processed prior to the next pulse. A flowchart outlining the control logic is shown in Figure 1b. After each ultrasound burst during the sonication, the data from the wideband hydrophone was collected, and the fast Fourier transform was calculated to obtain the signal spectrum. The presence of the 1.5 and 2.5 f0 ultraharmonics were evaluated by integrating over the spectrum around those frequencies (±180 Hz) and by comparing the resulting values to their respective values at time t = 0 seconds, when no microbubbles would be in circulation. The 1.5 and 2.5 f0 ultraharmonics were selected for evaluation because the spectral band close to the half harmonic was found to be more susceptible to spurious noise from MR imaging and was considered less reliable.
Figure 1b:
(a) Experimental setup for acoustic emissions–controlled BBB disruption. The animal is supine and coupled to the transducer by means of a water bath. PC = personal computer, PVDF = polyvinylidene fluoride. (b) Process flowchart for acoustic emissions–based decision making. FLAG = Boolean flag to indicate if ultraharmonics have been previously detected, INCR = pressure increment, P = pressure, TARG = target pressure level as a normalized value of the pressure for ultraharmonic emissions, tend = predetermined treatment end time. (c) Flowchart shows the distribution of study animals.
The control algorithm allowed the applied pressure during each burst to increase, starting from an estimated in situ pressure of 0.09 MPa. The in situ pressure was incremented in steps of 3 kPa. Pressure estimates were based on an assumed through-skull transmission of approximately 73% at 0.5 MHz (15) and an attenuation coefficient in brain tissue of 5 Np · m−1 · MHz−1 (20). No upper limit was placed on the applied pressure. When ultraharmonic emissions were detected, the program would respond by reducing the applied pressure to a predetermined target level (either 75%, 50%, 25%, or 0% of the pressure at which ultraharmonics were detected). The optimal target level for consistent and safe BBB disruption was investigated in vivo after benchtop testing of the algorithm. The remainder of the sonication would be performed at the target level. If ultraharmonics were detected again during the remainder of the sonication, another drop in applied pressure would occur. A log of the sonication pressure during each burst was recorded for postsonication analysis.
Algorithm testing.—The algorithm was tested on the benchtop by using acoustic emissions data captured during previous investigations at fixed pressures. Input waveforms and the applied pressure data were visualized in MATLAB (Mathworks, Natick, Mass). The response of the program was compared with the expected response following visual inspection of the waveforms. On the basis of the results of benchtop testing, the threshold for the program to register a detection of ultraharmonics was set to a three-fold increase in the area under these frequency bands over the baseline (t = 0) values. During benchtop testing, this threshold was found to be sufficiently high so as to minimize false-positive results from changes in background noise, but not so high as to miss weak ultraharmonic signals.
In Vivo Experiments
Animal preparation.—All animal experiments were approved by the Sunnybrook Research Institute animal care committee. Twenty-seven male rats (Wistar, n = 19, 337–609 g; Sprague-Dawley, n = 8, 338–353 g) were anesthetized with a mixture of ketamine (40–50 mg per kilogram of body weight) and xylazine (10 mg/kg). The hair on their heads was removed by using a depilatory cream. The animals were placed supine on a three-axis MR imaging–compatible focused ultrasound system (operationally similar to the system described by Chopra et al [21]). The rats’ heads were coupled to the ultrasound transducer by means of a water bath, as shown in Figure 1. Thirteen animals (group 1) were sacrificed approximately 2 hours after treatment. The remaining 14 animals (group 2) were intended to survive until follow-up at 8 days. Twelve of these animals survived for the 8-day posttreatment follow-up period, after which they were sacrificed. The final two animals did not recover from the anesthetic and were sacrificed 8–12 hours after treatment. Posttreatment MR imaging in these animals showed moderate levels of BBB disruption and no evidence of edema, and the ultrasound exposures were not thought to have played a role in the deaths. Following sacrifice, all brains were immediately fixed in 10% buffered formalin.
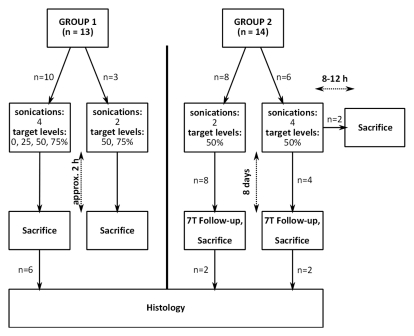
Sonications.—The distribution of animals and sonications is outlined in Figure 1c. All sonications consisted of 10-msec bursts at a pulse repetition frequency of 2 Hz for 2 minutes. The microbubble contrast agent (0.02 mL/kg, Definity; Lantheus Medical Imaging, North Billerica, Mass) was diluted 1:50 in normal saline and injected through a tail vein catheter by using an automated syringe pump (Chemyx NanoJetXF MR Imaging Compatible Syringe Pump; Chemyx, Stafford, Tex). Microbubbles were infused over 1 minute starting simultaneously with the start of sonication. This was to ensure that the bolus peak was not missed by the control algorithm. The starting pressure for the sonication (0.09 MPa) was kept low so that safe pressure levels were not exceeded in the time it took for the contrast agent to reach the brain. In addition, the 1-minute infusion was used to prolong the bolus peak while the control algorithm incremented.
Figure 1c:
(a) Experimental setup for acoustic emissions–controlled BBB disruption. The animal is supine and coupled to the transducer by means of a water bath. PC = personal computer, PVDF = polyvinylidene fluoride. (b) Process flowchart for acoustic emissions–based decision making. FLAG = Boolean flag to indicate if ultraharmonics have been previously detected, INCR = pressure increment, P = pressure, TARG = target pressure level as a normalized value of the pressure for ultraharmonic emissions, tend = predetermined treatment end time. (c) Flowchart shows the distribution of study animals.
As previously stated, the animals were considered in two groups. Group 1 consisted of 13 animals. This group was used to examine the effect of setting different target levels. In 10 animals, sonications were performed in four locations in each brain. Four target pressure levels were examined: 75%, 50%, 25%, and 0% of the pressure required to induce ultraharmonics. In the case of the 0% target level, the sonication was terminated on detection of ultraharmonics. For the 75%, 50%, and 25% target levels, after ultraharmonic detection, the pressure level was immediately reduced to and maintained at the target level for the remainder of the sonication (total sonication time, 2 minutes). One sonication was performed for each target level per brain (total, four sonications per animal). Sonication locations were randomized. Three additional animals received two sonications each, one at the 75% target level and one at the 50% target level. A total of 46 sonications were performed in the 13 animals.
Group 2 contained an additional 14 animals that received two or four sonications in each brain at the 50% target level to examine the safety of the control algorithm. A total of 40 sonications were performed in these animals.
The effectiveness and safety of the sonications were assessed by means of posttreatment imaging and histologic analysis, as described in the following sections.
Assessment
Imaging.—The MR imaging parameters are summarized in the Table. Sonication locations were selected from T2-weighted images obtained with a 1.5-T MR imaging system (Signa 1.5 T; GE Healthcare, Milwaukee, Wis). T1-weighted images enhanced with 0.2 mL/kg contrast material (gadodiamide, Omniscan; GE Healthcare) were used to confirm BBB disruption. Time series contrast-enhanced T1-weighted images were obtained until the enhancement peak had passed. Edema was evaluated on T2-weighted images obtained 15–20 minutes after the final sonication in each animal. Increased signal intensity on T2-weighted images in the region of the sonication was considered to represent edema.
MR Imaging Parameters
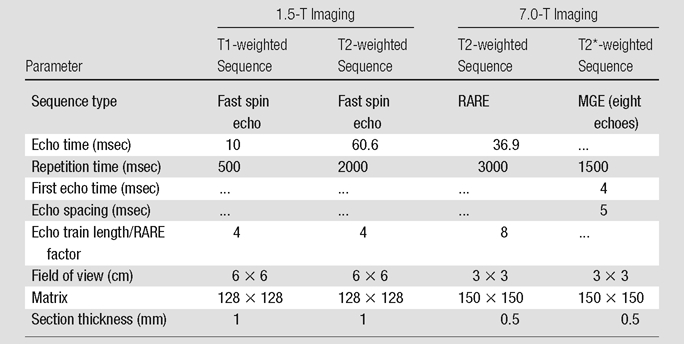
Note.—MGE = multigradient echo, RARE = rapid acquisition with relaxation enhancement.
Twelve animals from group 2, which were treated by using only the 50% target level, survived for 8 days after treatment and were imaged prior to sacrifice with a 7.0-T small-bore MR imaging unit (BioSpec 70/30 USR; Bruker, Billerica, Mass). T2-weighted and T2*-weighted images were obtained by using the parameters outlined in the Table. High signal intensity on T2-weighted images was considered to be a sign of residual edema and possible lesion formation, while T2*-weighted images were used to determine if bleeding or large extravasations of red blood cells had occurred (22,23).
Data analysis.—In the group 1 animals, eight sonications were excluded from analysis. The reasons for exclusion were technical errors (n = 3), false-positive detection of ultraharmonic emissions (n = 3), enlarged ventricle obstructing the sonication location (n = 1), and detection of ultraharmonics prior to the microbubbles reaching the brain (t < 6 seconds) (n = 1). In the last case, the detected ultraharmonics were attributed to trapped gas bubbles in the water bath. A total of 38 sonication locations (10, seven, 10, and 11 at 0%, 25%, 50%, and 75% target levels, respectively) were available for analysis.
In the group 2 animals, which had been treated by using the 50% target level, two locations were excluded because of operator error (n = 1) and hardware malfunction (n = 1). A total of 38 sonication locations were available for analysis, of which 30 locations represented those for which 8-day follow-up data were available. Across all 27 animals, 48 evaluable locations were sonicated at the 50% target level.
Analysis (M.A.O., with 3 years of experience) was performed with MATLAB. Percentage enhancement was calculated for each sonication location by averaging the intensity values in a 3 × 3-pixel region of interest and comparing them with the intensity values in adjacent unsonicated tissue. Software (MIPAV; Center for Information Technology, National Institutes of Health, Bethesda, Md) was used to examine the 7.0-T images.
Histologic analysis.— Histologic analysis was performed on 10 brains. Six brains were from animals in group 1 (the acute group). The remaining brains (n = 4) for histologic analysis were from animals that survived to follow-up and that had shown edema on T2-weighted images obtained immediately after treatment. The brains selected for histologic analysis had shown the most severe responses on the MR images and were therefore most likely to have histologic evidence of damage. The brains were embedded in paraffin and were axially sliced; serial slices were cut at 5-μm intervals, and hematoxylin-eosin staining was performed at 300-μm intervals. Hematoxylin-eosin–stained slices were examined for evidence of extravasated red blood cells and visible damage to the tissue matrix.
Immunohistochemical analysis was performed in two of the brains from group 2 animals (8-day survival), which had received sonications in four locations each. Both brains had exhibited some edema on T2-weighted images obtained immediately after treatment. Slices at the level of maximum enhancement on T1-weighted images were stained with NeuN antibodies to detect neuronal nuclei and were visualized with 3,39-diaminobenzidine. Slides were registered with posttreatment T1-weighted images to determine the sonication location and region of disruption. Neuronal nuclei were counted in a microscope field from the center of the sonication and from a field adjacent to the disrupted region (nonsonicated region) but within the same brain structure. Fields from multiple histologic levels were counted, if necessary, to obtain cell counts greater than 90 cells per sonicated or nonsonicated region. One author (M.A.O.) performed the counting after being blinded to the data.
Statistical analysis.—Statistical analysis of the T1-weighted enhancement data and the histologic data was performed by using Student t tests. T1-weighted enhancement means for the four scaling levels investigated (0%, 25%, 50%, 75%) were compared by using a two-tailed t test. The number of cells counted on the NeuN-stained levels in the sonicated and unsonicated areas were compared by using a two-tailed paired t test. P < .05 was considered to indicate a statistically significant difference.
Results
Control Algorithm Performance
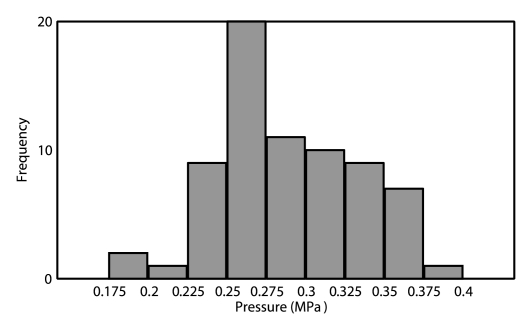
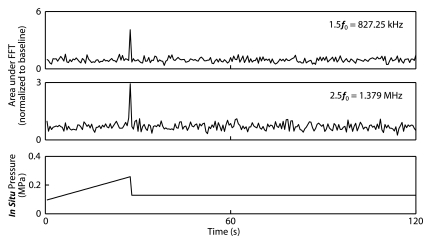
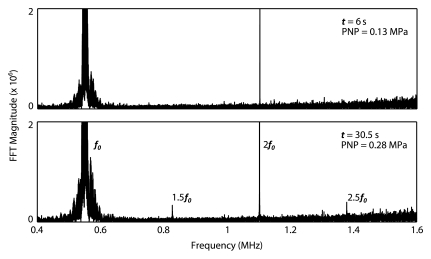
The control algorithm successfully identified ultraharmonic emissions in vivo and prevented a continued increase in pressure. The average pressure across all animals required to induce ultraharmonics was 0.28 MPa ± 0.05 (standard deviation) (n = 76). The distribution of peak pressures that resulted in disruption is shown in Figure 2. The lowest peak pressure resulting in disruption was 0.18 MPa (75% target level sonication), while the highest peak pressure that safely caused disruption was 0.40 MPa (50% target level sonication). For the 50% target level, the highest peak pressure reached (0.40 MPa) and the lowest peak pressure reached (0.21 MPa) both had maximum enhancements of approximately 11%, suggesting that sonicating at a fixed pressure value would result in either an overtreatment or an undertreatment of one of these cases. Figure 2 shows spectral data from a sonication at a time 6 seconds before the introduction of ultraharmonics and on detection of ultraharmonics at a time of 30.5 seconds. Figure 2c shows time series data for a sonication with a 50% target level. The pressure level is seen to increase until a time of 27 seconds (estimated 0.25 MPa in situ), where ultraharmonics are detected. The pressure is then seen to decrease to 0.13 MPa for the remainder of the sonication.
Figure 2a:
(a) Histogram of peak pressures achieved in sonications that resulted in disruption (n = 70). Bin size = 0.025 MPa. (b) Spectral content during (top) the burst at 6 seconds (estimated in situ peak negative pressure [PNP], 0.13 MPa) and (bottom) the burst at 30.5 seconds (estimated in situ peak negative pressure, 0.28 MPa). At the higher pressure, 1.5 f0 and 2.5 f0 ultraharmonics are present. (c) Top and middle: Graphs show (top) 1.5 f0 ± 180 Hz and (middle) 2.5 f0 ± 180 Hz signal content in each burst over the duration of the sonication, normalized to the first burst (t = 0 second). Bottom: Graph shows estimated in situ pressure as a function of time. Target pressure was 50% of that to achieve ultraharmonic emissions. FFT = fast Fourier transform.
Figure 2c:
(a) Histogram of peak pressures achieved in sonications that resulted in disruption (n = 70). Bin size = 0.025 MPa. (b) Spectral content during (top) the burst at 6 seconds (estimated in situ peak negative pressure [PNP], 0.13 MPa) and (bottom) the burst at 30.5 seconds (estimated in situ peak negative pressure, 0.28 MPa). At the higher pressure, 1.5 f0 and 2.5 f0 ultraharmonics are present. (c) Top and middle: Graphs show (top) 1.5 f0 ± 180 Hz and (middle) 2.5 f0 ± 180 Hz signal content in each burst over the duration of the sonication, normalized to the first burst (t = 0 second). Bottom: Graph shows estimated in situ pressure as a function of time. Target pressure was 50% of that to achieve ultraharmonic emissions. FFT = fast Fourier transform.
Figure 2b:
(a) Histogram of peak pressures achieved in sonications that resulted in disruption (n = 70). Bin size = 0.025 MPa. (b) Spectral content during (top) the burst at 6 seconds (estimated in situ peak negative pressure [PNP], 0.13 MPa) and (bottom) the burst at 30.5 seconds (estimated in situ peak negative pressure, 0.28 MPa). At the higher pressure, 1.5 f0 and 2.5 f0 ultraharmonics are present. (c) Top and middle: Graphs show (top) 1.5 f0 ± 180 Hz and (middle) 2.5 f0 ± 180 Hz signal content in each burst over the duration of the sonication, normalized to the first burst (t = 0 second). Bottom: Graph shows estimated in situ pressure as a function of time. Target pressure was 50% of that to achieve ultraharmonic emissions. FFT = fast Fourier transform.
Disruption of BBB by Using Real-time Feedback Control
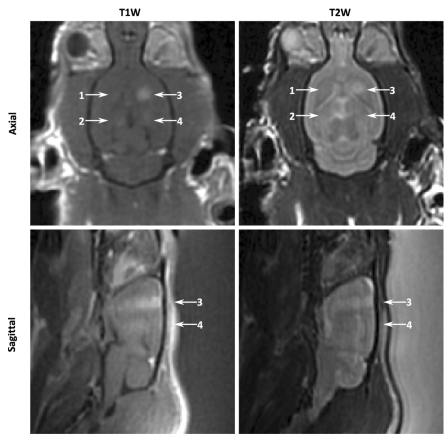
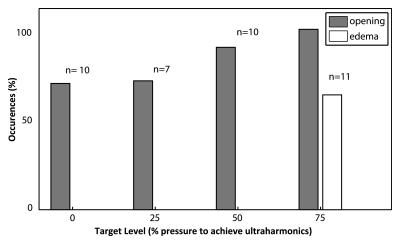
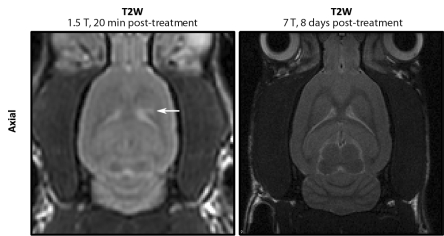
The BBB was successfully disrupted at all investigated target levels (Fig 3). At the 0% target level, there was the greatest number of unsuccessful sonications (three of 10). However, in the majority of instances, terminating the sonication immediately on detection of subharmonics was sufficient to produce some disruption. A summary of the instances of opening and instances of edema at each target level is given in Figure 3. At the 75% target level, more than 60% (seven of 11) of the sonications resulted in edema on T2-weighted images. No sonications in the group 1 animals resulted in edema on T2-weighted images for sonications at target levels of 50% or lower (n = 27). In Figure 3a, localized enhancement indicating disruption can be clearly seen at all four sonication locations on contrast-enhanced T1-weighted images. On the corresponding T2-weighted images, high signal intensity can be seen at the location corresponding to the 75% target level.
Figure 3a:
(a) Contrast-enhanced T1-weighted (T1W) and T2-weighted (T2W) MR images of group 1 rat brain after sonication. Locations 1–4 correspond to sonications at 0%, 25%, 75%, and 50%, respectively. In the axial images, the sonication direction is into the page. In the sagittal images, the sonication direction is indicated by the white arrows. (b) MR images of group 2 rat brain. Left: T2-weighted 1.5-T image obtained approximately 20 minutes after treatment shows high signal intensity at one sonication location (arrow). Right: T2-weighted 7.0-T image obtained 8 days after treatment in the same animal shows no indicators of edema.
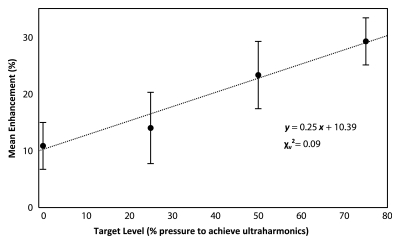
The mean enhancement values in the group 1 animals were 10.9% ± 4.1 (standard error of the mean), 14.1% ± 6.3, 23.4% ± 5.9, and 29.3% ± 4.1 at the 0%, 25%, 50%, and 75% target levels, respectively. Figure 4b shows the mean enhancement values plotted as a function of target level. Figure 4b shows a line of best fit with a reduced x2 value of 0.09, suggesting a good linear fit, although with large errors. The enhancement at both the 0% and 25% target levels was found to be significantly different than that at the 75% target level (P = .005 and P = .048, respectively). No significant difference was found between the 0% and 50% target levels (P = .1), but this could possibly be established given a greater number of sonications.
Figure 4b:
(a) Bar graph shows percentage of sonications at each target level that resulted in opening and those that resulted in edema on T2-weighted MR images. Numbers above bars = total number of sonications performed at each target level. (b) Graph shows mean enhancement as a function of targeted pressure level (percentage of the pressure required to achieve detectable ultraharmonic emissions). Error bars = standard errors of the mean. A line of best fit and its equation are shown.
Figure 4a:
(a) Bar graph shows percentage of sonications at each target level that resulted in opening and those that resulted in edema on T2-weighted MR images. Numbers above bars = total number of sonications performed at each target level. (b) Graph shows mean enhancement as a function of targeted pressure level (percentage of the pressure required to achieve detectable ultraharmonic emissions). Error bars = standard errors of the mean. A line of best fit and its equation are shown.
In the group 2 animals, BBB disruption occurred in 38 of 38 cases. There were four cases of edema in four animals on T2-weighted images 20 minutes after treatment. The mean enhancement from the combined group 1 and 2 sonications (48 locations in 27 animals) at the 50% target level was 19.6% ± 1.7. There were 47 openings in the 48 locations. Intraanimal variablity in enhancement was examined in 13 animals in which multiple sonications at the 50% target level were performed. The standard deviations of the average enhancements in these animals ranged from 0.2% to 14.2%. Ten animals had standard deviations of less than 8%, while the remaining three animals had standard deviations that ranged from 12.2% to 14.2%. Interanimal variability was examined by comparing the enhancements observed at the different sonication locations. These standard deviations were more consistent and ranged from 7.3% to 10.8%.
Safety Analysis: High-Field-Strength Imaging and Histologic Features
At 8th-day high-field-strength MR imaging follow-up, no anomalies were observed on the T2-weighted and T2*-weighted images in the surviving animals (30 locations), including those in which edema was seen immediately following treatment (Fig 3b).
Figure 3b:
(a) Contrast-enhanced T1-weighted (T1W) and T2-weighted (T2W) MR images of group 1 rat brain after sonication. Locations 1–4 correspond to sonications at 0%, 25%, 75%, and 50%, respectively. In the axial images, the sonication direction is into the page. In the sagittal images, the sonication direction is indicated by the white arrows. (b) MR images of group 2 rat brain. Left: T2-weighted 1.5-T image obtained approximately 20 minutes after treatment shows high signal intensity at one sonication location (arrow). Right: T2-weighted 7.0-T image obtained 8 days after treatment in the same animal shows no indicators of edema.
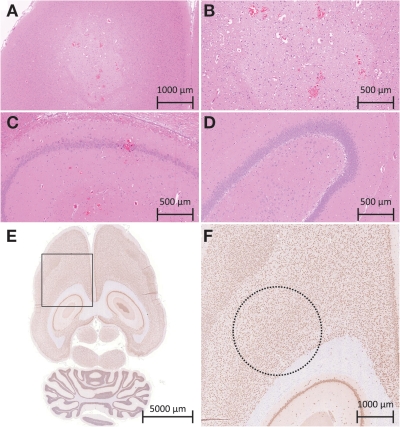
Figure 5 shows histologic slices obtained after sonications at different exposures. Histologic analysis of the acute specimens revealed that sonications at the 50% target level or lower resulted in either no apparent change in the tissue or in some extravasated red blood cells. Specimens from animals that survived to 8 days showed no gross tissue damage, even in the locations that had shown enhancement on T2-weighted images immediately after treatment. No extravasated red blood cells were observed in the survival (group 2) animals. Sonications at the 75% target level generally produced larger amounts of red blood cells and in two cases produced regions of high tissue vacuolation with sharp margin delineation (Fig 5, A, B). The vacuolations were accompanied by larger amounts of red blood cells, although without visible large vessel rupture. The sonications resulting in vacuolated tissue had also shown very high signal intensity on T2-weighted images obtained after treatment, with sharp margins on the enhanced region.
Figure 5:
A–C, Histologic slices in the acute group. A, B, Images of a 75% target level sonication location at two magnifications show a bleached area of the tissue in the sonication region, highly vacuolated tissue, and large amounts of extravasations. C, In a sonication location treated at a 50% target level, normal tissue matrix with some extravasations is visible. ( Hematoxylin-eosin stain.) D, Histologic slice in an animal sacrificed 8 days after treatment shows normal tissue matrix without extravasations. (Hematoxylin-eosin stain.) E, F, Histologic slices in an animal sacrificed 8 days after treatment show neuronal nuclei. E, Axial slice through region of BBB disruption. F, Greater detail of region in box in, E. Dashed circle = area of disruption as measured on T1-weighted MR images for a sonication that also resulted in edema on T2-weighted images obtained immediately after treatment. (NeuN antibody stain.)
At 8 days after treatment, no obvious changes in neuronal density could be seen on the NeuN-stained histologic slices in the sonicated region (Fig 5, E, F). The sonicated regions had an average of 99.7% ± 9.7 (standard deviation) of the cells in the nonsonicated adjacent tissue (minimum, 90 cells counted per region). A paired t test found no significant difference in neronal density between sonicated and nonsonicated tissue (P = .66).
Wideband emissions were not monitored in real time. Postcapture analysis showed that in some sonications, the ultraharmonic peaks were broader and slightly noisier, but overall changes in the noise floor were insufficient to allow us to conclude that inertial cavitation was occurring. Additionally, these broader peaks did not correlate with increased tissue damage, increased contrast enhancement, or the presence of edema.
Discussion
In the current study, we demonstrated that acoustic emissions from microbubbles could be controlled in real time to optimize treatment pressures used for disrupting the BBB. In our animal model, we were able to drive microbubbles to ultraharmonic oscillations without causing damage in the brain. Results with a 75% emissions target level suggest that repeated exposures at such pressure levels may be damaging to brain tissue, causing tissue vacuolation in the sonicated region. Furthermore, driving microbubbles until they exhibit ultraharmonic behavior may be a sufficient end point if moderate disruption levels are desired. Disruption at levels of 50% and lower were safely performed, with few cases of edema as indicated by T2-weighted MR images. Target levels above 50% should be avoided, as they may result in damage. In these instances, edema was not visible at MR imaging follow-up, and histologic analysis of the specimens revealed normal tissue. A linear trend was observed between disruption levels and the MR imaging contrast enhancement, and therefore this target emissions level technique may provide a means to tailor treatments for a desired amount of opening.
Sonications were performed by using continous wave bursts at 551.5 kHz, conditions that have previously been shown to induce standing waves in rat skull cavities (15). Standing waves are not required to induce BBB disruption and create high variability in the ultrasound field within the skull (15). In this study, standing wave conditions were used because the receiver used was planar and could be used to monitor the entire depth of the brain for activity. The program reacts to the first ultraharmonic event, which should theoretically occur where pressures are the highest. Distinct standing wave patterns were observed in two of 76 instances on the sagittal brain images. However, in some locations, opening was observed near the top of the skull and/or the skull base but not through the middle of the skull. In these instances, pressures sufficient to induce opening in the middle of the brain would likely have resulted in damage at these reflective interfaces. These end points therefore likely marked the safest pressures deliverable in these instances.
In the current study, the presence of subharmonics and ultraharmonics was assumed to be a threshold event. It is possible that ultraharmonic emissions during some sonications were too low to be detected by the hydrophone or were below the detection threshold of the algorithm. This could account for some small variability in the enhancement populations. Additionally, the presence of air bubbles in the water bath could result in ultraharmonic signals, causing premature treatment termination. In this case, safety is not a concern, but this could be the root of larger variations in results, including some of the cases of unsuccessful opening. In cases in which opening was not detected (n = 6), the peak pressure reached was significantly lower than that of the other sonications (0.22 MPa ± 0.02 [standard deviation] vs 0.29 MPa ± 0.04, P < .001). Five of the six failures occurred at the 0% (n = 13) or 25% (n = 12) target levels. Only one failure occurred at the 50% target level over 48 sonications, for an undertreatment rate of approximately 2.1%. However, a premature termination of the treatment is preferable to overtreatment, as seen at the 75% level, and therefore, the 50% target level may be optimal.
Our proposed algorithm demonstrates only one of several potential techniques for using microbubble emissions to control BBB disruption. Changes in the harmonic emissions, as suggested by McDannold et al (16) and Tung et al (17), were observed during this study. However, the changes were much less easy to identify in real time than the implemented solution. Further study may find a method of using the harmonics, subharmonics, and ultraharmonics for treatment control, greatly improving safety.
The current study was performed with one receiver and microbubble type at a single clinically usable frequency (24). Further work may be required to determine the robustness of the algorithm. The use of clinically relevant frequencies in small animals represents a complex treatment scenario, as it becomes difficult to avoid treating the full depth of the brain and inducing near-skull effects. Further work is required to examine the use of this algorithm in large animal models, where these effects can be avoided.
However, it appears from the results of this study that the algorithm is safe for BBB disruption investigations in small animals.
This study had several limitations. First, after detection of the ultraharmonics, the target level was maintained for the remainder of the sonication. This treatment essentially becomes open-loop for the remainder of the sonication, unless ultraharmonics are detected again. Changes in the microbubbles over the course of the treatment (growth or shrinkage from being in the vasculature) after the target level is reached were not accounted for with this approach. The BBB was consistently safely disrupted at a 50% target level, but the enhancement varied. Future work may find a fully closed-loop approach, which will reduce this variability. Second, the results are dependent on the quality of the hydrophone being used to detect the signals. Optimal target levels may vary depending on receiver bandwidth and sensitivity. New receivers must be well characterized and the program parameters tuned to account for the receiver characteristics. Receivers that are of low sensitivity may not be adequate for detecting emissions and would result in an unsafe system.
Safe disruption of the BBB with MR imaging–guided focused ultrasound is essential for translation into clinical practice, as well as for the development and testing of novel pharmaceutical agents. Microbubble contrast agents mediate focused ultrasound–induced BBB disruption, which has not been achieved by using focused ultrasound alone without inducing tissue damage (25). However, microbubble-mediated focused ultrasound can also result in tissue damage, including vessel rupture and cell apoptosis, at much lower exposures than focused ultrasound alone (26,27). With the complications introduced by the skull bone and the relatively narrow margin between disruption and damage thresholds, safe BBB disruption cannot be guaranteed with fixed exposures. This study demonstrates that the BBB can be disrupted in a repeatable and safe manner by using real-time exposure control based on acoustic emissions. This control algorithm is such that it could easily be implemented in a clinical system and could be used in patient treatments to ensure treatment effect.
Disclosures of Potential Conflicts of Interest: M.A.O. Financial activities related to the present article: none to disclose. Financial activities not related to the present article: none to disclose. Other relationships: a provisional patent application has been filed for the described algorithm. K.H. Financial activities related to the present article: none to disclose. Financial activities not related to the present article: has grants or grants pending from Philips, the Focused Ultrasound Surgery Foundation, FUS Instruments, and Artenga; is an inventor on several patents owned by Brigham and Women’s Hospital and the Sunnybrook Health Sciences Centre; owns stock or stock options in FUS Instruments and Harmonic Medical; receives support for travel expenses from Philips. Other relationships: a provisional patent application has been filed for the described algorithm.
Advances in Knowledge.
• Spectral information from acoustic emissions captured during microbubble-mediated focused ultrasound disruption of the blood-brain barrier (BBB) can be used to control applied acoustic pressures in real time.
• Real-time control of focused ultrasound allows consistent disruption of the BBB without irreversible tissue damage.
Implication for Patient Care.
• Focused ultrasound–induced BBB disruption has potential for use in treating a range of brain disorders; a real-time control technique for safe BBB disruption is essential before focused ultrasound–induced BBB disruption can be implemented in routine clinical practice.
Acknowledgments
The authors thank Shawna Rideout-Gros, RVT, and Alexandra Garces, RVT, for their help with the animal care and preparation; Milan Ganguly, MSc, for performing the histologic processing and analysis; and Rafal Janik, MSc, Ping Wu, BSc, Adam Waspe, PhD, and Vivian Sin, MASc, for their technical assistance.
Received July 6, 2011; revision requested August 30; revision received September 20; accepted September 30; final version accepted October 17.
Supported by the Canada Research Chair Program.
Funding This research was supported by the National Institutes of Health (grant EB003268).
Abbreviation:
- BBB
- blood-brain barrier
References
- 1.Pardridge WM. The blood-brain barrier: bottleneck in brain drug development. NeuroRx 2005;2(1):3–14 [DOI] [PMC free article] [PubMed] [Google Scholar]
- 2.Jordão JF, Ayala-Grosso CA, Markham K, et al. Antibodies targeted to the brain with image-guided focused ultrasound reduces amyloid-beta plaque load in the TgCRND8 mouse model of Alzheimer’s disease. PLoS ONE 2010;5(5):e10549. [DOI] [PMC free article] [PubMed] [Google Scholar]
- 3.Kinoshita M, McDannold N, Jolesz FA, Hynynen K. Noninvasive localized delivery of Herceptin to the mouse brain by MRI-guided focused ultrasound-induced blood-brain barrier disruption. Proc Natl Acad Sci U S A 2006;103(31):11719–11723 [DOI] [PMC free article] [PubMed] [Google Scholar]
- 4.Choi JJ, Wang S, Tung YS, Morrison B, 3rd, Konofagou EE. Molecules of various pharmacologically-relevant sizes can cross the ultrasound-induced blood-brain barrier opening in vivo. Ultrasound Med Biol 2010;36(1):58–67 [DOI] [PMC free article] [PubMed] [Google Scholar]
- 5.Hynynen K, McDannold N, Sheikov NA, Jolesz FA, Vykhodtseva N. Local and reversible blood-brain barrier disruption by noninvasive focused ultrasound at frequencies suitable for trans-skull sonications. Neuroimage 2005;24(1):12–20 [DOI] [PubMed] [Google Scholar]
- 6.Mei J, Cheng Y, Song Y, et al. Experimental study on targeted methotrexate delivery to the rabbit brain via magnetic resonance imaging-guided focused ultrasound. J Ultrasound Med 2009;28(7):871–880 [DOI] [PubMed] [Google Scholar]
- 7.Sheikov N, McDannold N, Sharma S, Hynynen K. Effect of focused ultrasound applied with an ultrasound contrast agent on the tight junctional integrity of the brain microvascular endothelium. Ultrasound Med Biol 2008;34(7):1093–1104 [DOI] [PMC free article] [PubMed] [Google Scholar]
- 8.Wang F, Cheng Y, Mei J, et al. Focused ultrasound microbubble destruction-mediated changes in blood-brain barrier permeability assessed by contrast-enhanced magnetic resonance imaging. J Ultrasound Med 2009;28(11):1501–1509 [DOI] [PubMed] [Google Scholar]
- 9.Xie F, Boska MD, Lof J, Uberti MG, Tsutsui JM, Porter TR. Effects of transcranial ultrasound and intravenous microbubbles on blood brain barrier permeability in a large animal model. Ultrasound Med Biol 2008;34(12):2028–2034 [DOI] [PubMed] [Google Scholar]
- 10.Yang FY, Liu SH, Ho FM, Chang CH. Effect of ultrasound contrast agent dose on the duration of focused-ultrasound-induced blood-brain barrier disruption. J Acoust Soc Am 2009;126(6):3344–3349 [DOI] [PubMed] [Google Scholar]
- 11.Zhang Z, Xia C, Xue Y, Liu Y. Synergistic effect of low-frequency ultrasound and low-dose bradykinin on increasing permeability of the blood-tumor barrier by opening tight junction. J Neurosci Res 2009;87(10):2282–2289 [DOI] [PubMed] [Google Scholar]
- 12.McDannold N, Vykhodtseva N, Raymond S, Jolesz FA, Hynynen K. MRI-guided targeted blood-brain barrier disruption with focused ultrasound: histological findings in rabbits. Ultrasound Med Biol 2005;31(11):1527–1537 [DOI] [PubMed] [Google Scholar]
- 13.Howles GP, Bing KF, Qi Y, Rosenzweig SJ, Nightingale KR, Johnson GA. Contrast-enhanced in vivo magnetic resonance microscopy of the mouse brain enabled by noninvasive opening of the blood-brain barrier with ultrasound. Magn Reson Med 2010;64(4):995–1004 [DOI] [PMC free article] [PubMed] [Google Scholar]
- 14.Cho E, Drazic J, Ganguly M, Stefanovic B, Hynynen K. Two-photon fluorescence microscopy study of cerebrovascular dynamics in ultrasound-induced blood-brain barrier opening. J Cereb Blood Flow Metab 2011;31(9):1852–1862 [DOI] [PMC free article] [PubMed] [Google Scholar]
- 15.O’Reilly MA, Huang Y, Hynynen K. The impact of standing wave effects on transcranial focused ultrasound disruption of the blood-brain barrier in a rat model. Phys Med Biol 2010;55(18):5251–5267 [DOI] [PMC free article] [PubMed] [Google Scholar]
- 16.McDannold N, Vykhodtseva N, Hynynen K. Targeted disruption of the blood-brain barrier with focused ultrasound: association with cavitation activity. Phys Med Biol 2006;51(4):793–807 [DOI] [PubMed] [Google Scholar]
- 17.Tung YS, Vlachos F, Choi JJ, Deffieux T, Selert K, Konofagou EE. In vivo transcranial cavitation threshold detection during ultrasound-induced blood-brain barrier opening in mice. Phys Med Biol 2010;55(20):6141–6155 [DOI] [PMC free article] [PubMed] [Google Scholar]
- 18.Neppiras EA. Acoustic cavitation. Phys Rep 1980;61(3):159–251 [Google Scholar]
- 19.O’Reilly MA, Hynynen KA. A PVDF receiver for ultrasound monitoring of transcranial focused ultrasound therapy. IEEE Trans Biomed Eng 2010;57(9):2286–2294 [DOI] [PMC free article] [PubMed] [Google Scholar]
- 20.Hynynen K, McDannold N, Vykhodtseva N, Jolesz FA. Noninvasive MR imaging-guided focal opening of the blood-brain barrier in rabbits. Radiology 2001;220(3):640–646 [DOI] [PubMed] [Google Scholar]
- 21.Chopra R, Curiel L, Staruch R, Morrison L, Hynynen K. An MRI-compatible system for focused ultrasound experiments in small animal models. Med Phys 2009;36(5):1867–1874 [DOI] [PMC free article] [PubMed] [Google Scholar]
- 22.Liu HL, Wai YY, Chen WS, et al. Hemorrhage detection during focused-ultrasound induced blood-brain-barrier opening by using susceptibility-weighted magnetic resonance imaging. Ultrasound Med Biol 2010;34(4):598–606 [DOI] [PubMed] [Google Scholar]
- 23.Weng JC, Wu SK, Yang FY, Lin WL, Tseng WY. Pulse sequence and timing of contrast-enhanced MRI for assessing blood-brain barrier disruption after transcranial focused ultrasound in the presence of hemorrhage. J Magn Reson Imaging 2010;31(6):1323–1330 [DOI] [PubMed] [Google Scholar]
- 24.Hynynen K, Jolesz FA. Demonstration of potential noninvasive ultrasound brain therapy through an intact skull. Ultrasound Med Biol 1998;24(2):275–283 [DOI] [PubMed] [Google Scholar]
- 25.McDannold N, Vykhodtseva N, Jolesz FA, Hynynen K. MRI investigation of the threshold for thermally induced blood-brain barrier disruption and brain tissue damage in the rabbit brain. Magn Reson Med 2004;51(5):913–923 [DOI] [PubMed] [Google Scholar]
- 26.Vykhodtseva N, McDannold N, Hynynen K. Induction of apoptosis in vivo in the rabbit brain with focused ultrasound and Optison. Ultrasound Med Biol 2006;32(12):1923–1929 [DOI] [PubMed] [Google Scholar]
- 27.McDannold NJ, Vykhodtseva NI, Hynynen K. Microbubble contrast agent with focused ultrasound to create brain lesions at low power levels: MR imaging and histologic study in rabbits. Radiology 2006;241(1):95–106 [DOI] [PubMed] [Google Scholar]


