The importance of osteoporosis is increasing in our aging society; fragility fractures may have a devastating effect on the individual, and as radiologists we have a critical role to play in preventing these.
Abstract
Osteoporosis is becoming an increasingly important public health issue, and effective treatments to prevent fragility fractures are available. Osteoporosis imaging is of critical importance in identifying individuals at risk for fractures who would require pharmacotherapy to reduce fracture risk and also in monitoring response to treatment. Dual x-ray absorptiometry is currently the state-of-the-art technique to measure bone mineral density and to diagnose osteoporosis according to the World Health Organization guidelines. Motivated by a 2000 National Institutes of Health consensus conference, substantial research efforts have focused on assessing bone quality by using advanced imaging techniques. Among these techniques aimed at better characterizing fracture risk and treatment effects, high-resolution peripheral quantitative computed tomography (CT) currently plays a central role, and a large number of recent studies have used this technique to study trabecular and cortical bone architecture. Other techniques to analyze bone quality include multidetector CT, magnetic resonance imaging, and quantitative ultrasonography. In addition to quantitative imaging techniques measuring bone density and quality, imaging needs to be used to diagnose prevalent osteoporotic fractures, such as spine fractures on chest radiographs and sagittal multidetector CT reconstructions. Radiologists need to be sensitized to the fact that the presence of fragility fractures will alter patient care, and these fractures need to be described in the report. This review article covers state-of-the-art imaging techniques to measure bone mineral density, describes novel techniques to study bone quality, and focuses on how standard imaging techniques should be used to diagnose prevalent osteoporotic fractures.
© RSNA, 2012
Introduction
In 2000, the National Institutes of Health assembled an expert panel focusing on the prevention, diagnosis, and treatment of osteoporosis (1). The consensus definition provided by this panel is still used and has had an impact on osteoporosis imaging and related research for the past decade. According to the consensus, osteoporosis is defined as a skeletal disorder characterized by compromised bone strength predisposing a person to an increased risk of fracture (1). Bone strength primarily reflects the integration of bone mineral density (BMD) and bone quality. BMD is expressed as grams of mineral per area or volume, and in any given individual is determined by peak bone mass and amount of bone loss. Bone quality refers to architecture, turnover, damage accumulation (eg, microfractures), and mineralization (1).
Though BMD is only one facet respon sible for increased fragility, dual x-ray absorptiometry (DXA) measurements of BMD have been universally adopted as a standard to define osteoporosis. In 1994 the World Health Organization (WHO) (2) used T scores to classify and define BMD measurements. A T score is the standard deviation of the BMD of an individual patient compared with a young, healthy reference population, matched for sex and ethnicity. A T score of less than −1 to greater than −2.5 is defined as osteopenia while a T score of −2.5 or lower is defined as osteoporosis. This definition, originally only intended for postmenopausal women, has been adapted and modified by the International Society for Clinical Densitometry (ISCD) as outlined below (www.iscd.org/visitors/positions/OP-Index.cfm) to classify BMD in pre- and postmenopausal women, men, and children by using DXA.
It should be noted that even in the absence of osteoporotic BMD, the presence of one or more low-impact fragility fractures is considered as a sign of severe osteoporosis (3) and that not infrequently in these patients, the BMD measured with DXA may be in the normal or osteopenic range.
Given the limitations of DXA BMD measurements, the WHO recently introduced the FRAX tool (available at www.sheffield.ac.uk/FRAX/) to better evaluate fracture risk of patients (4–6). Based on clinical risk factors and DXA BMD of the femoral neck, the FRAX tool can be used to calculate the 10-year probability of hip fracture and major osteoporotic fractures (spine, forearm, hip, or shoulder fracture). The Web-based tool includes age, ethnicity, sex, weight, height, fracture history, smoking, alcohol, glucocorticoids, and rheumatoid arthritis, and the calculation tool is available for European, Asian, Middle Eastern, and African as well as North and Latin American populations.
While BMD measured by means of DXA is the standard and state-of-the-art technique for quantifying osteoporosis, research has targeted bone quality as a parameter or biomarker, which provides information on susceptibility to fracture beyond that provided by BMD and may be used as an outcome measurement for pharmaceutical trials. Multiple innovative imaging techniques have been developed that use radiologic techniques to characterize bone architecture.
Epidemiology and Pathophysiology of Osteoporosis
Fragility fractures due to osteoporosis are one of the most substantial challenges to public health as worldwide, the elderly represent the fastest-growing age group, and the yearly number of fragility fractures will increase substantially with continued aging of the population (7). Approximately 50% of women and 20% of men older than 50 years will have a fragility fracture in their remaining lifetime in Caucasian populations (8), with potentially devastating results; in individuals who experience hip fractures, 20% will die within the next year and 20% will require permanent nursing home care (8). Even if age-adjusted incidence rates for hip fractures remain stable, the estimated number of hip fractures worldwide will rise from 1.7 million in 1990 to 6.3 million in 2050 (7).
While patients with vertebral fractures have less severe complications, it should be noted that vertebral fractures are more frequent and only 30% of these fractures come to clinical attention (7). Those that come to clinical attention are associated with substantial disability from pain and increased thoracic kyphosis. Also, it was shown that presence of one vertebral fracture leads to a 10-fold increase in risk of subsequent vertebral fractures (9); the diagnosis and treatment of vertebral fractures is therefore critical. While hip, vertebral, and wrist fractures are the most frequent fractures associated with osteoporosis, the effect of osteoporosis on the skeleton is systemic and there is a heightened risk of almost all types of fractures in patients with low bone mass (10).
The bone mass of an individual in later life is a result of the peak bone mass accrued during intrauterine life, childhood, and puberty, as well as the subsequent rate of bone loss (11). Although genetic factors strongly contribute to peak bone mass (12), environmental factors in intrauterine life, childhood, and adolescence modulate the genetically determined pattern of skeletal growth (13). Though various candidate genes (such as those encoding the vitamin-D receptor, collagen Ia1, LDL receptor–related protein 5, and estrogen receptor) have been linked to BMD, attempts to relate polymorphisms in such genes to fracture risk have generally been unsuccessful (14).
Bone loss is a result of estrogen deficiency in postmenopausal women, as well as through estrogen-independent age-related mechanisms (such as secondary hyperparathyroidism and reduced mechanical loading) (7). At the cellular level, bone loss occurs because of an imbalance between the activity of osteoclasts and osteoblasts. In adult life, the skeleton is continually remodeled in an orderly sequence of bone resorption followed by bone formation—referred to as coupling. If the processes of resorption and formation are not matched, there is a remodeling imbalance (7). Estrogen has a central role in normal physiologic remodeling, and estrogen deficiency after menopause results in a remodeling imbalance with a substantial increase in bone turnover. This imbalance leads to a progressive loss of trabecular and cortical bone, partly because of increased osteoclastogenesis.
Importance of Osteoporosis Imaging
With use of pharmacotherapy, osteoporotic fractures can be prevented. However, clear guidelines are required to initiate these therapies, as they are expensive and side effects have been associated with these therapies, such as atypical subtrochanteric fractures with alendronate (15,16). Ideally biomarkers should be available that assess fragility fracture risk with high accuracy. In addition, diagnostic techniques should be used to monitor the protective effect of pharmacotherapies, including assessing response and nonresponse to these therapies. The limitations of bone mass/density measurements in these two fields have driven the development of novel imaging biomarkers focusing on bone quality.
In addition to these quantitative tech niques dedicated to bone mass and quality assessment, standard imaging techniques need be used to diagnose prevalent osteoporotic fractures, as this will affect therapy recommendations and may prevent future fractures. Correctly diagnosing and interpreting fragility fractures with all available imaging modalities is one of the major responsibilities we have as radiologists.
Diagnostic Techniques to Measure BMD
DXA, introduced to clinical routine in 1987, is a well-standardized and easy to use technique that has a high precision (maximum acceptable precision error, 2%–2.5%) and low radiation dose (1–50 μSv, if performed with vertebral fracture assessment) and is currently the best established method to measure BMD in vivo. By using two x-ray beams with differing peak kilovoltage (30–50 and >70 keV) that allow it to subtract the soft tissue component, DXA measures areal BMD typically of the lumbar spine, proximal femur, and distal radius. With an automatic segmentation, which is checked and corrected by the operator at the spine and proximal femur, the L1–4 vertebral bodies, femoral neck, intertrochanteric and trochanteric regions are measured. The total femur region of interest is derived from femoral neck, intertrochanteric, and trochanteric regions. In addition to areal density values in grams per square centimeter, DXA provides T scores and Z scores. Z scores are standard deviations compared with an age-matched reference population, while T scores are standard deviations compared with a young adult reference population.
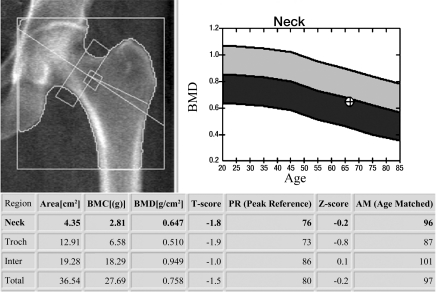
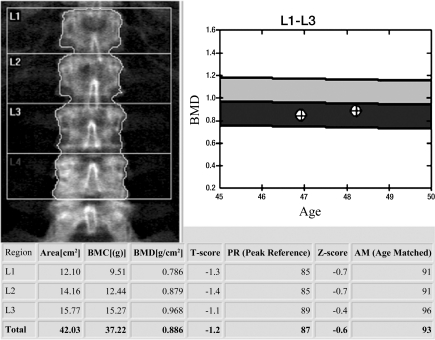
DXA BMD correlates well with the biomechanically determined bone strength, explaining approximately 70% of bone strength (1,17), and is used to define osteoporosis and osteopenia (2). This definition was originally established only for BMD of the proximal femur (neck and total femur regions of interest) (Fig 1a) but is currently also used for lumbar spine (anteroposterior projection) (Fig 1b) and distal radius (1/3 radius region of interest) DXA. The WHO definition applies to postmenopausal women but according to ISCD guidelines these definitions may also be used for men older than 50 years (18–20). In addition the ISCD has introduced guidelines for DXA of premenopausal women, men younger than 50 years, and children (18–20). In these populations Z scores are used comparing individual BMD measurements to age-matched reference populations; a Z score lower than −2 is defined as “below the expected range for age.” It should be noted that osteoporosis cannot be defined by using DXA BMD alone in these populations.
Figure 1a:
DXA studies of the (a) proximal femur and (b) lumbar spine. (a) In the proximal femur of a 66-year-old woman, the lowest T score of total and femoral neck regions of interest is used to classify the bone as normal, osteopenic, or osteoporotic. In this postmenopausal woman the T score was −1.8, which is in the osteopenic range. (b) L1–4 in the lumbar spine of a 48-year-old woman are analyzed. Vertebral bodies that are deformed or degenerated (such as L4 in this study) are excluded. A T score of −1.2 is in the osteopenic range. Also note in the graph to the right of the lumbar spine radiograph the BMD from the previous DXA study is listed and a mild increase in BMD is demonstrated.
Figure 1b:
DXA studies of the (a) proximal femur and (b) lumbar spine. (a) In the proximal femur of a 66-year-old woman, the lowest T score of total and femoral neck regions of interest is used to classify the bone as normal, osteopenic, or osteoporotic. In this postmenopausal woman the T score was −1.8, which is in the osteopenic range. (b) L1–4 in the lumbar spine of a 48-year-old woman are analyzed. Vertebral bodies that are deformed or degenerated (such as L4 in this study) are excluded. A T score of −1.2 is in the osteopenic range. Also note in the graph to the right of the lumbar spine radiograph the BMD from the previous DXA study is listed and a mild increase in BMD is demonstrated.
DXA is indicated in women aged 65 years and older, as well as in younger and perimenopausal women with risk factors for fragility fractures (19). In addition, men 70 years and older and younger men with risk factors for fracture should undergo DXA. Interestingly, individuals being considered for pharmacologic therapy and those being treated should also be examined with DXA (19). Follow-up DXA scans every 1–2 years are used frequently in clinical practice to verify response to treatment. The least significant change that is detected depends on the reproducibility of the measurement; the most reliable site is the spine, but a BMD change of around 5% is needed to ensure a therapy effect that exceeds the least significant change (21). It should be noted that guidelines for bone densitometry may vary between countries, as does DXA availability.
DXA has some pertinent disadvantages that need to be considered: (a) It is a two-dimensional (2D) measurement, which only measures density/area (in grams per square centimeter) and not the volumetric density (in milligrams per cubic centimeter) such as with quantitative computed tomography (CT). Areal BMD is susceptible to bone size and will thus overestimate fracture risk in individuals with small body frame, who will have lower areal BMD than normal-sized individuals. (b) Spine and hip DXA are also sensitive to degenerative changes, and individuals with substantial degenerative disease will have increased areal density, which will suggest a lower fracture risk than is actually present. All structures overlying the spine, such as aortic calcifications, or morphologic abnormalities, such as after laminectomy at the spine, will affect BMD measurements; it is also critical to check DXA images for artifacts, which may alter BMD values.
Though quantitative CT was introduced and studied prior to DXA (22,23) it never gained the same prominence. To perform quantitative CT, a standard CT scanner with a calibration phantom underneath the patient is used and density values measured in Hounsfield units are transformed into BMD measured in milligrams hydroxyapatite per cubic centimeter by using a phantom. Typically the L1–3 vertebral bodies are measured, and there are single-section and volumetric techniques to measure the density; in addition, volumetric techniques are available to measure proximal femur BMD. Quantitative CT has some important advantages over DXA: (a) It allows true volumetric measurements of the lumbar spine and proximal femur, which are independent of the body size (Fig 2), (b) it provides purely trabecular bone measurements, which are more sensitive to monitoring changes with disease and therapy (24), and (c) cross-sectional studies have shown that quantitative CT BMD of the spine allows better discrimination of individuals with fragility fractures (25,26). In addition it should be noted that DXA has limitations in measuring BMD in patients with a body mass index over 25 kg/m2; in obese patients, superimposed soft tissue will elevate measured BMD owing to attenuation of the x-ray beams and beam hardening artifact (27–29).
Figure 2a:
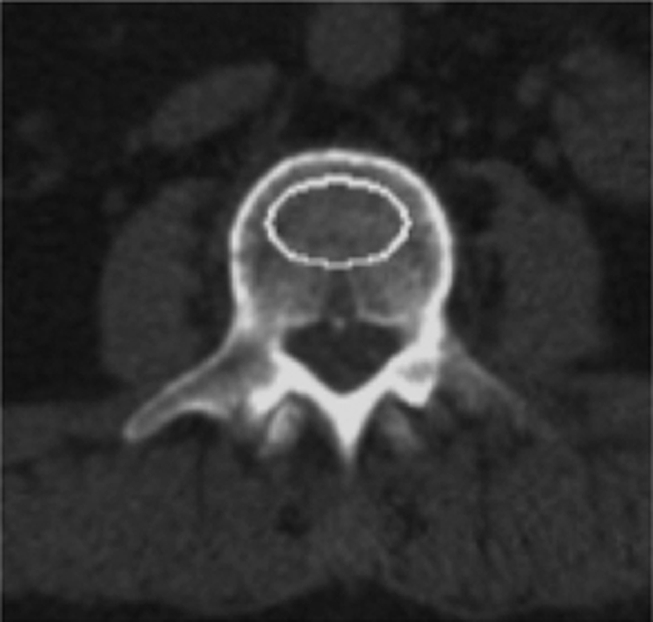
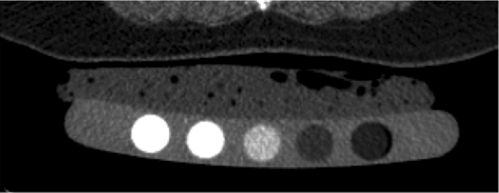
Volumetric quantitative CT scans of the lumbar spine (L3 vertebral body) obtained in a 64-year-old man show (a) axial source image and (b) sagittal and (c) coronal reformation. In addition a five-element calibration phantom is shown in d, which was used to transform Hounsfield units into milligrams hydroxyapatite per milliliter (BMD).
Figure 2b:
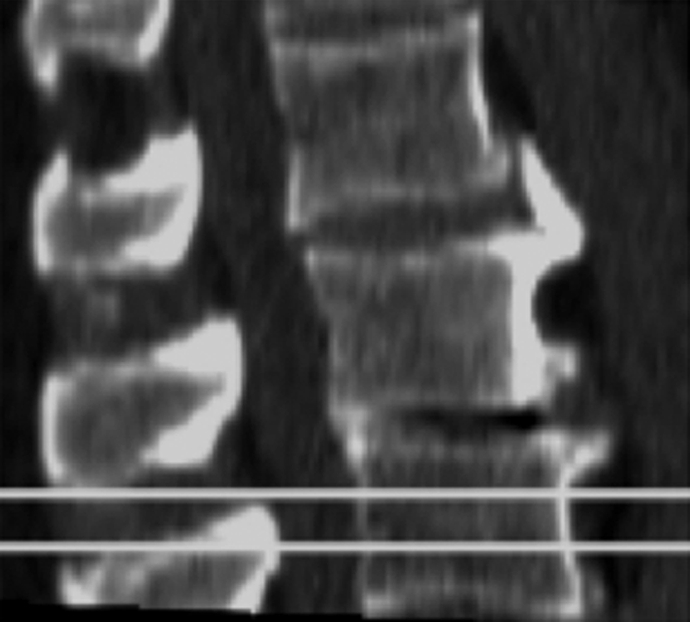
Volumetric quantitative CT scans of the lumbar spine (L3 vertebral body) obtained in a 64-year-old man show (a) axial source image and (b) sagittal and (c) coronal reformation. In addition a five-element calibration phantom is shown in d, which was used to transform Hounsfield units into milligrams hydroxyapatite per milliliter (BMD).
Figure 2c:
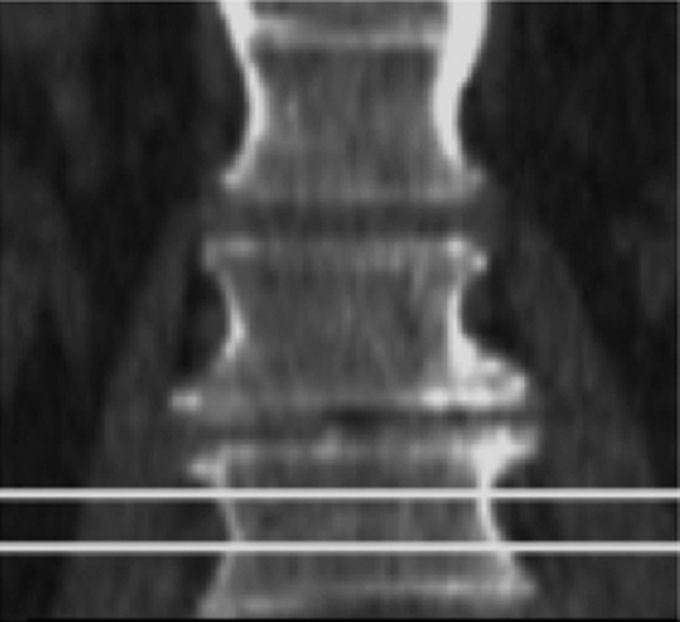
Volumetric quantitative CT scans of the lumbar spine (L3 vertebral body) obtained in a 64-year-old man show (a) axial source image and (b) sagittal and (c) coronal reformation. In addition a five-element calibration phantom is shown in d, which was used to transform Hounsfield units into milligrams hydroxyapatite per milliliter (BMD).
Figure 2d:
Volumetric quantitative CT scans of the lumbar spine (L3 vertebral body) obtained in a 64-year-old man show (a) axial source image and (b) sagittal and (c) coronal reformation. In addition a five-element calibration phantom is shown in d, which was used to transform Hounsfield units into milligrams hydroxyapatite per milliliter (BMD).
Pertinent disadvantages of quantitative CT are a higher radiation dose (0.06–2.9 mSv), a limited number of longitudinal scientific studies assessing how quantitative CT predicts fragility fractures, and most of all that T scores should not be used to define osteoporosis with quantitative CT. A T score threshold of −2.5 for quantitative CT would identify a much a higher percentage of osteoporotic subjects and has therefore never been established for clinical use. Currently volumetric quantitative CT techniques are state of the art (30–33), and in clinical routine absolute measurements of volumetric BMD to characterize fracture risk have been used (110–80 mg/cm3 = mild increase in fracture risk, 80–50 mg/cm3 = moderate increase in fracture risk, and <50 mg/cm3 = severe increase in fracture risk). Recommendations for the use of quantitative CT instead of DXA are (a) in very small or large individuals, (b) in older individuals with expected advanced degenerative disease of the lumbar spine or morphologic abnormalities, and (c) if high sensitivity to monitor metabolic bone change is required, such as in patients treated with parathyroid hormone or corticosteroids. A recent study comparing DXA and quantitative CT in older men with diffuse idiopathic skeletal hyperostosis (DISH) demonstrated that quantitative CT was better suited to differentiate between men with and those without vertebral fractures (34); DISH is a condition that is frequently found in older individuals.
Other densitometric techniques for the peripheral skeleton have been described but have limited importance clinically. These include peripheral DXA (35), peripheral quantitative CT (36), and digital x-ray radiogrammetry (37). These techniques may be used in primary care environments, as they are inexpensive and convenient; however, the different types of measurement often correlate poorly, creating a barrier to consensus on the best use of peripheral measurements (21).
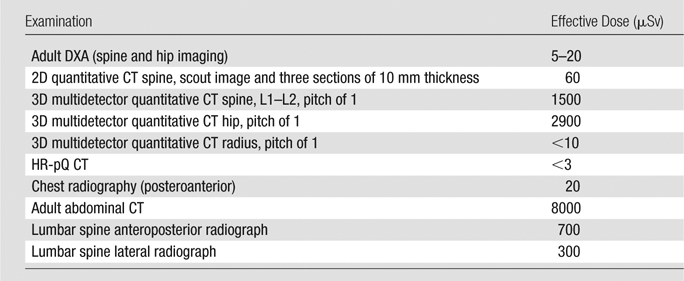
The effective radiation doses for bone densitometry measurements overall are relatively low compared with standard radiographic examinations (Table) (38). However, while DXA effective doses are on the order of 1–50 mSv, effective doses for volumetric three-dimensional (3D) quantitative CT studies may be on the order of 1.5–2.9 mSv.
Effective Doses for DXA, Quantitative CT, and HR-pQ CT
Diagnostic Techniques to Measure Bone Quality
Compared with BMD measurements, which are well standardized and part of clinical routine, techniques to measure bone quality in vivo are more challenging and, except for quantitative ultrasonography (US), are research applications. Advanced radiologic modalities such as magnetic resonance (MR) imaging and MR spectroscopy, multidetector CT, and high-resolution peripheral quantitative (HR-pQ) CT have been developed and optimized to quantify bone architecture, metabolism, and function with the goals of better predicting bone strength and more sensitively monitoring therapeutic interventions. In addition to these advanced techniques, quantitative US has been extensively studied as a measure of bone quality.
High-Resolution Peripheral Quantitative CT
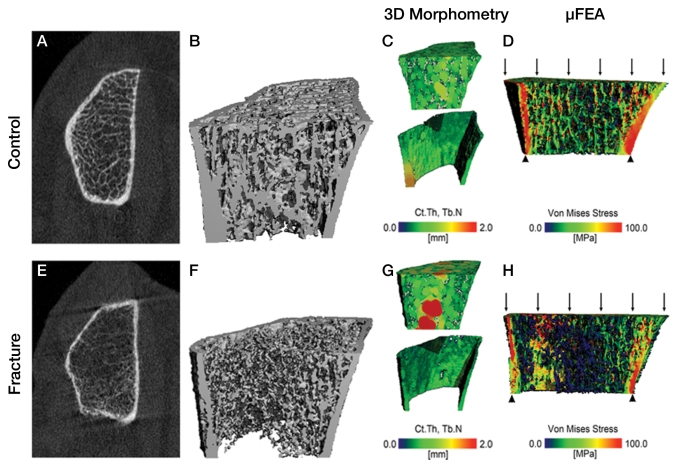
One of the most exciting developments to assess bone architecture over the past 10 years has been the introduction of HR-pQ CT (39–43) (Figs 3, 4). The dedicated extremity imaging system designed for imaging of trabecular and cortical bone architecture is currently available from a single manufacturer (XtremeCT; Scanco Medical AG, Brüttisellen, Switzerland) and was developed based on experimental micro-CT technology. This device has the advantage of substantially higher signal-to-noise ratio and spatial resolution compared with multidetector CT and MR imaging (nominal isotropic voxel dimension of 82 μm) (43). (By comparison, multidetector CT has a maximum in-plane spatial resolution of 250–300 μm and MR imaging of 150–200 μm, with section thicknesses of 0.5–0.7 and 0.3–0.5 mm, respectively). Furthermore, the effective radiation dose is substantially lower compared with whole-body multidetector CT and primarily does not involve critical, radiosensitive organs (effective dose,<,3 μSv). The scan time for HR-pQ CT is approximately 3 minutes for each scan of the tibia and femur.
Figure 3:
HR-pQ CT imaging studies of the distal radius in two postmenopausal women aged 63 and 68 years illustrate bone quality differences between a healthy control subject (top) and a patient with a history of hip and forearm fragility fractures (bottom). A, E, The 2D tomograms and B, F, 3D surface renderings illustrate dramatic differences in cortical and trabecular structure. C, G, These bone quality differences can be quantified by using 3D morphometry to determine cortical thickness (Ct.Th) and trabecular number (Tb.N, the inverse of the intertrabecular distances): The healthy individual exhibits a homogeneous trabecular structure and relatively thick cortex, while the fracture patient has a more heterogeneous distribution of trabeculae and thin cortex. D, H, Microfinite element analysis simulating a 1% compressive load illustrates the irregular distribution of stresses in the fracture subject compared with a more homogeneous distribution in the healthy control subject. (Image courtesy of Andrew Burghardt.)
Figure 4a:
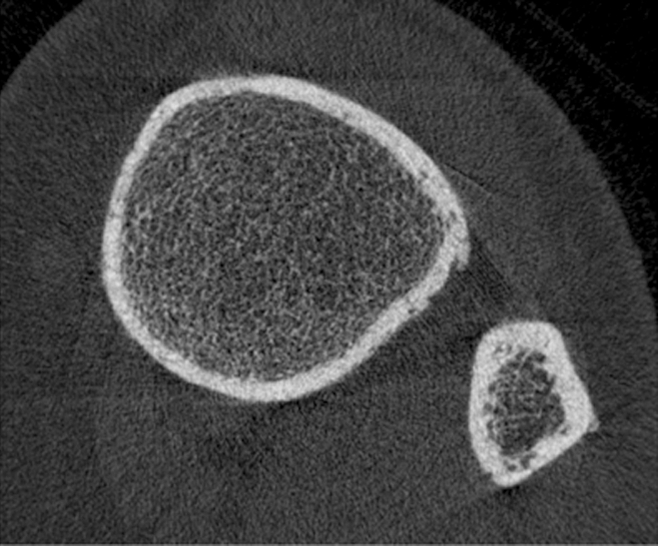
HR-pQ CT images of the distal tibia in (a) a healthy postmenopausal woman aged 61 years and (b) a postmenopausal diabetic woman aged 65 years with fragility fracture. Note differences in cortical bone porosity, which is increased in the diabetic fracture patient (arrows). Trabecular bone architecture is more scarce in the fracture patient. Both findings contribute to increased fracture risk.
Figure 4b:
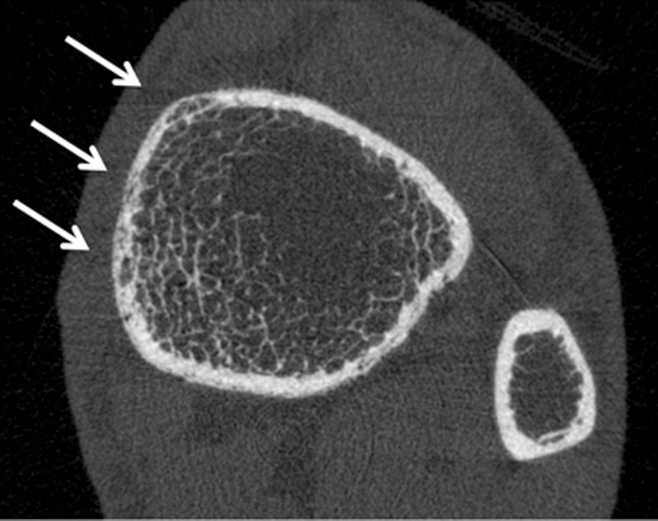
HR-pQ CT images of the distal tibia in (a) a healthy postmenopausal woman aged 61 years and (b) a postmenopausal diabetic woman aged 65 years with fragility fracture. Note differences in cortical bone porosity, which is increased in the diabetic fracture patient (arrows). Trabecular bone architecture is more scarce in the fracture patient. Both findings contribute to increased fracture risk.
There are several disadvantages to this technology, most notably that it is limited to peripheral skeletal sites and therefore can provide no direct insight into bone quality in the lumbar spine or proximal femur–common sites for osteoporotic fragility fractures (43). Only a limited region of the distal radius and tibia may be scanned in one pass (9.02 mm in length with 110 sections). In addition, the scanner tube has a limited life span and motion artifacts sometimes limit morphologic analysis of the bone architecture.
The advantages of the system are that it allows acquisition of BMD, trabecular, and cortical bone architecture at the same time. A semiautomatic standard protocol provided by the manufacturer is used for image analysis; the segmentation process is initiated by the operator and automatically adjusted by using an edge detection process to precisely identify the periosteal boundary. The cortical bone compartment is segmented by using a 3D Gaussian smoothing filter followed by a simple fixed threshold. The trabecular compartment is identified by digital subtraction of the cortical bone from the region enclosed by the periosteal contours. Based on this semiautomated contouring and segmentation process, the trabecular and cortical compartments are segmented automatically for subsequent densitometric, morphometric, and biomechanical analyses.
A five-cylinder hydroxyapatite calibration phantom is used to generate volumetric BMD separately for cortical and trabecular bone compartments similarly to central QCT. Morphometric indexes analogous to classic histomorphometry as well as connectivity, structure model index (a measure of the rod- or platelike appearance of the structure), and anisotropy can be calculated from the binary images of the trabecular bone. In addition, finite element analysis can be applied to these data sets and apparent biomechanical properties (eg, stiffness, elastic modulus) can be computed by decomposing the trabecular bone structure into small cubic elements (ie, the voxels) with assumed mechanical properties (44–46) (Fig 3). Reproducibility of HR-pQ CT densitometric measures is high (coefficient of variation <1%), while biomechanical and morphometric measures typically have a coefficient of variation of 4%–5% (39,47,48).
A number of clinical studies have been performed that have shown promising results in differentiating postmenopausal women and older men with from those without fragility fractures (39,49) as well as in monitoring therapeutic interventions (41,50). It was also found that trabecular and cortical subregional analysis may provide additional information in characterizing sex- and age-related bone changes (51). Recently structural analysis of cortical bone has been introduced to the study of HR-pQ CT data sets, and cortical porosity measurements have been developed (44). A recent study suggested that cortical porosity measurements may be useful to assess increased fracture risk in patients with diabetes (52) (Fig 4). Patients with type 2 diabetes are at higher risk for fragility fractures, yet DXA BMD in patients with diabetes is increased and is therefore not well-suited to diagnose fracture risk (53).
Multidetector CT
Multidetector CT is standard in clinical practice, with superior spatial resolution compared with previous spiral CT scanners. For imaging of trabecular bone structure, however, spatial resolution is still limited, given a minimum section thickness on the order of 0.6 mm with minimum pixel sizes of 0.25–0.3 mm2 (54). With this spatial resolution, imaging of individual trabeculae (measuring approximately 0.05–0.2 mm in diameter) is subject to substantial partial volume effects; however, it has been shown that trabecular bone parameters obtained with this technique correlate with those determined on contact radiographs from histologic bone sections and micro-CT (55,56).
An advantage of multidetector CT compared with HR-pQ CT is access to central regions of the skeleton such as the spine and proximal femur, sites at risk for fragility fractures, where monitoring of therapy may be most efficient. However, to achieve adequate spatial resolution and image quality the required radiation exposure is substantial, which offsets the technique’s applicability in clinical routine and scientific studies (38,57). High-spatial-resolution multidetector CT requires considerably higher radiation doses compared with standard techniques for measuring BMD. Compared with the 0.001–0.05-mSv effective dose associated with DXA in adult patients and 0.06–0.3 mSv delivered through 2D quantitative CT of the lumbar spine, protocols used to examine vertebral bone structure with high-spatial-resolution multidetector CT provide an effective dose of approximately 3 mSv (57,58).
Clinical studies have demonstrated that multidetector CT–derived structure measures at the proximal femur and lumbar spine improve differentiation between osteoporotic patients with proximal femur fractures and healthy control patients (59) (Fig 5) as well as individuals with and those without osteoporotic spine fractures (58). In addition the technique was shown to be well suited for monitoring teriparatide-associated changes of vertebral microstructure (57). Recently Keaveny et al (60–62) used finite element analysis to study vertebral body strength and therapy-related changes in multidetector CT data sets of the spine and proximal femur; the results of this work suggested improved monitoring of treatment effects compared with DXA and greater sensitivity in fracture risk assessment.
Figure 5:
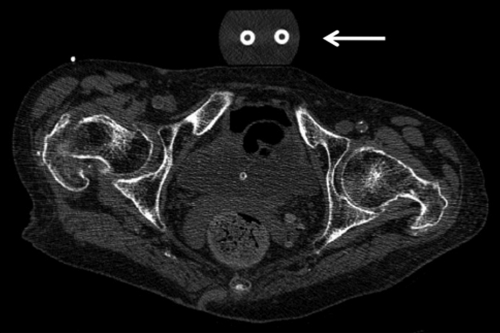
Multidetector CT scan (section thickness, 0.625 mm, reconstructed at 1.25 mm; in-plane spatial resolution, 0.486 × 0.486 mm2; standard bone kernel algorithm used to reconstruct the axial images) of bilateral hips used for texture analysis of the proximal femur in a postmenopausal woman. Patient had a fragility fracture at the right hip, and the trabecular texture of the left hip is analyzed. A morphologic calibration phantom is located anterior to the pelvis (arrow) (52).
MR Imaging
Advances in MR imaging software and hardware including 3-T imaging and improved coil design have allowed substantially enhanced trabecular bone architecture imaging. Calibration and validation studies have demonstrated that MR-derived trabecular structure measures correlate with histology, micro-CT, and biomechanical strength derived from in vitro studies (63–66). Lack of radiation makes MR imaging attractive in particular for scientific and clinical studies. However, to date, the technique has been mainly established for peripheral imaging of the distal radius, tibia, and calcaneus (Fig 6). Initial studies have focused on the proximal femur, yet this site is challenging, and visualization of trabecular bone architecture is still limited (64,67). Also, spatial resolution with MR imaging is in the range of trabecular dimensions (in-plane resolution, 0.15–0.3 mm2; section thickness, 0.3–1 mm), which results in substantial partial volume effects, and long acquisition times make imaging susceptible to motion artifacts.
Figure 6:
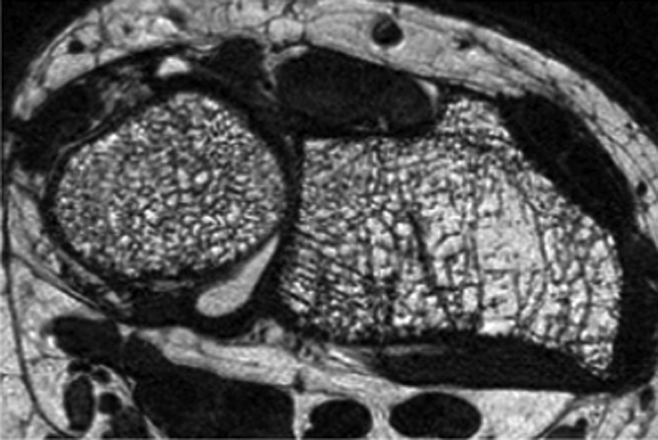
Distal radius high-spatial-resolution MR image (voxel size: 0.156 × 0.156 × 0.5 mm3) obtained at 3.0 T with a fully balanced steady-state free precession sequence and a transmit-receive quadrature wrist coil in a 55-year-old postmenopausal woman. Heterogeneity of trabecular bone architecture and focal loss of trabecular bone are well demonstrated.
A number of clinical studies were performed that demonstrated that MR imaging–derived structure measures provided additional information to BMD in differentiating individuals with from those without fragility fractures (68–72). In addition to postmenopausal women, trabecular bone was studied with MR imaging in hypogonadal men, patients with cardiac and renal transplants, and patients with renal osteodystrophy (72–76). Longitudinal studies with MR imaging–derived structure measures demonstrated the feasibility of the technique in monitoring the effect of therapeutic interventions. Chesnut et al (77) showed that salmon calcitonin nasal spray had therapeutic benefit compared with placebo in maintaining trabecular microarchitecture at multiple skeletal sites, while Benito et al (73) demonstrated that testosterone replacement in hypogonadal men improved trabecular architecture. Interestingly it was also noted that structure parameters obtained from HR-pQ CT were not directly comparable with those determined from high-spatial-resolution MR studies (78); in particular the morphologic parameters, trabecular bone fraction, and trabecular thickness exhibited large discrepancies (MR/HR-pQ CT = 3–4). One of the main causes for this discrepancy is the presence of susceptibility artifacts with MR imaging, which amplify the size of individual trabeculae. Folkesson et al (79) found longitudinal changes in MR-derived bone microarchitecture due to bisphosphonate therapy in perimenopausal women treated for 24 months with alendronate, yet these were different from those found by using HR-pQ CT measurements.
Recently ultrashort-echo-time (UTE) imaging techniques for quantification of water content of the cortical bone to assess bone quality were developed. UTE imaging allows detection of signal components with T2 relaxation times on the order of only a few hundred microseconds, which are found in highly ordered tissues such as cortical bone and tendons and cannot be detected with conventional imaging techniques (80). Techawiboonwong et al (81) validated UTE imaging in bone specimens with an isotope exchange experiment and studied the right tibial midshaft in pre- and postmenopausal women and patients undergoing hemodialysis. The quantitative analysis showed that bone water content was 135% higher in the patients undergoing maintenance dialysis than in the premenopausal women and was 43% higher than in the postmenopausal women. Interestingly no substantial differences were found in tibial volumetric BMD between patients undergoing hemodialysis and pre- and postmenopausal normal controls. This increase in water content was explained by abnormal cortical porosity and microscopic pores being filled with water. Abnormal porosity was related to renal osteodystrophy in these patients undergoing maintenance dialysis and was also demonstrated in an experimental study in rats after nephrectomy (82).
MR Spectroscopy and Perfusion
Bone marrow is critical to the viability and strength of trabecular and cortical bone. Recently there has been substantial interest in better understanding the role of bone marrow fat in osteoporosis. Researchers have provocatively asked the question whether osteoporosis is obesity of bone, as conditions with increased fracture risk such as diabetes mellitus, immobility, and glucorticoid therapy are associated with bone marrow adiposity (83). Proton MR spectroscopy has been proposed as a promising candidate for quantifying marrow adiposity noninvasively (84–86), which can be easily integrated into routine clinical procedures. In contrast to the qualitative evaluation of red marrow versus yellow marrow provided by conventional MR imaging, MR spectroscopy provides quantitative assessment of water and fat content in bone marrow. Furthermore, MR spectroscopy can provide information on different compartments of lipids in marrow, such as saturated lipids versus unsaturated lipids (87). Previous studies have shown that bone marrow fat as measured with MR spectroscopy increased with decreasing BMD measured with DXA and was significantly elevated in postmenopausal women and older men (84,85,88). While these studies focused on the relationship between bone marrow fat and DXA BMD, recent research from the University of California at San Francisco has indicated a correlation between bone marrow fat and HbA1c in patients with type 2 diabetes, suggesting that bone marrow fat may provide information on how well diabetes is controlled.
In addition to bone marrow fat, bone marrow perfusion was also identified as a potential biomarker for bone quality (85,89). Dynamic contrast-enhanced MR imaging can be used to measure perfusion indexes such as maximum enhancement and enhancement slope of bone marrow. Griffith et al (85,89) demonstrated significantly decreased vertebral and proximal femur marrow perfusion indexes in postmenopausal women with osteoporosis compared with healthy women and those with osteopenia.
Quantitative US
A recent meta-analysis on osteoporosis screening found that both DXA and calcaneal quantitative US could be used to predict fractures in an older patient population but that the correlation between the two techniques was low (90). Quantitative US is a low-cost technique performed with dedicated scanners acquiring data mostly at the calcaneus. Using a water bath or US jelly, an emitter and receiver probe are brought in close proximity to the soft tissue surrounding the bone (eg, calcaneus) and the propagation of ultrasound waves through the bone is measured, which is characterized by the velocity of transmission and the amplitude of the ultrasound signal. Velocity is measured as meters per second and defined as speed of sound; this is independent of ultrasound wave attenuation. Speed of sound decreases in osteoporotic bone. In addition, broadband ultrasound attenuation is calculated in decibels per megahertz, which increases in osteoporotic bone.
The strong power of quantitative US to predict osteoporotic fractures has suggested that the technique may be well suited to assess bone quality (91). However, the proliferation of quantitative US devices that are technologically diverse, measuring and reporting variable bone parameters in different ways, examining different skeletal sites, and having differing levels of validating data for association with DXA-measured BMD and fracture risk, has created many challenges in applying quantitative US for use in clinical practice (92).
It has been shown that ultrasound velocity reflects the material properties of bone, such as elastic modulus and compressive strength, and that it is influenced by its density, architecture, and elasticity (93). Quantitative US devices generate pulsed acoustic waves with a frequency between 500 kHz and 1.25 MHz according to the manufacturer, which is considerably lower than the frequencies commonly used in imaging US. Dedicated scanners for calcaneus, phalanges, and tibia are available, with most studies being performed at the calcaneus and phalanges.
While quantitative US has been shown to differentiate individuals with from those without fragility fractures (94,95) and to predict fracture risk (96,97), it has not been established to diagnose osteoporosis such as DXA has and it is currently not recommended to monitor treatment response according to the ISCD official positions (92), as the number of large-scale studies describing the efficacy of quantitative US in monitoring the effects of treatments is limited.
Detection of Fragility Fractures by Using Radiologic Techniques
The diagnosis of fragility fractures is critical for patient management in osteoporosis, and presence of fragility fracture requires therapy. However, vertebral fractures are frequently asymptomatic and may therefore easily be missed or misinterpreted as an incidental finding that is not clinically relevant on standard images obtained for other indications. In 2000, a study (98) published in Osteoporosis International received major public attention; the study raised substantial concern that vertebral fractures are being inadequately reported by radiologists. In this study, Gehlbach et al (98) reviewed the posteroanterior and lateral chest radiographs of 934 women aged 60 years and older who had been admitted to the hospital. Moderate or severe vertebral fractures were identified in 132 study subjects (14.1%), but only 50% of the radiology reports identified a fracture as present, and only 17 (1.8%) of the 934 patients had a discharge diagnosis of vertebral fracture. As a consequence, relatively few of these patients with vertebral fractures received appropriate osteoporosis-specific pharmacotherapy to prevent further fracture. Subsequently other studies were published with similar findings (99,100). Kim et al (99) analyzed the posteroanterior and lateral chest radiographs of 100 randomly selected patients 60 years or older who presented to the emergency department of a tertiary care hospital. A clinically important vertebral fracture was defined as one that was at least moderate to severe (loss of height ≥ 25%). The prevalence of moderate to severe vertebral fractures was 22%. However, only 55% (12 of 22) of these vertebral fractures were mentioned in the official radiology reports.
These studies demonstrated that lateral chest radiography has the potential to reveal previously undiagnosed vertebral fractures but that radiologists have limited awareness of the importance of these findings. This resulted in the Vertebral Fracture Initiative by the International Osteoporosis Foundation and the European Society of Skeletal Radiology to raise awareness and teach radiologists how to diagnose osteoporotic fractures. Web-based teaching materials are now available online on how to correctly classify osteoporotic vertebral fractures (www.iofbonehealth.org/vfi/index-flash.html).
An international standard for the classification of vertebral osteoporotic fractures is the semiquantitative grading system, developed by Genant et al (101), which is recommended by most societies such as the ISCD, International Osteoporosis Foundation, and European Society of Skeletal Radiology. According to this grading system, a vertebral deformity of T4-L4 with more than 20% height loss and a 10%–20% area of height reduction is defined as a fracture. This approach was applied and tested extensively in a number of clinical drug trials and epidemiologic studies (102,103). Four grades are differentiated: grade 0, no fracture; grade 1, mild fracture (reduction in vertebral height of 20%–25%, compared with adjacent normal vertebrae); grade 2, moderate fracture (reduction in height of 25%–40%); and grade 3, severe fracture (reduction in height of more than 40%). Wedge-shaped and biconcave fracture deformities are most common in osteoporosis, while posterior vertebral fractures should always raise concern for neoplastic/metastatic vertebral body infiltration (104). While the semiquantitative grading system is most widely used, it should be noted that a number of other methods were also developed for grading osteoporotic fractures (105), including the Algorithm Based Qualitative Definition (106), which focuses on radiologic evidence of change at the vertebral endplate as the primary indicator of fracture.
Standard multidetector CT has also been identified as an important imaging modality to diagnose incidental osteoporotic vertebral fractures (107,108). Axial sections are limited in the diagnosis of vertebral fractures, yet sagittal and coronal reconstructions are now part of the standard imaging protocol in many institutions and demonstrate fracture deformities well. In addition, lateral digital “scout” radiographs provide information on vertebral fracture deformities. In a previous study (107), axial images and sagittal reformations obtained from routine abdominal and thoracoabdominal multidetector CT scans in 112 postmenopausal women were analyzed by two radiologists in consensus and the findings were compared with those in the official radiology reports. Osteoporotic vertebral deformities were found on the sagittal reformations in 27 patients, but only six of these deformities were shown in the axial images and none were diagnosed in the official radiology report. The authors concluded that sagittal reformations of standard multidetector CT images provide important additional information on osteoporotic vertebral deformities and should be part of standard CT analyses. In a similar study, Williams et al (108) found that 38 (19.8%) of 192 patients had moderate to severe vertebral fractures and in only five patients were these correctly reported in the initial CT reports. Consequently Williams et al stated that incidental osteoporotic vertebral fractures are underreported at CT and that sagittal reformations are strongly recommended to improve the detection rate.
In addition to chest radiography and multidetector CT, DXA has also been established to assess vertebral fractures (109) and is recommended in postmenopausal women older than 70 years, men older than 80 years, and patients with height loss and diseases associated with increased risk of vertebral fractures (18).
During the past decade a number of publications focused on osteoporotic insufficiency fractures and demonstrated that findings previously identified as osteonecrosis are indeed insufficiency fractures (110–115). Insufficiency fractures at the medial femoral condyle of the knee and femoral head are both frequent findings in older individuals and indicate increased fragility of the skeleton (Fig 7). Fragility fractures of the sacrum have been misinterpreted as neoplastic lesions, and several previous studies (110,111,116) focused on the importance of correctly diagnosing sacral fractures to avoid misguiding patient management, which may produce dangerous and costly interventional procedures.
Figure 7a:
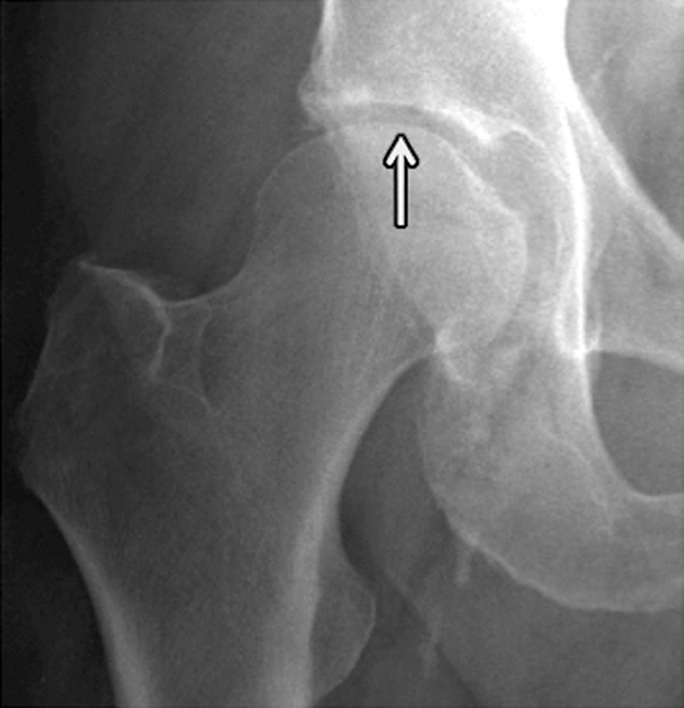
Insufficiency fracture of the femoral head. (a, b) Increasing joint space narrowing (arrow) is demonstrated on right hip radiographs over a period of 12 months in a 78-year-old man with increasing clinical symptoms. (c) Axial fluid-sensitive intermediate-weighted fast spin echo image obtained at 12 months shows fracture lines at the posterior aspect of the femoral head (arrow) and a substantial amount of bone marrow edema pattern. (d) Sagittal T1-weighted fast spin echo image of the lumbar spine depicts multiple endplate fractures (arrows) indicating increased fragility of the spine.
Figure 7b:
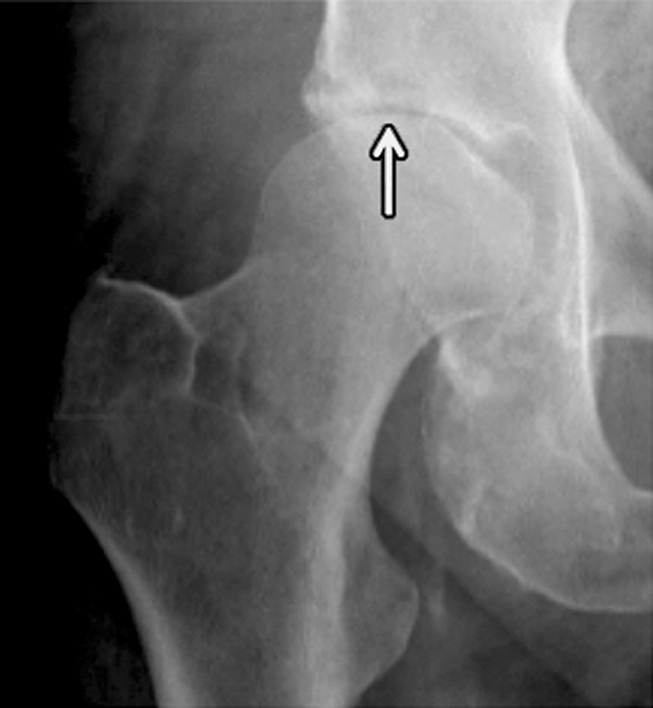
Insufficiency fracture of the femoral head. (a, b) Increasing joint space narrowing (arrow) is demonstrated on right hip radiographs over a period of 12 months in a 78-year-old man with increasing clinical symptoms. (c) Axial fluid-sensitive intermediate-weighted fast spin echo image obtained at 12 months shows fracture lines at the posterior aspect of the femoral head (arrow) and a substantial amount of bone marrow edema pattern. (d) Sagittal T1-weighted fast spin echo image of the lumbar spine depicts multiple endplate fractures (arrows) indicating increased fragility of the spine.
Figure 7c:
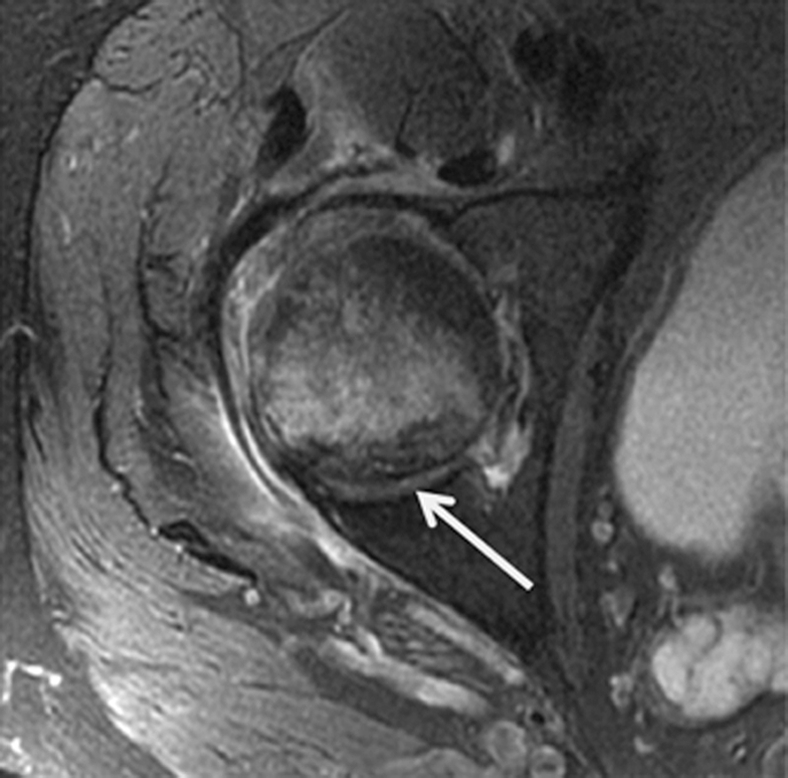
Insufficiency fracture of the femoral head. (a, b) Increasing joint space narrowing (arrow) is demonstrated on right hip radiographs over a period of 12 months in a 78-year-old man with increasing clinical symptoms. (c) Axial fluid-sensitive intermediate-weighted fast spin echo image obtained at 12 months shows fracture lines at the posterior aspect of the femoral head (arrow) and a substantial amount of bone marrow edema pattern. (d) Sagittal T1-weighted fast spin echo image of the lumbar spine depicts multiple endplate fractures (arrows) indicating increased fragility of the spine.
Figure 7d:
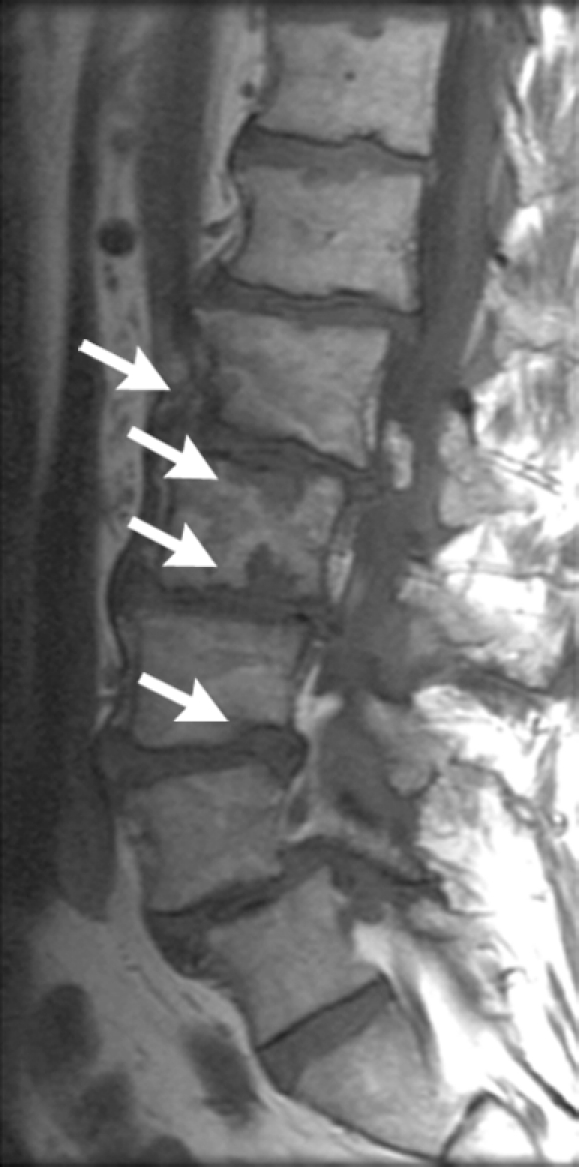
Insufficiency fracture of the femoral head. (a, b) Increasing joint space narrowing (arrow) is demonstrated on right hip radiographs over a period of 12 months in a 78-year-old man with increasing clinical symptoms. (c) Axial fluid-sensitive intermediate-weighted fast spin echo image obtained at 12 months shows fracture lines at the posterior aspect of the femoral head (arrow) and a substantial amount of bone marrow edema pattern. (d) Sagittal T1-weighted fast spin echo image of the lumbar spine depicts multiple endplate fractures (arrows) indicating increased fragility of the spine.
Recently atypical subtrochanteric and femoral shaft fractures have been identified in older individuals and associated with long-term bisphosphonate therapy (15,117,118). Coexisting factors have been discussed in the etiology of these fractures such as comorbidities (eg, rheumatoid arthritis, diabetes) and other drugs (eg, glucocorticoids, proton pump inhibitors) (15,117,118). The task force of the American Society for Bone and Mineral Research (118) identified a number of features of these fractures, which include location in the subtrochanteric region and femoral shaft, transverse or short oblique orientation, minimal or no associated trauma, a medial spike when the fracture is complete, absence of comminution, cortical thickening, and a periosteal reaction of the lateral cortex (Fig 8). These fractures are increasingly diagnosed and not infrequently only lateral cortical thickening of the cortex is found, which may progress to a complete fracture and is therefore a critical finding that needs to be communicated to the clinician. These incomplete stress fractures are treated with prophylactic internal fixation surgery.
Figure 8a:
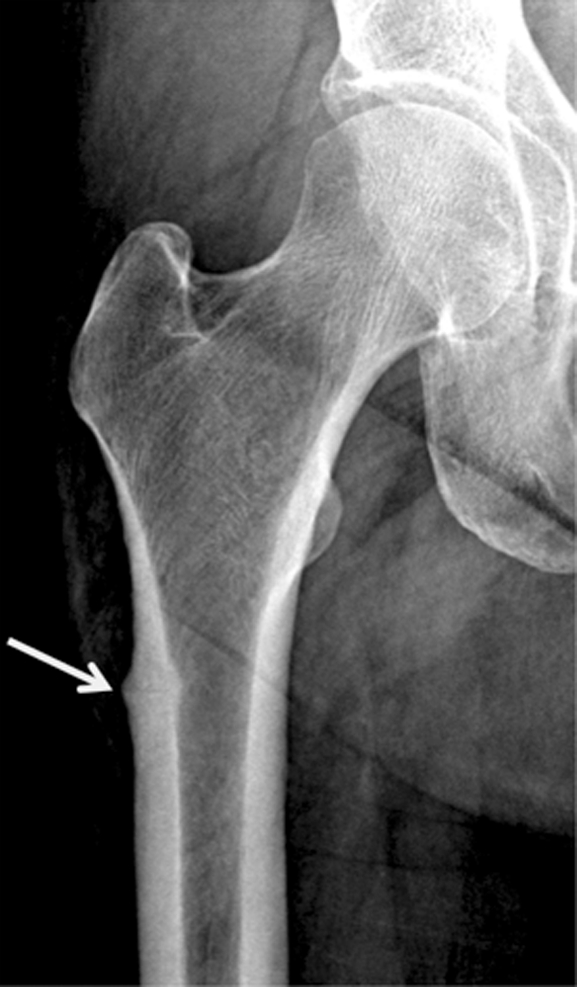
Radiographs show atypical subtrochanteric stress fracture of the right proximal femur diaphysis in a 65-year-old woman who underwent treatment for 5 years with alendronate. (a) Note the focal periosteal reaction with cortical thickening of the right lateral femoral diaphysis with subtle fracture line (arrow). (b) Image demonstrates protective internal fixation of the fracture with a long gamma nail.
Figure 8b:
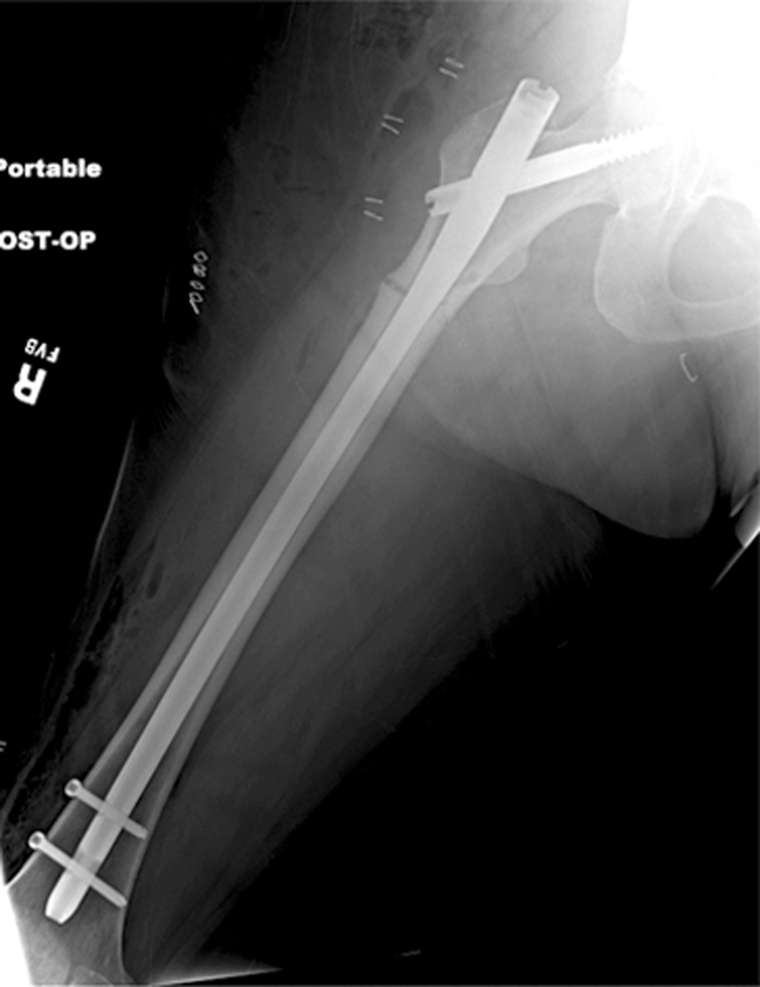
Radiographs show atypical subtrochanteric stress fracture of the right proximal femur diaphysis in a 65-year-old woman who underwent treatment for 5 years with alendronate. (a) Note the focal periosteal reaction with cortical thickening of the right lateral femoral diaphysis with subtle fracture line (arrow). (b) Image demonstrates protective internal fixation of the fracture with a long gamma nail.
Conclusion
As radiologists we have several important roles and responsibilities in the imaging of osteoporosis (119): We need to (a) diagnose osteoporosis, (b) alert clinicians to increased fracture risk, (c) monitor treatment, and (d) correctly interpret fragility fractures. In addition we need to ensure that the proper imaging modality is used whenever possible—that is, if DXA has limitations, an attempt should be made to use quantitative CT, and if this is not possible we need to indicate the limitations in our report to the referring clinician. Also, we are responsible for quality assurance of quantitative measurements and we should be a driving force in developing new techniques to analyze bone quality. The importance of osteoporosis is increasing in our aging society; fragility fractures may have a devastating impact on the individual and as radiologists we have a critical role in preventing these.
Essentials.
• Osteoporosis is defined as a skeletal disorder characterized by compromised bone strength predisposing to an increased risk of fracture, and bone strength is characterized by bone density and quality; given that effective therapies are available, diagnosis of increased fracture risk is critical.
• Dual x-ray absorptiometry of the proximal femur and lumbar spine is the standard technique used to classify bone mineral density (BMD) in postmenopausal women or older men (>50 years of age) as osteopenic (T score less than −1 to greater than −2.5) or osteoporotic (T score of −2.5 or lower).
• Central quantitative CT is not established to classify BMD in patients as osteopenic or osteoporotic but provides volumetric, purely trabecular BMD, which may be more sensitive to therapy and better suited to measure BMD in patients with advanced degenerative disease or in those who are very small or large.
• Among the techniques to measure bone quality, high-resolution peripheral quantitative CT (trabecular and cortical bone structure) and quantitative US (velocity of transmission and amplitude of ultrasound signal) are currently most frequently used.
• Diagnosis of osteoporotic fractures substantially affects patient care, and radiologists need to be familiar with the typical signs (including those of atypical subtrochanteric fractures related to bisphosphonates) and report these also for chest radiographs and CT scans obtained for different indications.
Disclosures of Potential Conflicts of Interest: No potential conflicts of interest to disclose.
Acknowledgments
I acknowledge Andrew Burghardt's support with the high-resolution peripheral quantitative CT part of the manuscript and in providing Figure 3.
Received March 1, 2011; revision requested April 8; revision received April 25; accepted May 6; final version accepted May 10; final review by the author November 24.
Funding: This research was supported by the National Institutes of Health (grant 1RC1AR058405-01).
Abbreviations:
- BMD
- bone mineral density
- DXA
- dual x-ray absorptiometry
- HR-pQ
- high-resolution peripheral quantitative
- ISCD
- International Society for Clinical Densitometry
- 3D
- three-dimensional
- 2D
- two-dimensional
- WHO
- World Health Organization
References
- 1.NIH Consensus Development Panel on Osteoporosis Prevention, Diagnosis, and Therapy. Osteoporosis prevention, diagnosis, and therapy. JAMA 2001;285(6):785–795 [DOI] [PubMed] [Google Scholar]
- 2.World Health Organization Technical report: Assessment of fracture risk and its application to screening for postmenopausal osteoporosis: a report of a WHO study group. Geneva, Switzerland: World Health Organization, 1994 [PubMed] [Google Scholar]
- 3.Kanis JA. Diagnosis of osteoporosis and assessment of fracture risk. Lancet 2002;359(9321):1929–1936 [DOI] [PubMed] [Google Scholar]
- 4.Kanis JA, McCloskey EV, Johansson H, Oden A, Ström O, Borgström F. Development and use of FRAX in osteoporosis. Osteoporos Int 2010;21(Suppl 2):S407–S413 [DOI] [PubMed] [Google Scholar]
- 5.Kanis JA, Johansson H, Oden A, Dawson-Hughes B, Melton LJ, 3rd, McCloskey EV. The effects of a FRAX revision for the USA. Osteoporos Int 2010;21(1):35–40 [DOI] [PubMed] [Google Scholar]
- 6.Kanis JA, Oden A, Johansson H, Borgström F, Ström O, McCloskey E. FRAX and its applications to clinical practice. Bone 2009;44(5):734–743 [DOI] [PubMed] [Google Scholar]
- 7.Sambrook P, Cooper C. Osteoporosis. Lancet 2006;367(9527):2010–2018 [DOI] [PubMed] [Google Scholar]
- 8.Oot SG, ed. Bone health and osteoporosis: a report of the Surgeon-General. Rockville, Md: U.S Department of Health and Human Services, 2004 [PubMed] [Google Scholar]
- 9.Melton LJ, 3rd, Atkinson EJ, Cooper C, O’Fallon WM, Riggs BL. Vertebral fractures predict subsequent fractures. Osteoporos Int 1999;10(3):214–221 [DOI] [PubMed] [Google Scholar]
- 10.Marshall D, Johnell O, Wedel H. Meta-analysis of how well measures of bone mineral density predict occurrence of osteoporotic fractures. BMJ 1996;312(7041):1254–1259 [DOI] [PMC free article] [PubMed] [Google Scholar]
- 11.Javaid MK, Cooper C. Prenatal and childhood influences on osteoporosis. Best Pract Res Clin Endocrinol Metab 2002;16(2):349–367 [DOI] [PubMed] [Google Scholar]
- 12.Naganathan V, Macgregor A, Snieder H, Nguyen T, Spector T, Sambrook P. Gender differences in the genetic factors responsible for variation in bone density and ultrasound. J Bone Miner Res 2002;17(4):725–733 [DOI] [PubMed] [Google Scholar]
- 13.Bonjour JP, Chevalley T, Ammann P, Slosman D, Rizzoli R. Gain in bone mineral mass in prepubertal girls 3.5 years after discontinuation of calcium supplementation: a follow-up study. Lancet 2001;358(9289):1208–1212 [DOI] [PubMed] [Google Scholar]
- 14.Ensrud KE, Stone K, Cauley JA, et al. Vitamin D receptor gene polymorphisms and the risk of fractures in older women. For the Study of Osteoporotic Fractures Research Group. J Bone Miner Res 1999;14(10):1637–1645 [DOI] [PubMed] [Google Scholar]
- 15.Black DM, Kelly MP, Genant HK, et al. Bisphosphonates and fractures of the subtrochanteric or diaphyseal femur. N Engl J Med 2010;362(19):1761–1771 [DOI] [PubMed] [Google Scholar]
- 16.Lenart BA, Lorich DG, Lane JM. Atypical fractures of the femoral diaphysis in postmenopausal women taking alendronate. N Engl J Med 2008;358(12):1304–1306 [DOI] [PubMed] [Google Scholar]
- 17.Osteoporosis prevention, diagnosis, and therapy. NIH Consensus Statement 2000 March 27-29; 17(1): 1–36. http://consensus.nih.gov/2000/2000Osteoporosis111html.htm [PubMed]
- 18.Baim S, Binkley N, Bilezikian JP, et al. Official Positions of the International Society for Clinical Densitometry and executive summary of the 2007 ISCD Position Development Conference. J Clin Densitom 2008;11(1):75–91 [DOI] [PubMed] [Google Scholar]
- 19.Lewiecki EM, Baim S, Langman CB, Bilezikian JP. The official positions of the International Society for Clinical Densitometry: perceptions and commentary. J Clin Densitom 2009;12(3):267–271 [DOI] [PubMed] [Google Scholar]
- 20.Lewiecki EM, Gordon CM, Baim S, et al. Special report on the 2007 adult and pediatric Position Development Conferences of the International Society for Clinical Densitometry. Osteoporos Int 2008;19(10):1369–1378 [DOI] [PubMed] [Google Scholar]
- 21.Fogelman I, Blake GM. Bone densitometry: an update. Lancet 2005;366(9503):2068–2070 [DOI] [PubMed] [Google Scholar]
- 22.Genant HK, Boyd DP. Quantitative bone mineral analysis using dual energy computed tomography. Invest Radiol 1977;12(6):545–551 [DOI] [PubMed] [Google Scholar]
- 23.Genant HK, Cann CE, Pozzi-Mucelli RS, Kanter AS. Vertebral mineral determination by quantitative CT: clinical feasibility and normative data. J Comput Assist Tomogr 1983;7(3):554 [Google Scholar]
- 24.Black DM, Greenspan SL, Ensrud KE, et al. The effects of parathyroid hormone and alendronate alone or in combination in postmenopausal osteoporosis. N Engl J Med 2003;349(13):1207–1215 [DOI] [PubMed] [Google Scholar]
- 25.Bergot C, Laval-Jeantet AM, Hutchinson K, Dautraix I, Caulin F, Genant HK. A comparison of spinal quantitative computed tomography with dual energy X-ray absorptiometry in European women with vertebral and nonvertebral fractures. Calcif Tissue Int 2001;68(2):74–82 [DOI] [PubMed] [Google Scholar]
- 26.Yu W, Glüer CC, Grampp S, et al. Spinal bone mineral assessment in postmenopausal women: a comparison between dual X-ray absorptiometry and quantitative computed tomography. Osteoporos Int 1995;5(6):433–439 [DOI] [PubMed] [Google Scholar]
- 27.Binkley N, Krueger D, Vallarta-Ast N. An overlying fat panniculus affects femur bone mass measurement. J Clin Densitom 2003;6(3):199–204 [DOI] [PubMed] [Google Scholar]
- 28.Tothill P, Hannan WJ, Cowen S, Freeman CP. Anomalies in the measurement of changes in total-body bone mineral by dual-energy X-ray absorptiometry during weight change. J Bone Miner Res 1997;12(11):1908–1921 [DOI] [PubMed] [Google Scholar]
- 29.Weigert J, Cann C. DXA in obese patients: are normal values really normal? J Womens Imaging 1999;1:11–17 [Google Scholar]
- 30.Bousson V, Le Bras A, Roqueplan F, et al. Volumetric quantitative computed tomography of the proximal femur: relationships linking geometric and densitometric variables to bone strength. Role for compact bone. Osteoporos Int 2006;17(6):855–864 [DOI] [PubMed] [Google Scholar]
- 31.Farhat GN, Cauley JA, Matthews KA, et al. Volumetric BMD and vascular calcification in middle-aged women: the Study of Women’s Health Across the Nation. J Bone Miner Res 2006;21(12):1839–1846 [DOI] [PubMed] [Google Scholar]
- 32.Farhat GN, Strotmeyer ES, Newman AB, et al. Volumetric and areal bone mineral density measures are associated with cardiovascular disease in older men and women: the health, aging, and body composition study. Calcif Tissue Int 2006;79(2):102–111 [DOI] [PubMed] [Google Scholar]
- 33.Lang TF, Li J, Harris ST, Genant HK. Assessment of vertebral bone mineral density using volumetric quantitative CT. J Comput Assist Tomogr 1999;23(1):130–137 [DOI] [PubMed] [Google Scholar]
- 34.Diederichs G, Engelken F, Marshall LM, et al. Diffuse idiopathic skeletal hyperostosis (DISH): relation to vertebral fractures and bone density. Osteoporos Int 2011;22(6):1789–1797 [DOI] [PMC free article] [PubMed] [Google Scholar]
- 35.Blake GM, Fogelman I. Peripheral or central densitometry: does it matter which technique we use? J Clin Densitom 2001;4(2):83–96 [DOI] [PubMed] [Google Scholar]
- 36.Adams JE. Quantitative computed tomography. Eur J Radiol 2009;71(3):415–424 [DOI] [PubMed] [Google Scholar]
- 37.Bach-Mortensen P, Hyldstrup L, Appleyard M, Hindsø K, Gebuhr P, Sonne-Holm S. Digital x-ray radiogrammetry identifies women at risk of osteoporotic fracture: results from a prospective study. Calcif Tissue Int 2006;79(1):1–6 [DOI] [PubMed] [Google Scholar]
- 38.Damilakis J, Adams JE, Guglielmi G, Link TM. Radiation exposure in X-ray-based imaging techniques used in osteoporosis. Eur Radiol 2010;20(11):2707–2714 [DOI] [PMC free article] [PubMed] [Google Scholar]
- 39.Boutroy S, Bouxsein ML, Munoz F, Delmas PD. In vivo assessment of trabecular bone microarchitecture by high-resolution peripheral quantitative computed tomography. J Clin Endocrinol Metab 2005;90(12):6508–6515 [DOI] [PubMed] [Google Scholar]
- 40.Burghardt AJ, Dais KA, Masharani U, Link TM, Majumdar S. In vivo quantification of intra-cortical porosity in human cortical bone using hr-pQCT in patients with type II diabetes [abstr]. J Bone Miner Res 2008;23:S450 [Google Scholar]
- 41.Burghardt AJ, Kazakia GJ, Sode M, de Papp AE, Link TM, Majumdar S. A longitudinal HR-pQCT study of alendronate treatment in postmenopausal women with low bone density: Relations among density, cortical and trabecular microarchitecture, biomechanics, and bone turnover. J Bone Miner Res 2010;25(12):2558–2571 [Published correction appears in J Bone Miner Res 2011;26(2):439.] [DOI] [PMC free article] [PubMed] [Google Scholar]
- 42.Burrows M, Liu D, McKay H. High-resolution peripheral QCT imaging of bone micro-structure in adolescents. Osteoporos Int 2010;21(3):515–520 [DOI] [PubMed] [Google Scholar]
- 43.Krug R, Burghardt AJ, Majumdar S, Link TM. High-resolution imaging techniques for the assessment of osteoporosis. Radiol Clin North Am 2010;48(3):601–621 [DOI] [PMC free article] [PubMed] [Google Scholar]
- 44.Burghardt AJ, Kazakia GJ, Ramachandran S, Link TM, Majumdar S. Age- and gender-related differences in the geometric properties and biomechanical significance of intracortical porosity in the distal radius and tibia. J Bone Miner Res 2010;25(5):983–993 [DOI] [PMC free article] [PubMed] [Google Scholar]
- 45.Liu XS, Zhang XH, Sekhon KK, et al. High-resolution peripheral quantitative computed tomography can assess microstructural and mechanical properties of human distal tibial bone. J Bone Miner Res 2010;25(4):746–756 [DOI] [PMC free article] [PubMed] [Google Scholar]
- 46.Macneil JA, Boyd SK. Bone strength at the distal radius can be estimated from high-resolution peripheral quantitative computed tomography and the finite element method. Bone 2008;42(6):1203–1213 [DOI] [PubMed] [Google Scholar]
- 47.Burghardt AJ, Buie HR, Laib A, Majumdar S, Boyd SK. Reproducibility of direct quantitative measures of cortical bone microarchitecture of the distal radius and tibia by HR-pQCT. Bone 2010;47(3):519–528 [DOI] [PMC free article] [PubMed] [Google Scholar]
- 48.MacNeil JA, Boyd SK. Improved reproducibility of high-resolution peripheral quantitative computed tomography for measurement of bone quality. Med Eng Phys 2008;30(6):792–799 [DOI] [PubMed] [Google Scholar]
- 49.Szulc P, Boutroy S, Vilayphiou N, Chaitou A, Delmas PD, Chapurlat R. Cross-sectional analysis of the association between fragility fractures and bone microarchitecture in older men: the STRAMBO study. J Bone Miner Res 2011;26(6):1358–1367 [DOI] [PubMed] [Google Scholar]
- 50.Li EK, Zhu TY, Hung VY, et al. Ibandronate increases cortical bone density in patients with systemic lupus erythematosus on long-term glucocorticoid. Arthritis Res Ther 2010;12(5):R198. [DOI] [PMC free article] [PubMed] [Google Scholar]
- 51.Sode M, Burghardt AJ, Kazakia GJ, Link TM, Majumdar S. Regional variations of gender-specific and age-related differences in trabecular bone structure of the distal radius and tibia. Bone 2010;46(6):1652–1660 [DOI] [PMC free article] [PubMed] [Google Scholar]
- 52.Burghardt AJ, Issever AS, Schwartz AV, et al. High-resolution peripheral quantitative computed tomographic imaging of cortical and trabecular bone microarchitecture in patients with type 2 diabetes mellitus. J Clin Endocrinol Metab 2010;95(11):5045–5055 [DOI] [PMC free article] [PubMed] [Google Scholar]
- 53.Schwartz AV, Sellmeyer DE. Women, type 2 diabetes, and fracture risk. Curr Diab Rep 2004;4(5):364–369 [DOI] [PubMed] [Google Scholar]
- 54.Link TM, Vieth V, Stehling C, et al. High-resolution MRI vs multislice spiral CT: which technique depicts the trabecular bone structure best? Eur Radiol 2003;13(4):663–671 [DOI] [PubMed] [Google Scholar]
- 55.Issever AS, Vieth V, Lotter A, et al. Local differences in the trabecular bone structure of the proximal femur depicted with high-spatial-resolution MR imaging and multisection CT. Acad Radiol 2002;9(12):1395–1406 [DOI] [PubMed] [Google Scholar]
- 56.Diederichs G, Link TM, Kentenich M, et al. Assessment of trabecular bone structure of the calcaneus using multi-detector CT: correlation with microCT and biomechanical testing. Bone 2009;44(5):976–83 [DOI] [PubMed] [Google Scholar]
- 57.Graeff C, Timm W, Nickelsen TN, et al. Monitoring teriparatide-associated changes in vertebral microstructure by high-resolution CT in vivo: results from the EUROFORS study. J Bone Miner Res 2007;22(9):1426–1433 [DOI] [PubMed] [Google Scholar]
- 58.Ito M, Ikeda K, Nishiguchi M, et al. Multi-detector row CT imaging of vertebral microstructure for evaluation of fracture risk. J Bone Miner Res 2005;20(10):1828–1836 [DOI] [PubMed] [Google Scholar]
- 59.Rodríguez-Soto AE, Fritscher KD, Schuler B, et al. Texture analysis, bone mineral density, and cortical thickness of the proximal femur: fracture risk prediction. J Comput Assist Tomogr 2010;34(6):949–957 [DOI] [PubMed] [Google Scholar]
- 60.Keaveny TM. Biomechanical computed tomography-noninvasive bone strength analysis using clinical computed tomography scans. Ann N Y Acad Sci 2010;1192:57–65 [DOI] [PubMed] [Google Scholar]
- 61.Keaveny TM, Hoffmann PF, Singh M, et al. Femoral bone strength and its relation to cortical and trabecular changes after treatment with PTH, alendronate, and their combination as assessed by finite element analysis of quantitative CT scans. J Bone Miner Res 2008;23(12):1974–1982 [DOI] [PMC free article] [PubMed] [Google Scholar]
- 62.Mawatari T, Miura H, Hamai S, et al. Vertebral strength changes in rheumatoid arthritis patients treated with alendronate, as assessed by finite element analysis of clinical computed tomography scans: a prospective randomized clinical trial. Arthritis Rheum 2008;58(11):3340–3349 [DOI] [PubMed] [Google Scholar]
- 63.Link TM, Majumdar S, Lin JC, et al. A comparative study of trabecular bone properties in the spine and femur using high resolution MRI and CT. J Bone Miner Res 1998;13(1):122–132 [DOI] [PubMed] [Google Scholar]
- 64.Link TM, Vieth V, Langenberg R, et al. Structure analysis of high resolution magnetic resonance imaging of the proximal femur: in vitro correlation with biomechanical strength and BMD. Calcif Tissue Int 2003;72(2):156–165 [DOI] [PubMed] [Google Scholar]
- 65.Majumdar S, Kothari M, Augat P, et al. High-resolution magnetic resonance imaging: three-dimensional trabecular bone architecture and biomechanical properties. Bone 1998;22(5):445–454 [DOI] [PubMed] [Google Scholar]
- 66.Phan CM, Matsuura M, Bauer JS, et al. Trabecular bone structure of the calcaneus: comparison of MR imaging at 3.0 and 1.5 T with micro-CT as the standard of reference. Radiology 2006;239(2):488–496 [DOI] [PubMed] [Google Scholar]
- 67.Krug R, Banerjee S, Han ET, Newitt DC, Link TM, Majumdar S. Feasibility of in vivo structural analysis of high-resolution magnetic resonance images of the proximal femur. Osteoporos Int 2005;16(11):1307–1314 [DOI] [PubMed] [Google Scholar]
- 68.Cortet B, Boutry N, Dubois P, Bourel P, Cotten A, Marchandise X. In vivo comparison between computed tomography and magnetic resonance image analysis of the distal radius in the assessment of osteoporosis. J Clin Densitom 2000;3(1):15–26 [DOI] [PubMed] [Google Scholar]
- 69.Link TM, Majumdar S, Augat P, et al. In vivo high resolution MRI of the calcaneus: differences in trabecular structure in osteoporosis patients. J Bone Miner Res 1998;13(7):1175–1182 [DOI] [PubMed] [Google Scholar]
- 70.Majumdar S, Link TM, Augat P, et al. Trabecular bone architecture in the distal radius using magnetic resonance imaging in subjects with fractures of the proximal femur. Magnetic Resonance Science Center and Osteoporosis and Arthritis Research Group. Osteoporos Int 1999;10(3):231–239 [DOI] [PubMed] [Google Scholar]
- 71.Wehrli FW, Gomberg BR, Saha PK, Song HK, Hwang SN, Snyder PJ. Digital topological analysis of in vivo magnetic resonance microimages of trabecular bone reveals structural implications of osteoporosis. J Bone Miner Res 2001;16(8):1520–1531 [DOI] [PubMed] [Google Scholar]
- 72.Wehrli FW, Leonard MB, Saha PK, Gomberg BR. Quantitative high-resolution magnetic resonance imaging reveals structural implications of renal osteodystrophy on trabecular and cortical bone. J Magn Reson Imaging 2004;20(1):83–89 [DOI] [PubMed] [Google Scholar]
- 73.Benito M, Gomberg B, Wehrli FW, et al. Deterioration of trabecular architecture in hypogonadal men. J Clin Endocrinol Metab 2003;88(4):1497–1502 [DOI] [PubMed] [Google Scholar]
- 74.Link TM. High-resolution magnetic resonance imaging to assess trabecular bone structure in patients after transplantation: a review. Top Magn Reson Imaging 2002;13(5):365–375 [DOI] [PubMed] [Google Scholar]
- 75.Link TM, Saborowski S, Kisters K, et al. Changes in calcaneal trabecular bone structure assessed with high-resolution MR imaging in patients with kidney transplantation. Osteoporos Int 2002;13(2):119–129 [DOI] [PubMed] [Google Scholar]
- 76.Link TM, Lotter A, Beyer F, et al. Changes in calcaneal trabecular bone structure after heart transplantation: an MR imaging study. Radiology 2000;217(3):855–862 [DOI] [PubMed] [Google Scholar]
- 77.Chesnut CH, 3rd, Majumdar S, Newitt DC, et al. Effects of salmon calcitonin on trabecular microarchitecture as determined by magnetic resonance imaging: results from the QUEST study. J Bone Miner Res 2005;20(9):1548–1561 [DOI] [PMC free article] [PubMed] [Google Scholar]
- 78.Kazakia GJ, Hyun B, Burghardt AJ, et al. In vivo determination of bone structure in postmenopausal women: a comparison of HR-pQCT and high-field MR imaging. J Bone Miner Res 2008;23(4):463–474 [DOI] [PubMed] [Google Scholar]
- 79.Folkesson J, Goldenstein J, Carballido-Gamio J, et al. Longitudinal evaluation of the effects of alendronate on MRI bone microarchitecture in postmenopausal osteopenic women. Bone 2011;48(3):611–621 [DOI] [PMC free article] [PubMed] [Google Scholar]
- 80.Rahmer J, Börnert P, Groen J, Bos C. Three-dimensional radial ultrashort echo-time imaging with T2 adapted sampling. Magn Reson Med 2006;55(5):1075–1082 [DOI] [PubMed] [Google Scholar]
- 81.Techawiboonwong A, Song HK, Wehrli FW. In vivo MRI of submillisecond T(2) species with two-dimensional and three-dimensional radial sequences and applications to the measurement of cortical bone water. NMR Biomed 2008;21(1):59–70 [DOI] [PubMed] [Google Scholar]
- 82.Hopper TA, Wehrli FW, Saha PK, et al. Quantitative microcomputed tomography assessment of intratrabecular, intertrabecular, and cortical bone architecture in a rat model of severe renal osteodystrophy. J Comput Assist Tomogr 2007;31(2):320–328 [DOI] [PubMed] [Google Scholar]
- 83.Rosen CJ, Bouxsein ML. Mechanisms of disease: is osteoporosis the obesity of bone? Nat Clin Pract Rheumatol 2006;2(1):35–43 [DOI] [PubMed] [Google Scholar]
- 84.Griffith JF, Yeung DK, Antonio GE, et al. Vertebral bone mineral density, marrow perfusion, and fat content in healthy men and men with osteoporosis: dynamic contrast-enhanced MR imaging and MR spectroscopy. Radiology 2005;236(3):945–951 [DOI] [PubMed] [Google Scholar]
- 85.Griffith JF, Yeung DK, Antonio GE, et al. Vertebral marrow fat content and diffusion and perfusion indexes in women with varying bone density: MR evaluation. Radiology 2006;241(3):831–838 [DOI] [PubMed] [Google Scholar]
- 86.Schellinger D, Lin CS, Lim J, Hatipoglu HG, Pezzullo JC, Singer AJ. Bone marrow fat and bone mineral density on proton MR spectroscopy and dual-energy X-ray absorptiometry: their ratio as a new indicator of bone weakening. AJR Am J Roentgenol 2004;183(6):1761–1765 [DOI] [PubMed] [Google Scholar]
- 87.Li X, Ma BC, Bolbos RI, et al. Quantitative assessment of bone marrow edema-like lesion and overlying cartilage in knees with osteoarthritis and anterior cruciate ligament tear using MR imaging and spectroscopic imaging at 3 Tesla. J Magn Reson Imaging 2008;28(2):453–461 [DOI] [PMC free article] [PubMed] [Google Scholar]
- 88.Yeung DK, Griffith JF, Antonio GE, Lee FK, Woo J, Leung PC. Osteoporosis is associated with increased marrow fat content and decreased marrow fat unsaturation: a proton MR spectroscopy study. J Magn Reson Imaging 2005;22(2):279–285 [DOI] [PubMed] [Google Scholar]
- 89.Griffith JF, Yeung DK, Tsang PH, et al. Compromised bone marrow perfusion in osteoporosis. J Bone Miner Res 2008; 23(7):1068–1075 [DOI] [PubMed] [Google Scholar]
- 90.Nelson HD, Haney EM, Dana T, Bougatsos C, Chou R. Screening for osteoporosis: an update for the U.S. Preventive Services Task Force. Ann Intern Med 2010;153(2):99–111 [DOI] [PubMed] [Google Scholar]
- 91.Gluer CC. A new quality of bone ultrasound research. IEEE Trans Ultrason Ferroelectr Freq Control 2008;55(7):1524–1528 [DOI] [PubMed] [Google Scholar]
- 92.Krieg MA, Barkmann R, Gonnelli S, et al. Quantitative ultrasound in the management of osteoporosis: the 2007 ISCD Official Positions. J Clin Densitom 2008;11(1):163–187 [DOI] [PubMed] [Google Scholar]
- 93.Guglielmi G, Adams J, Link TM. Quantitative ultrasound in the assessment of skeletal status. Eur Radiol 2009;19(8):1837–1848 [DOI] [PubMed] [Google Scholar]
- 94.Glüer CC, Eastell R, Reid DM, et al. Association of five quantitative ultrasound devices and bone densitometry with osteoporotic vertebral fractures in a population-based sample: the OPUS Study. J Bone Miner Res 2004;19(5):782–793 [DOI] [PubMed] [Google Scholar]
- 95.Krieg MA, Cornuz J, Ruffieux C, et al. Comparison of three bone ultrasounds for the discrimination of subjects with and without osteoporotic fractures among 7562 elderly women. J Bone Miner Res 2003;18(7):1261–1266 [DOI] [PubMed] [Google Scholar]
- 96.Bauer DC, Glüer CC, Cauley JA, et al. Broadband ultrasound attenuation predicts fractures strongly and independently of densitometry in older women. A prospective study. Study of Osteoporotic Fractures Research Group. Arch Intern Med 1997;157(6):629–634 [PubMed] [Google Scholar]
- 97.Khaw KT, Reeve J, Luben R, et al. Prediction of total and hip fracture risk in men and women by quantitative ultrasound of the calcaneus: EPIC-Norfolk prospective population study. Lancet 2004;363(9404):197–202 [DOI] [PubMed] [Google Scholar]
- 98.Gehlbach SH, Bigelow C, Heimisdottir M, May S, Walker M, Kirkwood JR. Recognition of vertebral fracture in a clinical setting. Osteoporos Int 2000;11(7):577–582 [DOI] [PubMed] [Google Scholar]
- 99.Kim N, Rowe BH, Raymond G, et al. Underreporting of vertebral fractures on routine chest radiography. AJR Am J Roentgenol 2004;182(2):297–300 [DOI] [PubMed] [Google Scholar]
- 100.Mueller D, Isbary M, Boehm H, Bauer J, Rummeny E, Link TM. Recognition of osteoporosis-related vertebral fractures on chest radiographs in postmenopausal women [abstr]. In: Radiological Society of North America Scientific Assembly and Annual Meeting Program. Oak Brook, Ill: Radiological Society of North America, 2004; 305 [Google Scholar]
- 101.Genant HK, Wu CY, van Kuijk C, Nevitt MC. Vertebral fracture assessment using a semiquantitative technique. J Bone Miner Res 1993;8(9):1137–1148 [DOI] [PubMed] [Google Scholar]
- 102.Storm T, Thamsborg G, Steiniche T, Genant HK, Sørensen OH. Effect of intermittent cyclical etidronate therapy on bone mass and fracture rate in women with postmenopausal osteoporosis. N Engl J Med 1990;322(18):1265–1271 [DOI] [PubMed] [Google Scholar]
- 103.Ettinger B, Block JE, Smith R, Cummings SR, Harris ST, Genant HK. An examination of the association between vertebral deformities, physical disabilities and psychosocial problems. Maturitas 1988;10(4):283–296 [DOI] [PubMed] [Google Scholar]
- 104.Link TM, Guglielmi G, van Kuijk C, Adams JE. Radiologic assessment of osteoporotic vertebral fractures: diagnostic and prognostic implications. Eur Radiol 2005;15(8):1521–1532 [DOI] [PubMed] [Google Scholar]
- 105.Ferrar L, Jiang G, Adams J, Eastell R. Identification of vertebral fractures: an update. Osteoporos Int 2005;16(7):717–728 [DOI] [PubMed] [Google Scholar]
- 106.Jiang G, Eastell R, Barrington NA, Ferrar L. Comparison of methods for the visual identification of prevalent vertebral fracture in osteoporosis. Osteoporos Int 2004;15(11):887–896 [DOI] [PubMed] [Google Scholar]
- 107.Müller D, Bauer JS, Zeile M, Rummeny EJ, Link TM. Significance of sagittal reformations in routine thoracic and abdominal multislice CT studies for detecting osteoporotic fractures and other spine abnormalities. Eur Radiol 2008;18(8):1696–1702 [DOI] [PubMed] [Google Scholar]
- 108.Williams AL, Al-Busaidi A, Sparrow PJ, Adams JE, Whitehouse RW. Under-reporting of osteoporotic vertebral fractures on computed tomography. Eur J Radiol 2009; 69(1):179–183 [DOI] [PubMed] [Google Scholar]
- 109.Vokes T, Bachman D, Baim S, et al. Vertebral fracture assessment: the 2005 ISCD Official Positions. J Clin Densitom 2006;9(1):37–46 [DOI] [PubMed] [Google Scholar]
- 110.Blake SP, Connors AM. Sacral insufficiency fracture. Br J Radiol 2004;77(922):891–896 [DOI] [PubMed] [Google Scholar]
- 111.Cabarrus MC, Ambekar A, Lu Y, Link TM. MRI and CT of insufficiency fractures of the pelvis and the proximal femur. AJR Am J Roentgenol 2008;191(4):995–1001 [DOI] [PubMed] [Google Scholar]
- 112.Kattapuram TM, Kattapuram SV. Spontaneous osteonecrosis of the knee. Eur J Radiol 2008;67(1):42–48 [DOI] [PubMed] [Google Scholar]
- 113.Yamamoto T, Bullough PG. Spontaneous osteonecrosis of the knee: the result of subchondral insufficiency fracture. J Bone Joint Surg Am 2000;82(6):858–866 [DOI] [PubMed] [Google Scholar]
- 114.Yamamoto T, Iwamoto Y, Schneider R, Bullough PG. Histopathological prevalence of subchondral insufficiency fracture of the femoral head. Ann Rheum Dis 2008;67(2):150–153 [DOI] [PubMed] [Google Scholar]
- 115.Yamamoto T, Schneider R, Bullough PG. Subchondral insufficiency fracture of the femoral head: histopathologic correlation with MRI. Skeletal Radiol 2001;30(5):247–254 [DOI] [PubMed] [Google Scholar]
- 116.Lin J, Lachmann E, Nagler W. Sacral insufficiency fractures: a report of two cases and a review of the literature. J Womens Health Gend Based Med 2001;10(7):699–705 [DOI] [PubMed] [Google Scholar]
- 117.Chan SS, Rosenberg ZS, Chan K, Capeci C. Subtrochanteric femoral fractures in patients receiving long-term alendronate therapy: imaging features. AJR Am J Roentgenol 2010;194(6):1581–1586 [DOI] [PubMed] [Google Scholar]
- 118.Shane E, Burr D, Ebeling PR, et al. Atypical subtrochanteric and diaphyseal femoral fractures: report of a task force of the American Society for Bone and Mineral Research. J Bone Miner Res 2010;25(11):2267–2294 [DOI] [PubMed] [Google Scholar]
- 119.Link TM, Adams JE. The radiologist’s important roles and responsibilities in osteoporosis. Eur J Radiol 2009;71(3):385–387 [DOI] [PubMed] [Google Scholar]
- 120.Griffith JF, Genant HK. Bone mass and architecture determination: state of the art. Best Pract Res Clin Endocrinol Metab 2008;22(5):737–764 [DOI] [PubMed] [Google Scholar]


