Abstract
In this paper, we report the results of an in vitro experiment on the release of metal ions from orthodontic appliances composed of alloys containing iron, chromium, nickel, silicon, and molybdenum into artificial saliva. The concentrations of magnesium, aluminum, silicon, phosphorus, sulfur, potassium, calcium, titanium, vanadium, manganese, iron, cobalt, copper, zinc, nickel, and chromium were significantly higher in artificial saliva in which metal brackets, bands, and wires used in orthodontics were incubated. In relation to the maximum acceptable concentrations of metal ions in drinking water and to recommended daily doses, two elements of concern were nickel (573 vs. 15 μg/l in the controls) and chromium (101 vs. 8 μg/l in the controls). Three ion release coefficients were defined: α, a dimensionless multiplication factor; β, the difference in concentrations (in micrograms per liter); and γ, the ion release coefficient (in percent). The elevated levels of metals in saliva are thought to occur by corrosion of the chemical elements in the alloys or welding materials. The concentrations of some groups of dissolved elements appear to be interrelated.
Keywords: Orthodontic appliances, In vitro, Artificial saliva, Metal ions release, ICP-MS
Introduction
Materials used in dentistry must have specific characteristics such as biological safety and functionality, adequate tissue response, and resistance to corrosion. As such, metal alloys have been extensively used in orthodontic dentistry because of their elasticity, shape memory, hardness, and stress resistance [1]. Metals used as components of these alloys, i.e., nickel and chromium, have been identified as cytotoxic, mutagenic, and allergenic [2–10].
The biocompatibility of orthodontic materials is widely discussed in recent scientific literature. In vitro and in vivo studies aimed to investigate whether a patient is exposed to toxic doses of metals from orthodontic appliances have not yet been published [11, 12]. The relationship between the potential dose of toxic elements released from orthodontic appliances and the response of an organism has not been evaluated. Also, the effect of treatment time and the type of appliance used on the amount of released metal ions as a consequence of corrosion has not been evaluated. This is related with difficulties associated with the use of invasive vs. noninvasive biomarkers [13, 14]. It seems that multidisciplinary approach towards the problem of the assessment of exposure of human organism to trace elements may reveal different aspects associated with the application of metallic materials in dentistry [15–18].
To address these important issues, the present study was conducted in vitro and in vivo to investigate whether the use of stainless steel orthodontic appliances can be considered a potentially significant source of exposure to toxic metals.
Materials and Methods
Materials
The evaluated materials were brand new orthodontic appliance parts. Wires, brackets, bands, and metal ligatures were all made of stainless steel and were purchased from the following companies:
0.017 × 0.025 in wires: American Orthodontics, catalog no. 853-224
Size 36.5 bands from 3M Unitek
Gemini APC II brackets from 3M Unitek
Metal ligatures from American Orthodontics (used to ligate wires to brackets)
The simulated appliance consisted of: 2 wires, 4 bands, 20 brackets, 20 metal ligatures.
Chemical Composition of Alloys
A Jeol JSM 5800 scanning electron microscope (SEM) was used to evaluate the chemical composition of brackets, bands, and wires (in mass percent). For wires (n = 5), 2-cm-long sections were washed, degreased, and secured on the SEM with conductive silver paste. The surface scanned was about 0.01 mm2. The accelerating voltage was 20 kV.
The composition of brackets (n = 8) was determined in two sites: base and wing. They were washed up to remove APC-modified resin (3M Unitek), and the analyses were performed on areas measuring around 4,000 μm2, visualized as scanning electron micrographs and recording the spectra of selected sites. The bands (buccal tube and band base, area about 0.1 mm2, n = 8) were positioned in the resin. The sections were not etched but covered with graphite powder under vacuum.
Release of Metal Ions into Artificial Saliva
The experiments were carried out in a modified artificial saliva solution consisting of 0.40 g/l sodium chloride (NaCl, Suprapur 99.99% Merck, Germany), 0.40 g/l potassium chloride (KCl, Suprapur, 99.99%, Merck), 0.80 g/l calcium chloride monohydrate (CaCl2⋅H2O, ultrapure for molecular biology, Fluka), 1.00 g/l urea (CO(NH2)2, ultrapure ≥ 99.5%, Fluka), 0.78 g/l anhydrous sodium dihydrophosphate (NaH2PO4, Suprapur, 99.99%, Merck), and 0.005 g/l sodium sulfide nonahydrate (Na2S⋅9H2O, 99.99%, Sigma-Aldrich). The water used in the study was demineralized with a Millipore system (Millipore, Bedford, MA, USA) to 0.05 μS/cm electrical conductivity.
Thirty orthodontic appliances were selected, weighed, and placed in separate 125-ml Nalgene® HDPE containers containing 25 ml of artificial saliva. As a control, artificial saliva was kept in the same conditions as the experimental set, without any metallic appliance. The solutions were incubated for 30 days in a water bath shaker (Elpan, Poland) at 120 rpm, 36.6°C.
For the determination of the concentrations of metals in the solutions, they were first digested in a microwave system (Milestone D, Italy) in closed Teflon bombs. For that purpose, 2.5 ml 69% (m/m) nitric acid (Suprapur, Merck) was added to each 25 ml of sample. After digestion, the samples were diluted to a final volume of 50 ml. The samples were then analyzed for metal content using an ICP-MS spectrometer (Thermo Scientific, X Series 2, USA). All the analytical procedures were performed in a laboratory certified by the Polish Centre for Accreditation (certificate no. AB 696) and ILAC-MRA according to PN-EN ISO 17025:2005.
Statistical Methods
The statistical treatment of elaboration of the results was performed by the use of Statistica ver. 9.0 software. Descriptive statistics (mean, standard deviation) were reported. Normality of distribution was assessed by Shapiro–Wilk test. This was the basis for the selection of statistical test (normal distribution—parametric t test; log-normal distribution—t test on logarithmized results; lack of normal distribution—non-parametric Mann–Whitney U test) for assessing the significance of the differences between the control and experimental groups. Statistical significance level was assumed as lower than 0.05. Pearson linear correlation coefficients were provided. A correlation was assessed as significant at p < 0.05. Additionally, analysis of multiple regression was undertaken using the suitable packet of Statistica software ver. 9.0.
Results
Composition of Alloys
The chemical composition of brackets, bands, and wires was assessed by X-ray microanalysis. The results are presented in Table 1.
Table 1.
Content of elements in brackets (n = 60), bands (n = 57), and wires (n = 5) in mass percent
| Mean | Min | Max | SD | |
|---|---|---|---|---|
| Brackets | ||||
| Si | 1.20 | 0.21 | 2.56 | 0.66 |
| Cr | 18.88 | 15.57 | 21.13 | 1.41 |
| Fe | 72.83 | 67.39 | 78.79 | 3.99 |
| Ni | 7.02 | 2.65 | 11.42 | 3.02 |
| Σ | 99.93 | |||
| Bands | ||||
| Si | 1.13 | 0.56 | 2.40 | 0.47 |
| Cr | 20.16 | 18.82 | 22.23 | 0.94 |
| Fe | 67.96 | 66.16 | 69.17 | 0.66 |
| Ni | 9.70 | 7.23 | 12.84 | 1.93 |
| Σ | 98.95 | |||
| Wires | ||||
| Si | 0.68 | 0.58 | 0.79 | 0.09 |
| S | 0.20 | 0.11 | 0.28 | 0.06 |
| Cr | 19.02 | 18.90 | 19.18 | 0.13 |
| Mn | 1.00 | 0.87 | 1.13 | 0.11 |
| Fe | 70.70 | 70.48 | 70.83 | 0.14 |
| Ni | 8.39 | 8.15 | 8.75 | 0.25 |
| Σ | 99.99 | 99.09 | ||
In brackets, a high variation of the Si and Ni contents was observed. There was also a relatively low variation for Cr and Fe. These variations may be due to differences in the alloys used for manufacturing the brackets.
Contrary to brackets, wires were manufactured from a single type of alloy. In wires, the highest variations of the results (in percent relative standard deviation) were found for S (30%), Si (13%), and Mn (11%). The variations for Ni (3.3%), Cr (0.7%), and Fe (0.2%) were considerably lower.
For all the alloys, the content of the elements in decreasing order were: Fe > Cr > Ni > Si. These elements are released from stainless steel. The total content of these elements was 100%, suggesting that other elements are not present in significant quantities.
Release of Metal Ions
In our experiments, orthodontic appliances were immersed in a solution of artificial saliva. As control, artificial saliva was treated in an identical manner, but was never in contact with the metallic appliances.
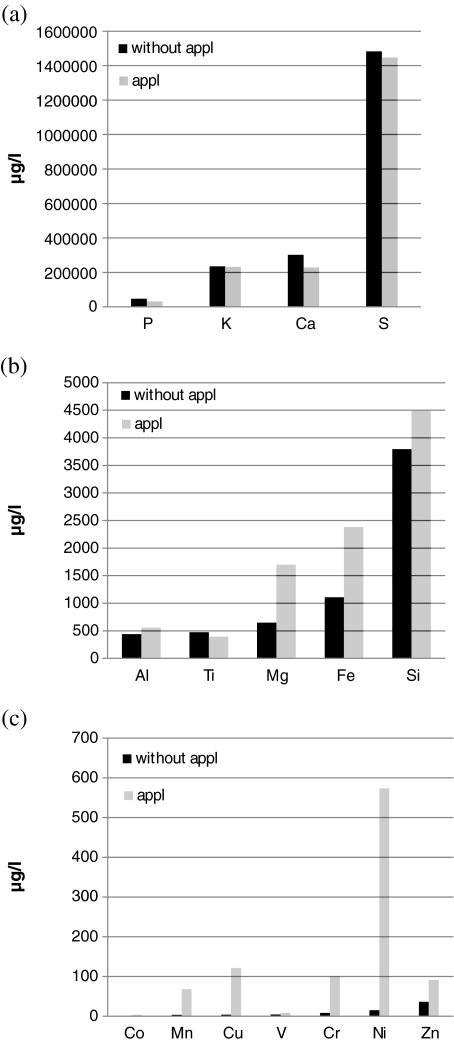
The following concentrations (in micrograms per liter) were found after a 30-day incubation of orthodontic appliances (n = 30) in artificial saliva: Mg, 1,699; Al, 559; Si, 4,491; P, 31,753; S, 1,446,700; K, 231,917; Ca, 228,100; Ti, 394; V, 8; Mn, 68; Fe, 2,382; Co, 4; Cu, 121; Zn, 91; Ni, 573; Cr, 101. The concentrations of Ag, As, Cd, Mo, and Pb were below the limit of detection.
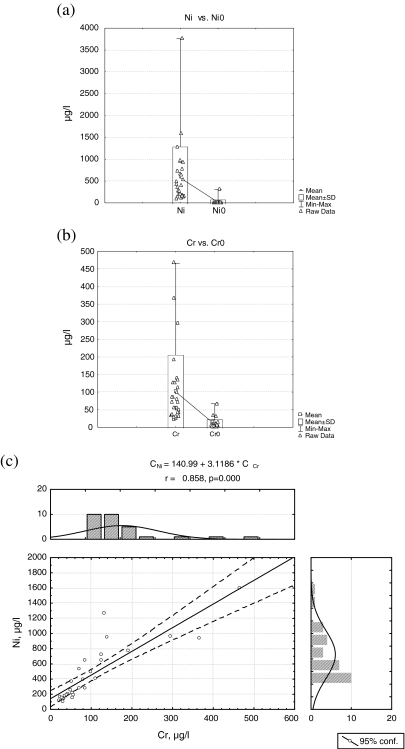
The values for Ni and Cr ions are given in Table 2 and in Figs. 1 and 2. These were given particular attention because of their mutagenic, cytotoxic, and allergenic properties [20–24].
Table 2.
Descriptive statistics and results of parametric t test for transformed data and non-parametric Mann–Whitney U test for the assessment of differences between the experimental and control groups for the release of nickel and chromium ions from orthodontic appliances (in µg/l, N = 30)
| Element | Meana (Exp) | Mean (control) | p (t test, log) | p (Mann–Whitney U) |
|---|---|---|---|---|
| Ni | 573.1 ± 709.7 | 14.8 ± 56.4 | 0.0000 | – |
| Cr | 100.7 ± 104.4 | 8.18 ± 13.7 | – | 0.0000 |
Exp experimental
aValues in micrograms per liter, n = 30
Fig. 1.
a–c Mean concentrations of elements in artificial saliva with and without appliances
Fig. 2.
Box plot graph for concentration of Ni ions (a) in artificial saliva with (Ni) and without (Ni0) orthodontic appliance and for Cr (Cr, Cr0) (b). c Scatter plot showing the correlation between Ni and Cr ions in artificial saliva incubated with orthodontic appliance
The solution of artificial saliva in the experimental group contained 39 times more Ni than the control solution. The high variation of the results in the experimental set (124% RSD) and between the experimental set and the controls (381% RSD) is due to the differences in the course of the corrosion process.
There was a highly significant correlation between the concentrations of released Ni and Cr into artificial saliva (r = 0.858, p = 0.0000; Fig. 2c). Outlier/extreme data for Cr and Ni were the result of the differences in the extent of corrosion in some samples. These differences might be due to increased corrosion due to the presence of bacteria in some samples.
Table 3 presents a correlation matrix of statistically significant correlations between the concentrations of ions in artificial saliva incubated with metallic appliances. Two groups of intercorrelated elements can be distinguished. The first group includes Ni, Cr, Fe, Cu, M, and, Co; the second includes Si, K, S, Ti, Mn, V, and Ca. In the first group Ni, Cr, Fe, and Mn are the main components of alloys, while Cu and Co probably originate from weld. The highest correlations were between Fe and Cr (r = 0.944) and between Ni and Cr (r = 0.858), suggesting that these ions were released together as a result of corrosion. Among the toxic elements determined, nickel level increased the most.
Table 3.
Inter-element correlation matrix for the concentrations of elements in artificial saliva with immersed fixed orthodontic appliance (n = 30)
| Mg | Al | Si | P | S | K | Ca | Ti | V | Mn | Fe | Co | Cu | Zn | Ni | Cr | |
|---|---|---|---|---|---|---|---|---|---|---|---|---|---|---|---|---|
| Mg | ||||||||||||||||
| 0.6080 | Al | |||||||||||||||
| p = 0.000 | ||||||||||||||||
| 0.6260 | 0.6955 | 0.4441 | 0.4156 | Si | ||||||||||||
| p = 0.000 | p = 0.000 | p = 0.014 | p = 0.022 | |||||||||||||
| P | ||||||||||||||||
| 0.4845 | S | |||||||||||||||
| p = 0.007 | ||||||||||||||||
| 0.5501 | 0.4636 | 0.6996 | 0.4130 | K | ||||||||||||
| p = 0.002 | p = 0.010 | p = 0.000 | p = 0.023 | |||||||||||||
| 0.6177 | 0.4135 | 0.3806 | Ca | |||||||||||||
| p = 0.000 | p = 0.023 | p = 0.038 | ||||||||||||||
| Ti | ||||||||||||||||
| 0.3769 | 0.4747 | 0.3839 | 0.4743 | 0.4014 | V | |||||||||||
| p = 0.040 | p = 0.008 | p = 0.036 | p = 0.008 | p = 0.028 | ||||||||||||
| 0.4119 | 0.6732 | Mn | ||||||||||||||
| p = 0.024 | p = 0.000 | |||||||||||||||
| 0.7032 | 0.5501 | 0.9440 | Fe | |||||||||||||
| p = 0.000 | p = 0.002 | p = 0.000 | ||||||||||||||
| 0.5785 | 0.5080 | 0.8145 | Co | |||||||||||||
| p = 0.001 | p = 0.004 | p = 0.000 | ||||||||||||||
| 0.5989 | Cu | |||||||||||||||
| p = 0.000 | ||||||||||||||||
| Zn | ||||||||||||||||
| 0.8580 | Ni | |||||||||||||||
| p = 0.000 | ||||||||||||||||
| Cr |
Multiple linear regression analysis was used to identify the elements associated with nickel from corroded alloys. The results show that the concentration of Ni was influenced by the concentration of Co, in accordance with the following equation:
 |
1 |
Release Coefficients
The specific coefficient α was defined as follows:
 |
2 |
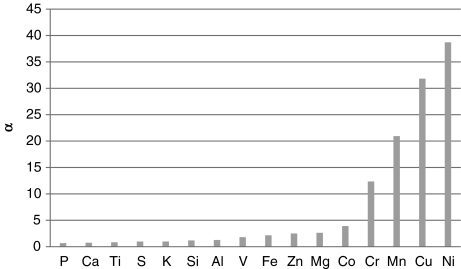
This coefficient gives the degree of release of metal ions from orthodontic appliances (Fig. 3). A value of α >1 indicates that a given element is released, while α < 1 would mean that its concentration has decreased. Out of the 16 studied elements, the higher values of the α coefficient for metallic components of alloys were: Ni > Cu > Mn > Cr > Co > Mg > Zn. Ni, Cr, Fe, and Si were the components of alloys and were dissoluted from the biomaterial. Amongst all the elements, which were found in stainless steel, the concentration of only Mo did not increase.
Fig. 3.
Coefficient α for element release into artificial saliva
Coefficient β was defined in the following formula:
 |
3 |
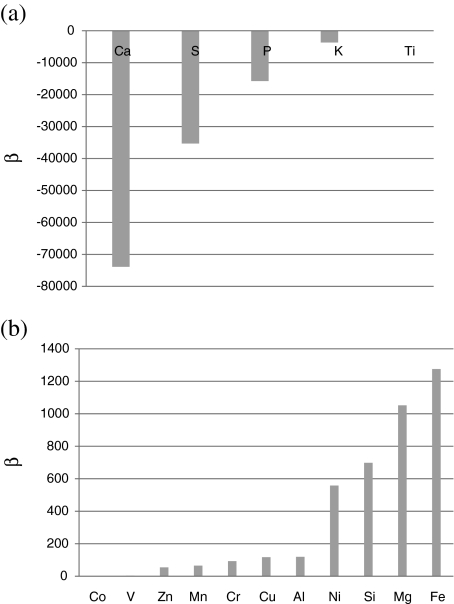
This coefficient is the difference between the concentrations of ions in artificial saliva in which the appliances were incubated in relation to the control solution. Two groups of elements were distinguished (Fig. 4a, b). The first group (β < 0) included the components of artificial saliva—Ca, S, P, K, and Ti—and the second included elements released from alloys, which increased in the order: Fe > Mg > Si > Ni > Al > Cu.
Fig. 4.
Coefficient β for the difference between the concentration (in micrograms per liter) of various metal ions in artificial saliva before and after incubation
Table 4 shows the quantity of chemical elements from individual components of the orthodontic appliance (bands, brackets, and wires) as well as with the complete appliance. The content of elements in individual components allowed calculating the mass of each element added into artificial saliva–orthodontic appliance (Table 5 and Eq. 4).
Table 4.
Mass of constituting elements of orthodontic appliances
| Wires | Lower brackets | Upper brackets | Lower bands | Upper bands | Complete appliance | |
|---|---|---|---|---|---|---|
| Mean | 0.4831 | 1.2559 | 1.3867 | 0.6236 | 1.0120 | 4.7163 |
| SD | 0.0017 | 0.0036 | 0.0400 | 0.0014 | 0.0017 | 0.0484 |
Mass values are in grams
Table 5.
Mass of particular elements of appliances, complete appliances, concentration of metal ions with/without appliance, coefficients β and γ
| Brackets (g) | Bands (g) | Wires (g) | Complete appliance (g) | Complete appliance (g/l) | Exp (μg/l) | Control (μg/l) | β (μg/l) | γ (%) | |
|---|---|---|---|---|---|---|---|---|---|
| Si | 0.0317 | 0.0185 | 0.0044 | 0.0546 | 2.18 | 4491 | 3793 | 698 | 3.198 |
| Cr | 0.4989 | 0.3297 | 0.1225 | 0.9512 | 38.05 | 101 | 8.18 | 92.82 | 0.024 |
| Fe | 1.9246 | 1.1116 | 0.4554 | 3.4915 | 139.66 | 2382 | 1107 | 1275 | 0.091 |
| Ni | 0.1855 | 0.1587 | 0.0540 | 0.3982 | 15.93 | 573 | 14.8 | 558.2 | 0.350 |
| Mn | 0.0000 | 0.0000 | 0.0064 | 0.0064 | 0.26 | 68 | 3.247 | 64.75 | 2.513 |
In addition, a third coefficient, γ (elements release coefficient), was expressed as:
 |
4 |
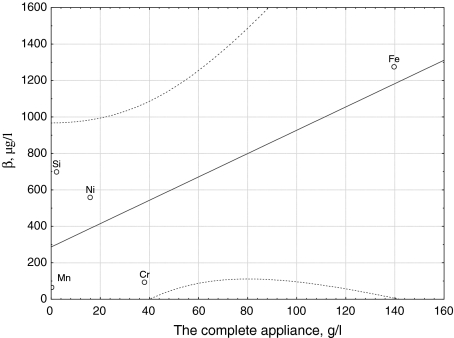
Figure 5 presents the dependence between the concentration of ions released from the appliance and the concentration of elements introduced with the appliance. Each element was released to a different extent, indicated by the lack of statistically significant correlations between the coefficients and different values of γ (0.35–3.20%), which represents the transfer of elements from an alloy to the solution. Correlation matrices are presented in Table 6. High and statistically significant correlations between the content of elements in particular contributory parts of the appliance were proved, which showed similarity of the alloys, of which brackets bands and wires were made (r > 0.998, p = 0.000).
Fig. 5.
Dependence between the concentrations of elements introduced with the appliance and the increase of their concentrations in artificial saliva
Table 6.
Matrix of linear correlations between the mass of elements Cr, Fe, Ni, and Mn introduced with constituting elements and ions released to artificial saliva
| Brackets | Bands | Wires | Complete appliance | Exp | Control | β | γ | |
|---|---|---|---|---|---|---|---|---|
| 0.9985 | 0.9997 | 0.9998 | Brackets | |||||
| p = 0.000 | p = 0.000 | p = 0.000 | Bands | |||||
| 0.9991 | 0.9994 | Wires | ||||||
| p = 0.000 | p = 0.000 | Complete appliance | ||||||
| 0.9999 | Exp | |||||||
| p = 0.000 | Control | |||||||
| 0.9720 | β | |||||||
| p = 0.006 | γ |
Discussion
Literature reports focus mainly on the release of Ni and Cr from orthodontic appliances. Comparison of results with literature values is not straightforward due to the use of a wide range of analytical techniques and incubation media.
In this study, the concentration of Ni ions in artificial saliva in which orthodontic appliances were incubated was determined as 573 μg/l. This value is comparable to that of Hwang et al. [19] and Kutha et al. [27]. Studies published in 1983 and 1993 report significantly higher nickel values, probably due to differences in the technique and methods used at the time [29, 30]. On the other hand, Gürsoy et al. [25] found a low concentration of Ni (20 μg/l), which can be due to differences in the technique (ICP-AES with a relatively high limit of detection) or materials used (Stst brackets, NiTi wires, and bands).
In general, although the same types of alloys were used in related studies, the results differ due to differences in the technology of materials production, galvanic coatings, as well as differences in the composition of alloys and in the analytical techniques such as different sensitivities, detection limits, and interferences [12].
There are several reports on the dissolution of metal ions from orthodontic appliances and other dental materials in artificial saliva [19, 25–28]. The methodology usually included batch tests, where fixed orthodontic appliances were incubated in artificial saliva for approx. 30 days at 37°C, and the concentration of metal ions was determined in experimental and control groups. However, rarely the results were interpreted and recalculated to estimate whether orthodontic treatment is a significant source of exposure to toxic trace elements.
In the present investigation, the concentration of metal ions in artificial saliva reached (in micrograms per liter) 573 for Ni, 101 for Cr, 68 for Mn, and 2382 for Fe. These values can be related to the degree of exposure to metal ions of a patient undergoing orthodontic treatment. In the 15 July 1980 guidelines of the European Council Directive for the quality of water intended for human consumption (80/778/EEC) [31], Ni and Cr ions are classified into the group of toxic substances and Fe and Mn as substances potentially toxic. For the first two elements, the maximum admissible concentration (MAC) was 50 μg/l for Ni and Cr. For Fe and Mn, their MACs were 200 and 50 μg/l, respectively, while the recommended (or guide) levels were 50 μg/l for Fe and 20 μg/l for Mn.
As such, the concentration of Ni transferred from the appliances to the artificial saliva in this experiment was 11 times and that of Cr double the maximum levels set as acceptable for drinking water in Europe. The concentration of Mn was 1.4 times and the concentration of Fe 12 times the acceptable levels. If the American standards are used for comparison, the concentration of Ni ions was 5.5 times higher, while Cr was at an acceptable level [32].
It is possible to relate our results to the recommended daily doses of metals for human. The estimated daily intakes are: 165 μg/day for Ni, 150 μg/day for Cr, 3.7 mg/day for Mn, and 13 mg/day for Fe. The WHO recommended daily doses (RDD) for these elements are: Ni, 25–35 μg/day; Cr, 50–200 μg/day; Mn, 2.5–6 mg/day; Fe, 10–18 mg/day [33]. The volume of artificial saliva (in milliliters) that would provide the RDD of these elements would be 61 for Ni, 1,980 for Cr, 88,235 for Mn, and 7,557 for Fe. This indicates that the only possible risk of exposure for orthodontic patients would be nickel.
Conclusions
The solution to the complex problem of the biocompatibility of materials used in orthodontics requires the cooperation of researchers who specialize in materials science, trace elements analysis, and toxicology of metals.
The conclusion of this study is that the use of fixed orthodontic appliances made of stainless steel can be a source of risk exposure to nickel. The coefficients here presented show which elements are dissolved to the highest extent and that their release is not proportional to their content in an alloy. Such a quantitative approach might be a step forward toward the recalculation of the results of in vitro tests to in vivo conditions. Such a model would make possible selecting the most biocompatible materials by in vitro tests based on the determination of the release coefficients α, β, and γ.
More in vivo experiments will help determine whether the levels of dissolved nickel reach toxic or sub-toxic concentrations.
Acknowledgments
The Polish National Centre for Research and Development funded the present work (project no. NR13000610).
Open Access
This article is distributed under the terms of the Creative Commons Attribution Noncommercial License which permits any noncommercial use, distribution, and reproduction in any medium, provided the original author(s) and source are credited.
References
- 1.Wise DL (ed) (2000) Biomaterials and bioengineering handbook. Marcel Dekker, New York
- 2.Pereira ML, Silva A, Tracana R, Carvalho GS. Toxic effects caused by stainless steel corrosion products on mouse seminiferous cells. Cytobios. 1994;77:73–80. [PubMed] [Google Scholar]
- 3.Basketter DA, Briatico-Vangosa G, Kaestner W, Lally C, Bontinck WJ. Nickel, cobalt and chromium in consumer products: a role in allergenic contact dermatitis? Contact Dermatitis. 1993;28:15–25. doi: 10.1111/j.1600-0536.1993.tb03318.x. [DOI] [PubMed] [Google Scholar]
- 4.Bass JK, Fine H, Cisneros GJ. Nickel hypersensitivity in the orthodontic patient. Am J Orthod Dentofac Orthop. 1993;103:280–285. doi: 10.1016/0889-5406(93)70009-D. [DOI] [PubMed] [Google Scholar]
- 5.Jensen CS, Menné T, Lisby S, Kristiansen J, Veien NK. Experimental systemic contact dermatitis from nickel: a dose response study. Contact Dermatitis. 2003;49:124–132. doi: 10.1111/j.0105-1873.2003.00157.x. [DOI] [PubMed] [Google Scholar]
- 6.Kolokitha O, Kaklamanos EG, Papadopoulos MA. Prevalence of nickel hypersensitivity in orthodontic patients: a meta-analysis. Am J Orthod Dentofacial Orthop. 2008;134:722.e1–722.e12. doi: 10.1016/j.ajodo.2008.01.013. [DOI] [PubMed] [Google Scholar]
- 7.Oller AR, Costa M, Oberdorster G. Carcinogenicity assessment of selected nickel compounds. Toxicol Appl Pharmacol. 1997;143:152–166. doi: 10.1006/taap.1996.8075. [DOI] [PubMed] [Google Scholar]
- 8.Kerosuo H, Kullaa A, Kerosuo E, Kanerva L, Hensten-Pettersen A. Nickel allergy in adolescents in relation to orthodontic treatment and piercing of ears. Am J Orthod Dentofacial Orthop. 1996;109:148–154. doi: 10.1016/S0889-5406(96)70175-0. [DOI] [PubMed] [Google Scholar]
- 9.Janson GRP, Dainesi EA, Consolaro A, Woodside DG, de Freitas MR. Nickel hypersensitivity reaction before, during, and after orthodontic therapy. Am J Orthod Dentofacial Orthop. 1998;113:655–660. doi: 10.1016/S0889-5406(98)70226-4. [DOI] [PubMed] [Google Scholar]
- 10.Hayes RB. The carcinogenicity of metals in humans. Cancer Causes and Control. 1997;8:371–385. doi: 10.1023/A:1018457305212. [DOI] [PubMed] [Google Scholar]
- 11.Mikulewicz M, Chojnacka K. Trace metal release from orthodontic appliances by in vivo studies: a systematic literature review. Biol Trace Elem Res. 2010;137:127–138. doi: 10.1007/s12011-009-8576-6. [DOI] [PubMed] [Google Scholar]
- 12.Mikulewicz M, Chojnacka K. Trace metal release from orthodontic appliances by in vitro studies: a systematic literature review. Biol Trace Elem Res. 2010;139:241–256. doi: 10.1007/s12011-010-8670-9. [DOI] [PubMed] [Google Scholar]
- 13.Czégény ZS, Chicharro JL, Fernández P, Gutiérrez A, Camara C. Homogeneity and stability studies on sodium, calcium, magnesium, and manganese in human saliva. Biol Trace Elem Res. 2001;79:131–137. doi: 10.1385/BTER:79:2:131. [DOI] [PubMed] [Google Scholar]
- 14.Nagaraj G, Sukumar A, Nandlal B, Vellaichamy S, Thanasekaran K, Ramanathan AL. Tooth element levels indicating exposure profiles in diabetic and hypertensive subjects from Mysore, India. Biol Trace Elem Res. 2009;131:255–262. doi: 10.1007/s12011-009-8371-4. [DOI] [PubMed] [Google Scholar]
- 15.Monaci F, Bargagli E, Bravi F, Rottoli P. Concentrations of major elements and mercury in unstimulated human saliva. Biol Trace Elem Res. 2002;89:193–203. doi: 10.1385/BTER:89:3:193. [DOI] [PubMed] [Google Scholar]
- 16.Frisk P, Danersund A, Hudecek R, Lindh U. Changed clinical chemistry pattern in blood after removal of dental amalgam and other metal alloys supported by antioxidant therapy. Biol Trace Elem Res. 2007;120:163–170. doi: 10.1007/s12011-007-8026-2. [DOI] [PubMed] [Google Scholar]
- 17.Frisk P, Lindvall A, Hudecek R, Lindh U. Decrease of trace elements in erythrocytes and plasma after removal of dental amalgam and other metal alloys. Biol Trace Elem Res. 2006;113:247–259. doi: 10.1385/BTER:113:3:247. [DOI] [PubMed] [Google Scholar]
- 18.Hol PJ, Vamnes JS, Gjerdet NR, Eide R, Isrenn R. Dental amalgam affects urinary selenium excretion. Biol Trace Elem Res. 2002;85:137–147. doi: 10.1385/BTER:85:2:137. [DOI] [PubMed] [Google Scholar]
- 19.Hwang CJ, Shin JS, Cha JY. Metal release from simulated fixed orthodontic appliances. Am J Orthod Dentofacial Orthop. 2001;120:383–391. doi: 10.1067/mod.2001.117911. [DOI] [PubMed] [Google Scholar]
- 20.Lewis CG, Sunderman FW., Jr Metal carcinogenesis in total joint arthroplasty. Animal models. Clin Orthop. 1996;329:264–268. doi: 10.1097/00003086-199608001-00023. [DOI] [PubMed] [Google Scholar]
- 21.Kasprzak KS, Bialkowski K. Inhibition of antimutagenic enzymes, 8-oxo-dGTpases, by carcinogenic metals. J Inorg Biochem. 2000;79:231–236. doi: 10.1016/S0162-0134(99)00240-8. [DOI] [PubMed] [Google Scholar]
- 22.Al-Waheidi EM. Allergic reaction to nickel orthodontic wire: a case report. Quintessence Int. 1995;26:385–387. [PubMed] [Google Scholar]
- 23.Dunlap CL, Kirk Vincent S, Barker BF. Allergic reaction to orthodontic wire: report of a case. J Am Dent Assoc. 1989;118:449–450. doi: 10.14219/jada.archive.1989.0174. [DOI] [PubMed] [Google Scholar]
- 24.Sidhu P, Garg ML, Dhawan DK. Effect of zinc on biological half-lives of 65Zn in whole body and liver and on distribution of 65Zn in different organs of rats following nickel toxicity. Biol Trace Elem Res. 2004;102:173–188. doi: 10.1385/BTER:102:1-3:173. [DOI] [PubMed] [Google Scholar]
- 25.Gürsoy S, Acar AG, Seşen C. Comparison of metal release from new and recycled bracket–archwire combinations. Angle Orthod. 2004;75:92–94. doi: 10.1043/0003-3219(2005)075<0092:COMRFN>2.0.CO;2. [DOI] [PubMed] [Google Scholar]
- 26.Kerosuo H, Moe G, Kleven E. In vitro release of nickel and chromium from different types of simulated orthodontic appliances. Angle Orthod. 1995;65:111–116. doi: 10.1043/0003-3219(1995)065<0111:IVRONA>2.0.CO;2. [DOI] [PubMed] [Google Scholar]
- 27.Kuhta M, Pavlin D, Slaj M, Varga S, Lapter-Varga M, Slaj M. Type of archwire and level of acidity: effects on the release of metal ions from orthodontic appliances. Angle Orthod. 2009;79:102–110. doi: 10.2319/083007-401.1. [DOI] [PubMed] [Google Scholar]
- 28.Szynkowska MI, Sokolowski J, Rogowski J, Nagrodzka A, Leśniewska E, Albińska J, Pawlaczyk A, Samlik-Fronc I. ICP-TOF-MS, TOF-SIMS and AAS studies of corrosion resistance of dental alloys. Przem Chem. 2010;89:554–557. [Google Scholar]
- 29.Barrett RD, Bishara SE, Quinn JK. Biodegradation of orthodontic appliances. Part I. Biodegradation of nickel and chromium in vitro. Am J Orthod Dentofacial Orthop. 1993;103:8–14. doi: 10.1016/0889-5406(93)70098-9. [DOI] [PubMed] [Google Scholar]
- 30.Park HY, Shearer TR. In vitro release of nickel and chromium from simulated orthodontic appliances. Am J Orthod. 1983;84:156–159. doi: 10.1016/0002-9416(83)90180-X. [DOI] [PubMed] [Google Scholar]
- 31.Council Directive from July 15th, 1980 relating the quality of water intended for human consumption (80/778/EEC) (OJ L 229, 30.8.1980), p. 11
- 32.Scott JS, Smith PG. Dictionary of waste and water treatment. London: Butterworths; 1981. [Google Scholar]
- 33.Kabata-Pendias A, Pendias H (1993) Biogeochemistry of trace elements. PWN, Warsaw, pp 53–66 (in Polish)


